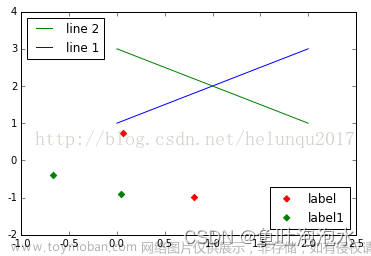
1、首先在绘图时,加入label标签
plt.plot(x, y1, label='自己', color = 'pink', linestyle = '-.')
plt.plot(x, y2, label='同桌', color = 'cyan', linestyle = ':')
2、设置显示图例函数
#添加图例  loc位置
plt.legend()
loc表示位置,在函数定义中的值分别是:
'best' : 0
'upper right' : 1
'upper left' : 2
'lower left' : 3
'lower right' : 4
'right' : 5
'center left' : 6
'center right' :7
'lower center' : 8
'upper center' : 9文章来源:https://www.toymoban.com/news/detail-400433.html
'center' : 10文章来源地址https://www.toymoban.com/news/detail-400433.html
到了这里,关于python学习之绘图后图例位置设置的文章就介绍完了。如果您还想了解更多内容,请在右上角搜索TOY模板网以前的文章或继续浏览下面的相关文章,希望大家以后多多支持TOY模板网!


