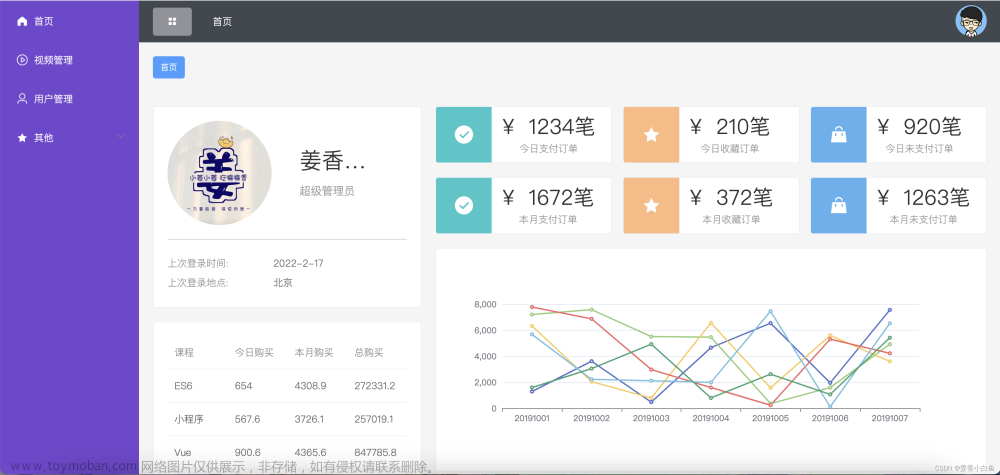
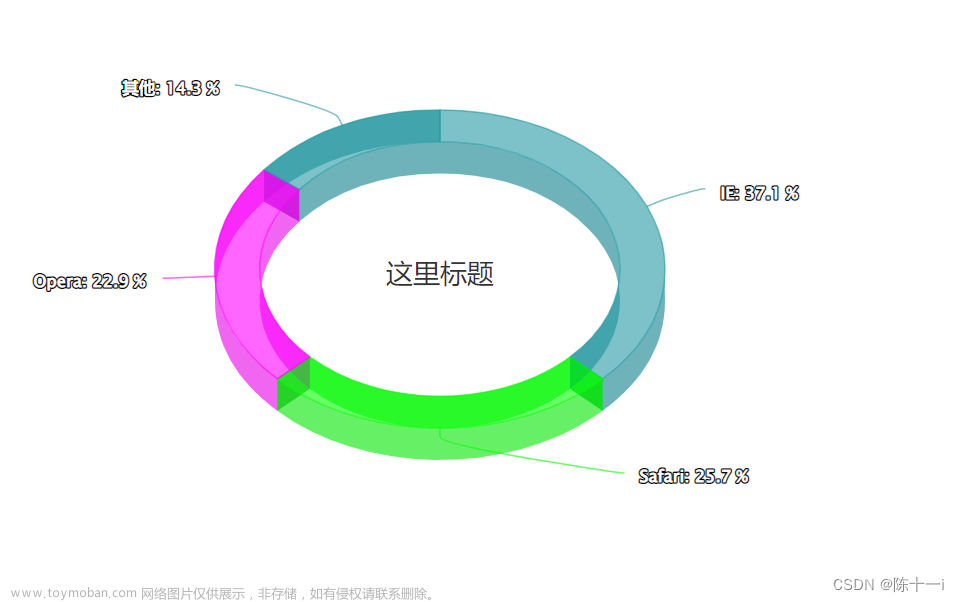
vue2之echarts的封装 折线图,饼图,大图

这篇具有很好参考价值的文章主要介绍了vue2之echarts的封装 折线图,饼图,大图。希望对大家有所帮助。如果存在错误或未考虑完全的地方,请大家不吝赐教,您也可以点击"举报违法"按钮提交疑问。

vue2之echarts的封装 折线图,饼图,大图

折线图,饼图

chartPan.vue

<template>
    <div>
        <div
            class="chart-header"
            :style="{'margin-bottom': chartType == 'line' ? '20px' : 0}"
        >
            <span class="chart-title">{{ title }}</span>
            <slot name="right" />
        </div>
        <div
            v-if="!isNoData"
        >
            <div
                ref="pie"
                class="echarts"
                :style="{'height': chartHeight}"
            />
        </div>
        <div
            v-else
            class="no-data"
        >
            <empty :imagew="160" />
        </div>
    </div>
</template>
<script>
import echarts from 'echarts';

export default {
    props: {
        chartType: {
            type: String,
            default: 'pie'
        },
        chartHeight: {
            type: String,
            default: '220px'
        },
        title: {
            type: String,
            default: ''
        }
    },
    data() {
        return {
            isNoData: false
        };
    },
    methods: {
        pieInit(data, text, subtext, tab = 'node') {
            data = data.filter(i=>+i.value != 0);
            if (data.length < 1) {
                this.isNoData = true;
            } else {
                this.isNoData = false;
            }
            if (this.isNoData) return;
            this.$nextTick(()=>{

                let myChart = echarts.init(this.$refs['pie']);
                myChart.clear();
                myChart.setOption({
                    tooltip: {
                        trigger: 'item'
                    },
                    legend: {
                        orient: 'vertical',
                        right: '10%',
                        top: tab === 'node' || data.length < 5 ? '22%' : null,
                        itemGap: tab === 'node' ? 17 : 10,
                        itemWidth: 8,
                        icon: 'circle',
                        textStyle: {
                            color: '#666',
                            lineHeight: 25
                        },
                        formatter: (name) => {
                            let tarValue;
                            for (let i = 0; i < data.length; i++) {
                                if (data[i].name == name) {
                                    tarValue = data[i].value;
                                }
                            }
                            return `${name}:  ${tarValue}`;
                        }
                    },

                    title: {
                        show: !!subtext,
                        text: text,
                        textAlign: 'middle',
                        subtext: `${subtext}`,
                        left: '26%',
                        top: '25%',
                        itemGap: 15,
                        textStyle: {
                            fontSize: 14,
                            color: '#666',
                            fontWeight: 400
                        },
                        subtextStyle: {
                            fontSize: 24,
                            color: '#333',
                            fontWeight: 600
                        }
                    },
                    textStyle: {
                        rich: {
                            a: {
                                verticalAlign: 'middle'
                            }
                        },
                        lineHeight: 8,
                        padding: [0, 5, -2, 0]
                    },
                    color: ['#6E99F0', '#47C8A3', '#FAC858', '#FFA660', '#FF8579', '#A3B3D6'],
                    series: [
                        {
                            type: 'pie',
                            minAngle: 25,
                            center: [subtext ? '5%' : '18%', subtext ? '20%' : '45%'],
                            radius: ['75%', '116%'],
                            left: 'center',
                            top: 'center',
                            avoidLabelOverlap: false,
                            labelLine: {
                                show: false
                            },
                            label: {
                                show: false
                            },
                            data
                        }
                    ]
                });
                myChart.resize();
                window.addEventListener('resize', () => {
                    myChart.resize();
                });

            });
        },
        lineInit(date, data, subtext = '(%)', tab = 'node') {
            data = data.filter(i=>+i.value != 0);
            if (data.length < 1) {
                this.isNoData = true;
            } else {
                this.isNoData = false;
            }
            if (this.isNoData) return;
            this.$nextTick(()=>{

                let myChart = echarts.init(this.$refs['pie']);
                myChart.clear();
                myChart.setOption({
                    tooltip: {
                        trigger: 'axis',
                        position: function(point, params, dom, rect, size) {
                            var x = 0; // x坐标位置
                            var y = 0; // y坐标位置
                            var pointX = point[0];
                            var pointY = point[1];
                            // 提示框大小
                            var boxWidth = size.contentSize[0];
                            var boxHeight = size.contentSize[1];
                            if (boxWidth > pointX) {
                                x = 5;
                            } else { // 左边放的下
                                x = pointX - boxWidth;
                            }
                            if (boxHeight > pointY) {
                                y = 5;
                            } else { // 上边放得下
                                y = pointY - boxHeight;
                            }
                            return [x, y];
                        },
                        formatter: function(params) {
                            let color = params[0].color;
                            let marker = '<span style="display:inline-block;margin-right:5px;border-radius:10px;width:9px;height:9px;background-color:' + color + ';"></span>';
                            let res = params[0].name + '<br/>' + marker + params[0].value + subtext;
                            return res;
                        }
                    },
                    grid: {
                        top: '13%',
                        left: '15%',
                        right: 0,
                        bottom: '20%'
                    },
                    xAxis: {
                        type: 'category',
                        offset: 8,
                        data: date,
                        axisLabel: {
                            color: '#666',
                            formatter: function(value) {
                                return value.substring(value.length - 8);
                            }
                        }
                    },
                    title: {
                        subtext: subtext,
                        subtextStyle: {
                            textAlign: 'right',
                            color: '#666'
                        },
                        // padding: [0, 10],
                        top: 0,
                        left: tab === 'node' ? '5%' : '8%',
                        itemGap: 0
                    },
                    yAxis: {
                        type: 'value',
                        boundaryGap: false,
                        axisLine: {
                            show: false
                        },
                        axisLabel: {
                            color: '#666'
                        },
                        axisTick: {
                            show: false
                        }
                    },
                    series: [
                        {
                            type: 'line',
                            symbol: 'none',
                            sampling: 'lttb',
                            itemStyle: {
                                color: 'rgb(110, 153, 240)'
                            },
                            areaStyle: {
                                color: new echarts.graphic.LinearGradient(0, 0, 0, 1, [
                                    {
                                        offset: 0,
                                        color: '#6E99F0'
                                    },
                                    {
                                        offset: 1,
                                        color: '#ffffff'
                                    }
                                ])
                            },
                            data: data
                        }
                    ]

                });
                myChart.resize();
                window.addEventListener('resize', () => {
                    myChart.resize();
                });

            });
        },
        markLineInit(date, data, subtext = '(%)', tab = 'node', limit, request) {
            data = data.filter(i=>+i.value != 0);
            if (data.length < 1) {
                this.isNoData = true;
            }
            if (this.isNoData) return;
            this.$nextTick(()=>{

                let myChart = echarts.init(this.$refs['pie']);
                myChart.clear();
                myChart.setOption({
                    tooltip: {
                        trigger: 'axis',
                        position: function(point, params, dom, rect, size) {
                            var x = 0; // x坐标位置
                            var y = 0; // y坐标位置
                            var pointX = point[0];
                            var pointY = point[1];
                            // 提示框大小
                            var boxWidth = size.contentSize[0];
                            var boxHeight = size.contentSize[1];
                            if (boxWidth > pointX) {
                                x = 5;
                            } else { // 左边放的下
                                x = pointX - boxWidth;
                            }
                            if (boxHeight > pointY) {
                                y = 5;
                            } else { // 上边放得下
                                y = pointY - boxHeight;
                            }
                            return [x, y];
                        },
                        formatter: function(params) {
                            let color = params[0].color;
                            let marker = '<span style="display:inline-block;margin-right:5px;border-radius:10px;width:9px;height:9px;background-color:' + color + ';"></span>';
                            let res = params[0].name + '<br/>' + marker + params[0].value + subtext;
                            return res;
                        }
                    },
                    color: ['#6E99F0'],
                    title: {
                        subtext: subtext,
                        subtextStyle: {
                            textAlign: 'right',
                            color: '#666'
                        },
                        top: 0,
                        left: tab === 'node' ? '5%' : '8%',
                        itemGap: 0
                    },
                    grid: {
                        top: '15%',
                        left: '15%',
                        right: 0,
                        bottom: '15%'
                    },
                    xAxis: {
                        type: 'category',
                        boundaryGap: false,
                        data: date,
                        axisLabel: {
                            color: '#666',
                            formatter: function(value) {
                                return value.substring(value.length - 8);
                            }

                        }

                    },
                    yAxis: {
                        type: 'value',
                        max: limit >= request ? limit + 1 : request + 1,
                        boundaryGap: false,
                        axisLine: {
                            show: false
                        },
                        axisLabel: {
                            color: '#666'
                        },
                        axisTick: {
                            show: false
                        }
                    },
                    series: {
                        type: 'line',
                        data: data,
                        markLine: {
                            silent: true,
                            data: [
                                {
                                    yAxis: limit,
                                    lineStyle: {
                                        color: '#47C8A3',
                                        type: 'solid',
                                        cap: 'round'
                                    }
                                },
                                {
                                    yAxis: request,
                                    lineStyle: {
                                        type: 'solid',
                                        cap: 'round',
                                        color: '#FAC858'
                                    }
                                }
                            ]
                        }
                    }

                });
                myChart.resize();
                window.addEventListener('resize', () => {
                    myChart.resize();
                });

            });
        }
    }
};
</script>
<style lang="scss" scoped>

.echarts {
	width: 100%;
}

.no-data {
	width: 100%;
	height: 220px;
	display: flex;
	justify-content: center;
	align-items: center;
}

.chart-header {
	display: flex;
	justify-content: space-between;
	align-items: center;
}

.chart-title {
	font-weight: 600;
	color: #333333;
	font-size: 16px
}
</style>

使用 chartPan.vue 之饼图

<chartPan
 ref="pieNode"
:title="tab == 'node' ? '节点' : '负载'"
 />
console.log('arr', arr); // [ {"name": "master节点","value": "1" },{ "name": "worker节点", "value": "1"}]
console.log('sum', sum); // sum 2
this.$refs.pieNode ? this.$refs.pieNode.pieInit(arr, `${this.tab === 'node' ? '节点' : ''}总数`, sum, 'node) : '';

效果

vue2之echarts的封装 折线图,饼图,大图

使用 chartPan.vue 之折线图

    <chartPan
        ref="cpu"
        :title="tab == 'node' ? 'CPU使用率' : 'CPU用量'"
        chart-type="line"
        chart-height="200px"
    >
        <div slot="right">
            <i
                class="iconfont icon-color icon-shuaxin"
                @click="getUseRateCpu"
            />
            <i
                class="iconfont icon-color icon-fangda"
                style="margin-left: 12px"
                @click="handlePreViewChart('cpu', tab == 'node' ? 'CPU使用率' : 'CPU用量')"
            />
        </div>
    </chartPan>

                console.log('chartDate', chartDate); // ['2023-04-25 17:57:01', '2023-04-25 17:58:01', '2023-04-25 17:59:01',]
                console.log('chartData', chartData); // [4.92, 4.84, 5.07, 4.96, 5.06,]
                this.$refs.cpu ? this.$refs.cpu.lineInit(chartDate, chartData, this.tab === 'node' ? '(%)' : '(核)', this.tab) : '';

效果

vue2之echarts的封装 折线图,饼图,大图

展开大图

  • handlePreViewChart 事件
            <maxChart
                ref="maxChart"
                :chart-data="chartPublicData"
            />

        // 展示大dialog 图形
        handlePreViewChart(type, title) {

            console.log('maxCpuChartData', this.maxCpuChartData); //
			{
				subtext: "(%)", 
				maxChartDate : [ "2023-04-25 17:57:10", "2023-04-25 17:58:10","2023-04-25 17:59:10","2023-04-25 18:00:10",],
				maxChartData : [4.92,4.84,5.07]
			}

            this.chartPublicData = type === 'cpu' ? { ...this.maxCpuChartData } : { ...this.maxMemChartData };
            this.$refs.maxChart.title = title;
            this.$refs.maxChart.dialogVisible = true;
        },

大图组件 maxChart.vue

<template>
    <el-dialog
        :title="title"
        :visible.sync="dialogVisible"
        append-to-body
        width="1000px"
        @open="openDialogVisible"
    >
        <div class="dialog-wrap">
            <div
                ref="chart"
                class="echarts"
            />
        </div>
    </el-dialog>
</template>
<script>
import echarts from 'echarts';

export default {
    props: {
        lineType: {
            type: String,
            default: 'line'
        },
        chartData: {
            type: Object,
            default: () => {}
        }
    },
    data() {
        return {
            title: '',
            dialogVisible: false
        };
    },
    methods: {
        openDialogVisible() {
            this.$nextTick(() => {
                this.lineType === 'line' ? this.lineInit(this.chartData.maxChartDate, this.chartData.maxChartData, this.chartData.subtext)
                    : this.markLineInit(this.chartData.maxChartDate, this.chartData.maxChartData, this.chartData.subtext, this.chartData.limit, this.chartData.request);
            });
        },
        lineInit(date = [], data, subtext = '(%)') {
            this.$nextTick(()=>{
                let myChart = echarts.init(this.$refs['chart']);
                myChart.clear();
                myChart.setOption({
                    tooltip: {
                        trigger: 'axis',
                        position: function(point, params, dom, rect, size) {
                            var x = 0; // x坐标位置
                            var y = 0; // y坐标位置
                            var pointX = point[0];
                            var pointY = point[1];
                            // 提示框大小
                            var boxWidth = size.contentSize[0];
                            var boxHeight = size.contentSize[1];
                            if (boxWidth > pointX) {
                                x = 5;
                            } else { // 左边放的下
                                x = pointX - boxWidth;
                            }
                            if (boxHeight > pointY) {
                                y = 5;
                            } else { // 上边放得下
                                y = pointY - boxHeight;
                            }
                            return [x, y];
                        },
                        formatter: function(params) {
                            let color = params[0].color;
                            let marker = '<span style="display:inline-block;margin-right:5px;border-radius:10px;width:9px;height:9px;background-color:' + color + ';"></span>';
                            let res = params[0].name + '<br/>' + marker + params[0].value + subtext;
                            return res;
                        }
                    },
                    dataZoom: [
                        {
                            show: date.length > 10,
                            type: 'slider'
                        }
                    ],
                    grid: {
                        top: '13%',
                        left: '10%',
                        right: 0,
                        bottom: '10%'
                    },
                    xAxis: {
                        type: 'category',
                        offset: 15,
                        data: date,
                        axisLabel: {
                            color: '#666',
                            formatter: function(value) {
                                return value.substring(value.length - 8);
                            }
                        }
                    },
                    title: {
                        subtext: subtext,
                        subtextStyle: {
                            textAlign: 'right',
                            color: '#666'
                        },
                        padding: [0, 60],
                        top: 0,
                        itemGap: 0
                    },
                    yAxis: {
                        type: 'value',
                        boundaryGap: false,
                        axisLine: {
                            show: false
                        },
                        axisLabel: {
                            color: '#666'
                        },
                        axisTick: {
                            show: false
                        }
                    },
                    series: [
                        {
                            type: 'line',
                            symbol: 'none',
                            sampling: 'lttb',
                            itemStyle: {
                                color: 'rgb(110, 153, 240)'
                            },
                            areaStyle: {
                                color: new echarts.graphic.LinearGradient(0, 0, 0, 1, [
                                    {
                                        offset: 0,
                                        color: '#6E99F0'
                                    },
                                    {
                                        offset: 1,
                                        color: '#ffffff'
                                    }
                                ])
                            },
                            data: data
                        }
                    ]

                });
                myChart.resize();
                window.addEventListener('resize', () => {
                    myChart.resize();
                });

            });
        },
        markLineInit(date, data, subtext = '(%)', limit, request) {
            data = data.filter(i=>+i.value != 0);
            if (data.length < 1) {
                this.isNoData = true;
            }
            if (this.isNoData) return;
            this.$nextTick(() => {
                let myChart = echarts.init(this.$refs['chart']);
                myChart.clear();
                myChart.setOption({
                    tooltip: {
                        trigger: 'axis',
                        position: function(point, params, dom, rect, size) {
                            var x = 0; // x坐标位置
                            var y = 0; // y坐标位置
                            var pointX = point[0];
                            var pointY = point[1];
                            // 提示框大小
                            var boxWidth = size.contentSize[0];
                            var boxHeight = size.contentSize[1];
                            if (boxWidth > pointX) {
                                x = 5;
                            } else { // 左边放的下
                                x = pointX - boxWidth;
                            }
                            if (boxHeight > pointY) {
                                y = 5;
                            } else { // 上边放得下
                                y = pointY - boxHeight;
                            }
                            return [x, y];
                        },
                        formatter: function(params) {
                            let color = params[0].color;
                            let marker = '<span style="display:inline-block;margin-right:5px;border-radius:10px;width:9px;height:9px;background-color:' + color + ';"></span>';
                            let res = params[0].name + '<br/>' + marker + params[0].value + subtext;
                            return res;
                        }
                    },
                    color: ['#6E99F0'],
                    title: {
                        subtext: subtext,
                        subtextStyle: {
                            textAlign: 'right',
                            color: '#666'
                        },
                        top: 0,
                        left: '8%',
                        itemGap: 0
                    },
                    grid: {
                        top: '15%',
                        left: '15%',
                        right: 0,
                        bottom: '15%'
                    },
                    xAxis: {
                        type: 'category',
                        boundaryGap: false,
                        data: date,
                        axisLabel: {
                            color: '#666',
                            formatter: function(value) {
                                return value.substring(value.length - 8);
                            }
                        }
                    },
                    yAxis: {
                        type: 'value',
                        max: limit >= request ? limit + 1 : request + 1,
                        boundaryGap: false,
                        axisLine: {
                            show: false
                        },
                        axisLabel: {
                            color: '#666'
                        },
                        axisTick: {
                            show: false
                        }
                    },
                    series: {
                        type: 'line',
                        data: data,
                        markLine: {
                            silent: true,
                            data: [
                                {
                                    yAxis: limit,
                                    lineStyle: {
                                        color: '#47C8A3',
                                        type: 'solid',
                                        cap: 'round'
                                    }
                                },
                                {
                                    yAxis: request,
                                    lineStyle: {
                                        type: 'solid',
                                        cap: 'round',
                                        color: '#FAC858'
                                    }
                                }
                            ]
                        }
                    }

                });
                myChart.resize();
                window.addEventListener('resize', () => {
                    myChart.resize();
                });

            });
        }
    }
};
</script>
<style lang="scss" scoped>

.echarts {
	width: 100%;
	height: 500px;
}
</style>

大图效果

vue2之echarts的封装 折线图,饼图,大图文章来源地址https://www.toymoban.com/news/detail-429841.html

到了这里,关于vue2之echarts的封装 折线图,饼图,大图的文章就介绍完了。如果您还想了解更多内容,请在右上角搜索TOY模板网以前的文章或继续浏览下面的相关文章,希望大家以后多多支持TOY模板网!

本文来自互联网用户投稿,该文观点仅代表作者本人,不代表本站立场。本站仅提供信息存储空间服务,不拥有所有权,不承担相关法律责任。如若转载,请注明出处: 如若内容造成侵权/违法违规/事实不符,请点击违法举报进行投诉反馈,一经查实,立即删除!

领支付宝红包 赞助服务器费用

相关文章

  • 数据可视化,使用Echarts生成柱状图,折线图,饼图

    目录 ECharts的快速上手 步骤1:引入 echarts.js 文件 步骤2:准备一个呈现图表的盒子 步骤3:初始化 echarts 实例对象 步骤4:准备配置项 步骤5:将配置项设置给 echarts 实例对象 示例代码: 相关配置讲解: 效果展示:  1.柱状图 常见效果: 标记: 显示: 横向柱状图: 柱状图示

    2024年01月20日
    浏览(52)
  • VUE2+Element-ui+封装Echarts图表

    封装Echarts图表,如下效果图 Home组件代码块,使用的mock.js模拟数据封装 Echarts图表组件 安装所需依赖 cnpm i axios -S 安装axios接口请求 cnpm i mockjs 或 yarn add mockjs 安装mockjs生成模拟随机数据 cnpm i echarts 或 yarn add echarts 安装echarts图表 cnpm i element-ui -S 安装element-ui组件库 安装less c

    2024年02月08日
    浏览(48)
  • echarts的series——折线图,饼图,柱状图,散点图的配置

    🙂博主:小猫娃来啦 🙂文章核心: echarts的series——折线图,饼图,柱状图,散点图的配置 Echarts是一款基于JavaScript的开源可视化图表库,它具有以下优点: 1. 易于使用 : Echarts提供了丰富的图表类型和各种交互方式,用户可以通过简单的配置和API调用来创建各种复杂的图

    2024年02月01日
    浏览(63)
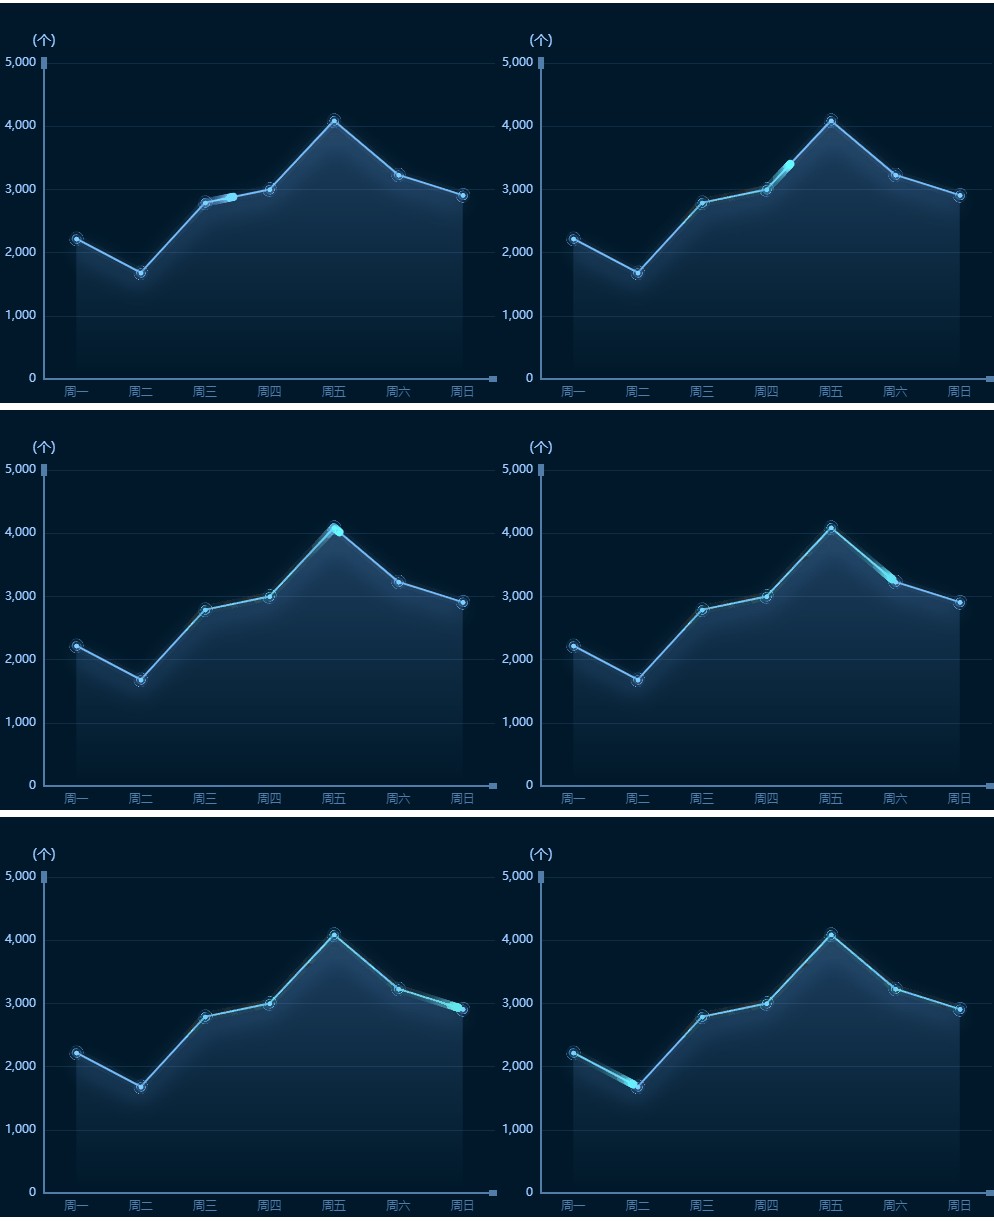
  • echarts看板效果图:流光折线图、3d柱状图、3d饼图、3d地图

    现在展厅的大看板是越花里胡哨越好,不过真的挺难做的。好在可以百度找到一些大神的作品进行参考。 下面的内容都是基于 echarts 5.3.3 和 vue3 。另外demo都是参考别人的案例。 效果图 代码 本质上是两条线组合在一起的,一条是静态的线条,一条是动态的线条。相关属性都

    2024年02月06日
    浏览(47)
  • 【Echart多场景示例应用】Echarts柱状图、折线图、饼图、雷达图等完整示例。 echarts主标题和副标题的位置、样式等设置(已解决附源码)

    **【写在前面】**前端时间做一个echarts的页面调整,临时客户要求加一个参数(总容量)显示,当时我就想用个默认的副标题吧,哪知客户和我说得紧跟在主标题后面,于是乎我就根据设置做了一个调整,我也是在网上看了一下,好些答案都是复制粘贴,文章各种抄袭的,遇

    2024年02月08日
    浏览(50)
  • vue中使用echarts与echarts-gl 实现3D饼图环形饼图

    注意:我不知道版本差异会不会有影响(可以指定版本 也可以借鉴我的) 指定版本命令 加个@后面跟版本号即可 成功之后可以在package.json中检查是否安装成功(如上图) 引入位置:我没有在main.js中全局引用,而是哪个页面用到就引入哪里 代码: 注意:我没有封装起来(你

    2024年02月03日
    浏览(48)
  • vue-echarts饼图/柱状图点击事件

    在实际的项目开发中,我们通常会用到Echarts来对数据进行展示,有时候需要用到Echarts的点击事件,增加系统的交互性,一般是点击Echarts图像的具体项来跳转路由并携带参数,当然也可以根据具体需求来做其他的业务逻辑。下面就Echarts图表的点击事件进行实现,文章省略了

    2024年02月06日
    浏览(48)
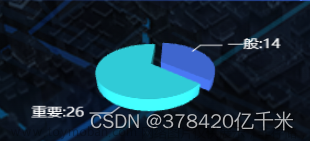
  • vue实现echarts3D饼图

    效果图: 1.首先安装依赖 2.mainjs中导入以及挂载 3.传入数据生成3D的配置项以及option的配置 4.指示线的配置

    2024年02月06日
    浏览(44)
  • vue3+heightchart实现3D饼图,echarts3D饼图,3D饼图引导线实现

     附上 heightcharts 官网地址  Highcharts 演示 | Highcharts https://www.hcharts.cn/demo/highcharts 首先需要下载一下 heightcharts执行命令  然后初始化: 如此你就得到了一个3D饼图 

    2024年02月13日
    浏览(37)
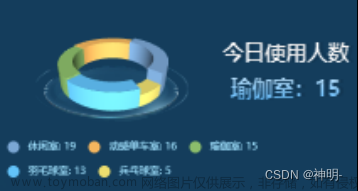
  • vue 使用echarts实现3D饼图和环形图

    记录一下echarts实现3d饼图和环形图功能## 标题 实现效果 首先第一步安装echarts和echarts-gl echarts-gl安装最新版本可能会有异常,建议安装\\\"echarts-gl\\\": \\\"^1.1.2\\\"版本 第二步在vue文件中引入 第三步我这里把实现3d饼图的代码给封装一下,如下: 第四步 vue文件内使用 饼图的实现 如果对

    2024年02月12日
    浏览(56)

觉得文章有用就打赏一下文章作者

支付宝扫一扫打赏

博客赞助

微信扫一扫打赏

请作者喝杯咖啡吧~博客赞助

支付宝扫一扫领取红包,优惠每天领

二维码1

领取红包

二维码2

领红包