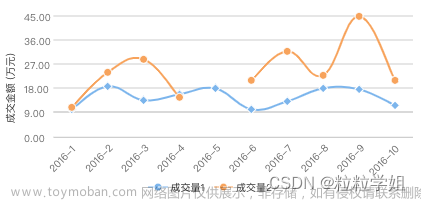
一、实现效果

二、echart引入参考另一位博主博客
微信小程序引入echarts图表(保姆式)_啊翔呀的博客-CSDN博客_微信小程序引入echarts
总结来就是以下几步
1.首先,下载echarts微信版 地址:GitHub - ecomfe/echarts-for-weixin: Apache ECharts 的微信小程序版本
2.把ec-canvas文件复制到项目中,由于我项目采用的是分包,故直接复制到需要使用到echart图表的包下。

3.在app.json文件中加入下代码
"usingComponents": {
    "ec-canvas": "/ec-canvas/ec-canvas"
  },
4.datacharts.wxml文件
<!-- 头部标题 -->
<view class="title_search">
  <view class="seeck_md">
    <!-- 返回 -->
    <view class="logout" bindtap="logout">
      <image class="logout_ic" src="/images/add.png">
      </image>
      <text class="logout_txt">返回</text>
    </view>
    <!--消息-->
    <view class="msg_title_center">
      <view class="msg" bindtap="open_msg">
        <text class="msg_txt">个人数据</text>
      </view>
    </view>
  </view>
  <view class="logout">
    <image class="logout_ic">
    </image>
    <text class="logout_txt"></text>
  </view>
</view>

<scroll-view class='scbg' scroll-y='true'>
   <!-- 刷新时间  -->
  <view class="refresh">{{titleDate}}</view>
  <view class="chart_module">
    <!-- 大气压等选择 -->
    <view class="blood_class_selet">
      <view bindtap="booldPress" class="{{pressList[0].checked?'bloodPressureActived':'bloodPressure'}}" >气压</view>
      <view bindtap="booldTa" class="{{pressList[1].checked?'bloodPressureActived':'bloodPressure'}}">大气</view>
      <view bindtap="booldO" class="{{pressList[2].checked?'bloodPressureActived':'bloodPressure'}}">
        OX</view>
      <view bindtap="booldHaert" class="{{pressList[3].checked?'bloodPressureActived':'bloodPressure'}}">频率</view>
      <view bindtap="booldWeight" class="{{pressList[4].checked?'weightActive':'weight'}}">
      重量</view>
    </view>
    <!--图表数据-->
    <view class="echarts">
      <ec-canvas force-use-old-canvas="true" id="my-echarts" canvas-id="echarts" ec="{{ec}}"></ec-canvas>
    </view>
    <!--月、季度、年选择-->
    <view class="day_select">
      <view class="time_interval">时间跨度</view>
      <view class="bottom_button">
        <view class="{{diseaseList[0].checked?'mouth':'mouthnomal'}}" bindtap="weekSelcet">月</view>
        <view class="{{diseaseList[1].checked?'yearative':'year'}}" bindtap="monthSelect">季</view>
        <view class="{{diseaseList[2].checked?'yearative':'year'}}" bindtap="yearselect">年</view>
      </view>
    </view>
  </view>

  <!-- 历史数据 -->
  <view class="history_data">历史数据</view>
  <block wx:for="{{HistoryDataList}}" wx:key="id" wx:for-item="itemName" wx:for-index="id">
    <view class='box'>
      <view class='firstblock'>
        <!-- 日期 -->
        <text class='showdata'>{{itemName.data_times}}</text>
        <view class='tel'>
          <text class='showdataone'>{{itemName.values}}</text>
          <!-- <text class='showdatatwo'>/{{itemName.values}}</text> -->
          <text class='dataunit'>{{itemName.unit}}</text>
        </view>
      </view>
    </view>
  </block>
</scroll-view>
5.datacharts.wxss
page {
  background: #f0f0f0;
  left: 0rpx;
  right: 0rpx;
}

.refresh {
  font-size: 22rpx;
  justify-content: center;
  display: flex;
  align-items: center;
  margin-top: 30rpx;
  margin-bottom: 20rpx;
}

/* 图表模块 */
.echarts {
  width: 580rpx;
  height: 400rpx;
  font-size: 24rpx;
  color: #000;
  background-color: white;
  border-radius: 30rpx;
  padding-bottom: 30rpx;
}
#echarts{
  background-color: #0455a7;
}

.chart_module {
  display: flex;
  justify-content: flex-end;
  margin-top: 30rpx;
  align-items: flex-end;
  margin-right: 30rpx;
  flex-direction: row;
}

/* 日期选择*/
.day_select {
  display: flex;
  position: absolute;
  flex-direction: row;
}

.time_interval {
  font-size: 28rpx;
  height: 56rpx;
  align-items: center;
  display: flex;
  color: #a7a7a7;
  margin-right: 10rpx;
}

/* 大气模块选择*/
.blood_class_selet {
  height: 430rpx;
  width: 80rpx;
  background-color: #d3d3d3;
  color: #000;
  border-radius: 20rpx;
  font-size: 28rpx;
  display: flex;
  flex-direction: column;
  align-items: center;
  justify-content: space-between;
  margin-right: 20rpx;
}

/* 大气*/
.bloodPressure {
  width: 74rpx;
  height: 64rpx;
  display: flex;
  flex-direction: row;
  align-items: center;
  justify-content: center;
  border-radius: 20rpx;
  margin-top: 4rpx;
}

.bloodPressureActived {
  width: 74rpx;
  height: 64rpx;
  background-color: white;
  display: flex;
  flex-direction: row;
  align-items: center;
  justify-content: center;
  border-radius: 20rpx;
  margin-top: 4rpx;
}

/* 重量 */
.weightActive {
  width: 74rpx;
  height: 64rpx;
  display: flex;
  flex-direction: row;
  align-items: center;
  justify-content: center;
  border-radius: 20rpx;
  margin-bottom: 4rpx;
  background-color: white;
}

.weight {
  width: 74rpx;
  height: 64rpx;
  display: flex;
  flex-direction: row;
  align-items: center;
  justify-content: center;
  border-radius: 20rpx;
  margin-bottom: 4rpx;
}
/* 重量 */

/* 时间选择模块*/
.bottom_button {
  display: flex;
  flex-direction: row;
  background-color: #d3d3d3;
  width: 280rpx;
  height: 56rpx;
  align-items: center;
  border-radius: 28rpx;
  justify-content: space-between;
  margin-right: 20rpx;
  margin-bottom: 10rpx;
  font-size: 28rpx;
}

.mouth {
  width: 84rpx;
  height: 46rpx;
  background-color: white;
  align-items: center;
  margin-left: 5rpx;
  justify-content: center;
  display: flex;
  border-radius: 24rpx;
}

.mouthnomal {
  width: 84rpx;
  height: 46rpx;
  align-items: center;
  margin-left: 5rpx;
  justify-content: center;
  display: flex;
}

.year {
  width: 84rpx;
  height: 46rpx;
  align-items: center;
  margin-left: 5rpx;
  justify-content: center;
  display: flex;
  border-radius: 24rpx;
  margin-right: 5rpx;
}

.yearative {
  width: 84rpx;
  height: 46rpx;
  background-color: white;
  align-items: center;
  margin-left: 5rpx;
  justify-content: center;
  display: flex;
  border-radius: 24rpx;
  margin-right: 5rpx;
}

/* 图表模块 */

/* 历史记录 */
.scbg {
  background-color: #f0f0f0;
  width: 100%;
  height: calc(100vh - 200rpx);
  left: 0rpx;
  right: 0rpx;
  top: 0rpx;
  padding-bottom: 30rpx;
}

/* 隐藏滚动条 */
::-webkit-scrollbar {
  width: 0;
  height: 0;
  color: transparent;
}

/* 历史数据 */
.history_data {
  margin-top: 40rpx;
  margin-bottom: 30rpx;
  margin-left: 30rpx;
  font-weight: bold;
  color: #444444;
}

/* 历史数据item */
.box {
  background-color: white;
  margin-top: 20rpx;
  border-radius: 20rpx;
  margin-left: 30rpx;
  margin-right: 30rpx;
}

.firstblock {
  height: 150rpx;
  display: flex;
  justify-content: space-between;
  align-items: center;
  border-radius: 20rpx;
  flex-direction: row;
  padding-right: 30rpx;
}

.showtime {
  font-size: 24rpx;
  color: #333333;
  font-family: PingFangSC-regular;
}

.showdataone {
  font-size: 32rpx;
  color: #000000;
  font-family: PingFangSC-regular;
  font-weight: bold;
  margin-right: 5rpx;
}

.showdatatwo {
  font-size: 32rpx;
  color: #000000;
  font-weight: bold;
  font-family: PingFangSC-regular;
}

.dataunit {
  font-size: 24rpx;
  color: #363636;
  margin-left: 10rpx;
  margin-right: 10rpx;
  font-family: PingFangSC-regular;
}

.showdata {
  width: 160rpx;
  font-size: 24rpx;
  color: #a7a7a7;
  margin-left: 30rpx;
}
/* 历史数据item */

/* 头部搜索 */
/* 搜索标题 */
.title_search{
  background: linear-gradient(to right, #0455a7, #62c8ec);
  height: 170rpx;
  width: 100%;
  display: flex;
  flex-direction: row;
  align-items: flex-end;
  justify-content: flex-start;
}
.seeck_md{
  display: flex;
  flex-direction: row;
  width: 100%;
  justify-content: flex-start;
  align-items: flex-end;
}

/* 消息 */
.msg{
  width: 180rpx;
  height: 90rpx;
  display: flex;
  flex-direction: column;
  justify-content: center;
  align-items: center;
  margin-right: 0rpx;
  margin-left: 30rpx;

}

.msg_title_center{
  width: 100%;
  display: flex;
  flex-direction: row;
  justify-content: center;
}
.msg_txt{
  font-size: 36rpx;
  height: 80rpx;
  width: 160rpx;
  margin-bottom: 20rpx;
  align-items: center;
  color: #fff;
  display: flex;
  justify-content: center;
}

/* 返回 */
.logout{
  width: 100rpx;
  height: 90rpx;
  display: flex;
  flex-direction: column;
  justify-content: center;
  align-items: center;
  margin-right: 20rpx;
  margin-left: 30rpx;
}
.logout_ic{
  height: 44rpx;
  width: 48rpx;
  margin-right: 2rpx;
}
.logout_txt{
  font-size: 24rpx;
  height: 40rpx;
  width: 60rpx;
  margin-bottom: 10rpx;
  align-items: flex-start;
  color: #fff;
  display: flex;
  justify-content: flex-start;
}
/* 搜索标题 */
/* 头部搜索  */
6.datacharts.ts,注意由于我是放在分包里面故在js文件中引入为import * as echarts from '../../../../ec-canvas/echarts';
如果放在主包引用则改为文章来源:https://www.toymoban.com/news/detail-437534.html
import * as echarts from '../../ec-canvas/echarts';文章来源地址https://www.toymoban.com/news/detail-437534.html
// 引入echarts.js
import * as echarts from '../../../../ec-canvas/echarts';

let chart = null;

Page({
  data: {
    ec: {
      onInit: initChart
    },
    titleDate: '',
    refreshData: '',
    diseaseList: [//月、季、年控件标记
      { diseaseCode: "0", diseaseName: "0", checked: true },
      { diseaseCode: "1", diseaseName: "1", checked: false },
      { diseaseCode: "2", diseaseName: "2", checked: false },
    ],
    pressList: [//气压、大气、OX、频率、重量控件标记
      { diseaseCode: "0", diseaseName: "0", checked: true },
      { diseaseCode: "1", diseaseName: "1", checked: false },
      { diseaseCode: "2", diseaseName: "2", checked: false },
      { diseaseCode: "3", diseaseName: "3", checked: false },
      { diseaseCode: "4", diseaseName: "4", checked: false },
    ],
    list: [{
      username: "2021-7-6",
      send_timestamp: "120",
      centent: "阅读,",
      total_likes: 2,
      unit: "mmhg"
    },
    ],
    HistoryDataList: [{
      data_times:'2022/12/01 10:11:02',
      values:'86/142',
      unit:'mmhg'
    },
    {
      data_times:'2022/11/30 08:01:52',
      values:'82/140',
      unit:'mmhg'
    }],//历史数据
    templeDataList: [{}],//临时接收历史数据
    patientId:""
  },

  // 页面加载
  onLoad(options) {
    var bloodTagss = options.bloodTag;

    this.data.patientId=""+ options.patientId;
    // console.log("======页面加载==获取病人id====" + this.data.patientId)

    //头部时间
    var timeStamp = new Date();
    var titledt = this.formatDate(timeStamp);
    this.setData({
      titleDate: titledt
    });

  },

  onShow() {

  },

  onReady: function () {

  },

  //气压历史数据
  bloodPresure: function () {

    var that = this;
    that.setData({
      HistoryDataList: []
    })

  },

  // OX历史数据
  bloodOxygen: function () {
    var that = this;
    that.setData({
      HistoryDataList: []
    });


  },

  //获取历史OX数据
  bloodSugerData: function () {
    var that = this;
    that.setData({
      HistoryDataList: []
    });


      that.getBloodSugarChart()


  },

  //心率历史数据
  getDataList: function () {

    var that = this;
    that.setData({
      HistoryDataList: []
    })

    this.getHeartRata()
  },

  //体重历史数据
  getWeightDataList: function () {
    var that = this;
    that.setData({
      HistoryDataList: []
    })
  },

  // 退出登录
  logout: function () {
    wx.navigateBack({})
  },

  // 气压
  booldPress: function () {

    // 状态切换
    let that = this;
    for (const key in that.data.pressList) {
      that.data.pressList[key].checked = false;
    }

    that.data.pressList[0].checked = true;
    this.setData({
      pressList: that.data.pressList
    })
    //数据处理
    that.bloodPressureCurve();
  },

  // 大气
  booldTa: function () {

    // 状态切换
    let that = this;
    for (const key in that.data.pressList) {
      that.data.pressList[key].checked = false;
    }

    that.data.pressList[1].checked = true;

    this.setData({
      pressList: that.data.pressList
    })
    //数据处理
    that.getBloodSugarChart()
  },

  // OX
  booldO: function () {
    // 状态切换
    let that = this;
    for (const key in that.data.pressList) {
      that.data.pressList[key].checked = false;
    }

    that.data.pressList[2].checked = true;
    this.setData({
      pressList: that.data.pressList
    })
    //数据处理
    that.getBloodOxygenChart()
  },

  //频率
  booldHaert: function () {
    // 状态切换
    let that = this;
    for (const key in that.data.pressList) {
      that.data.pressList[key].checked = false;
    }

    that.data.pressList[3].checked = true;
    this.setData({
      pressList: that.data.pressList
    })
    //数据处理
    that.getHeartRata();
  },

  // 重量
  booldWeight: function () {
    // 状态切换
    let that = this;
    for (const key in that.data.pressList) {
      that.data.pressList[key].checked = false;
    }

    that.data.pressList[4].checked = true;
    this.setData({
      pressList: that.data.pressList
    })
    //数据处理  weight


    that.weghtCurve();
  },

  // 周选择
  weekSelcet: function () {
    // 状态切换
    let that = this;
    for (const key in that.data.diseaseList) {
      that.data.diseaseList[key].checked = false;
    }

    that.data.diseaseList[0].checked = true;
    this.setData({
      diseaseList: that.data.diseaseList
    })

  },

  // 月度
  monthSelect: function () {
    // 状态切换
    let that = this;
    for (const key in that.data.diseaseList) {
      that.data.diseaseList[key].checked = false;
    }

    that.data.diseaseList[1].checked = true;
    this.setData({
      diseaseList: that.data.diseaseList
    })
    // 数据处理

  },

  //年切换
  yearselect: function () {
    // 状态切换
    let that = this;
    for (const key in that.data.diseaseList) {
      that.data.diseaseList[key].checked = false;
    }

    that.data.diseaseList[2].checked = true;
    this.setData({
      diseaseList: that.data.diseaseList
    })

  },

  //气压图表数据
  bloodPressureCurve: function () {

    let option = {
      title: {
        text: 'mmhg',
        y: '5%',
        x: '2%',
        textStyle: {
          fontSize: 12,
          fontWeight: 'normal',
        },
      },
      color: ["#05c8ac", '#60A0ff'],  //线的颜色
      legend: {
        data: ['m压', 'h压'],    //标识哪个颜色对应哪个数据
        padding: 1,   //   内边距
        x: '30%',
        y: '6%',
      },
      grid: {
        top: '24%',
        left: '3%',
        right: '4%',
        bottom: '11%',
        containLabel: true
      },
      xAxis: {//x轴
        type: 'category',
        data: [1,2,3,4,5,6]
      },
      yAxis: {//y轴
        type: 'value'
      },
      series: [
        {
          data: [110,102,103,99,98,140],
          name: "m压",
          type: 'line',
          smooth: false,
          label: {
            show: true
          }
        },
        {
          data: [70,65,85,81,76,78],
          name: "h压",
          type: 'line',
          smooth: false,
          label: {
            show: true
          }
        }
      ],
      dataZoom: [
        {
          type: 'inside',// 内置于坐标系中
          show: false,
          left: 33, //滚动条靠左侧的百分比
          start: 0,
          end: 80,
          xAxisIndex: [0]
        }, {
          type: 'inside',
          show: true,
          xAxisIndex: [0],
          start: 0,//滚动条的起始位置
          end: 0.25 //滚动条的截止位置(按比例分割你的柱状图x轴长度)
        }
      ]
    };

    chart.setOption(option);

  },

  //大气图表数据
  getBloodSugarChart: function () {

    let option = {
      title: {
        text: 'mg/dl',
        y: '3%',
        x: '2%',
        textStyle: {
          fontSize: 12,
          fontWeight: 'normal',
        },
      },
      color: ["#05c8ac"],  //线的颜色
      legend: {
        data: [''],    //标识哪个颜色对应哪个数据
        padding: 1,   //   内边距
        x: '30%',
        y: '5%',
      },
      grid: {
        top: '24%',
        left: '3%',
        right: '4%',
        bottom: '11%',
        containLabel: true
      },
      xAxis: {//x轴
        type: 'category',
        data: ['11/01','11/02','11/03','11/04']
      },
      yAxis: {//y轴
        type: 'value'
      },
      series: [
        {
          data: [20,30,34,29],
          name: "大气",
          type: 'line',
          smooth: false,
          label: {
            show: true
          }
        }, {
          data: [],
          name: "大气",
          type: 'line',
          smooth: false,
          label: {
            show: true
          }
        }
      ],
      dataZoom: [
        {
          type: 'inside',// 内置于坐标系中
          show: false,
          left: 33, //滚动条靠左侧的百分比
          start: 0,
          end: 80,
          xAxisIndex: [0]
        }, {
          type: 'inside',
          show: true,
          xAxisIndex: [0],
          start: 0,//滚动条的起始位置
          end: 80 //滚动条的截止位置(按比例分割你的柱状图x轴长度)
        }
      ]
    };
    wx.hideToast()
    chart.setOption(option);
  },

  //OX图表数据
  getBloodOxygenChart: function () {

    let option = {
      title: {
        text: '%',
        y: '3%',
        x: '2%',
        textStyle: {
          fontSize: 12,
          fontWeight: 'normal',
        },
      },
      color: ["#05c8ac"],  //线的颜色
      legend: {
        data: [''],    //标识哪个颜色对应哪个数据
        padding: 1,   //   内边距
        x: '30%',
        y: '5%',
      },
      grid: {
        top: '24%',
        left: '3%',
        right: '4%',
        bottom: '11%',
        containLabel: true
      },
      xAxis: {//x轴
        type: 'category',
        data: [1,2,3,4,5]
      },
      yAxis: {//y轴
        type: 'value'
      },
      series: [
        {
          data: [70,72,74,80,65],
          name: "OX",
          type: 'line',
          smooth: false,
          label: {
            show: true
          }
        }, {
          data: [],
          name: "",
          type: 'line',
          smooth: false,
          label: {
            show: true
          }
        }
      ],
      dataZoom: [
        {
          type: 'inside',// 内置于坐标系中
          show: false,
          left: 33, //滚动条靠左侧的百分比
          start: 0,
          end: 80,
          xAxisIndex: [0]
        }, {
          type: 'inside',
          show: false,
          xAxisIndex: [0],
          start: 0,//滚动条的起始位置
          end: 80, //滚动条的截止位置(按比例分割你的柱状图x轴长度)
        }
      ]
    };
    wx.hideToast()
    chart.setOption(option);
  },

  //心率图表数据处理
  getHeartRata: function () {

    let option = {
      title: {
        text: 'bmp',
        y: '5%',
        x: '2%',
        textStyle: {
          fontSize: 12,
          fontWeight: 'normal',
        },
      },
      color: ["#05c8ac"],  //线的颜色
      legend: {
        data: [''],    //标识哪个颜色对应哪个数据
        padding: 1,   //   内边距
        x: '30%',
        y: '6%',
      },
      grid: {
        top: '24%',
        left: '3%',
        right: '4%',
        bottom: '11%',
        containLabel: true
      },
      xAxis: {//x轴
        type: 'category',
        data: [1,2,3,4,5]
      },
      yAxis: {//y轴
        type: 'value'
      },
      series: [
        {
          data: [88,90,89,93,100],
          name: "收缩压",
          type: 'line',
          smooth: false,
          label: {
            show: true
          }
        },
        {
          data: [],
          name: "",
          type: 'line',
          smooth: false,
          label: {
            show: true
          }
        }
      ],
      dataZoom: [
        {
          type: 'inside',// 内置于坐标系中
          show: false,
          left: 33, //滚动条靠左侧的百分比
          start: 0,
          end: 80,
          xAxisIndex: [0]
        }, {
          type: 'inside',
          show: false,
          xAxisIndex: [0],
          start: 0,//滚动条的起始位置
          end: 80 //滚动条的截止位置(按比例分割你的柱状图x轴长度)
        }
      ]
    };

    chart.setOption(option);
  },

  //重量
  weghtCurve: function () {

    let option = {
      title: {
        text: 'kg',
        y: '5%',
        x: '2%',
        textStyle: {
          fontSize: 12,
          fontWeight: 'normal',
        },
      },
      color: ["#05c8ac"],  //线的颜色
      legend: {
        data: [''],    //标识哪个颜色对应哪个数据
        padding: 1,   //   内边距
        x: '30%',
        y: '6%',
      },
      grid: {
        top: '24%',
        left: '3%',
        right: '4%',
        bottom: '11%',
        containLabel: true
      },
      xAxis: {//x轴
        type: 'category',
        data: ['11/01','11/02','11/03','11/04','11/05']
      },
      yAxis: {//y轴
        type: 'value'
      },
      series: [
        {
          data: [66,65,59,68,70],
          name: "收缩压",
          type: 'line',
          smooth: false,
          label: {
            show: true
          }
        },
        {
          data: [],
          name: "",
          type: 'line',
          smooth: false,
          label: {
            show: true
          }
        }
      ],
      dataZoom: [
        {
          type: 'inside',// 内置于坐标系中
          show: false,
          left: 33, //滚动条靠左侧的百分比
          start: 0,
          end: 80,
          xAxisIndex: [0]
        }, {
          type: 'inside',
          show: true,
          xAxisIndex: [0],
          start: 0,//滚动条的起始位置
          end: 0.25 //滚动条的截止位置(按比例分割你的柱状图x轴长度)
        }
      ]
    };

    chart.setOption(option);
  },

  //转换为时间格式
  formatDate(time: Date) {
    let show_day = new Array('周日', '周一', '周二', '周三', '周四', '周五', '周六');
    var date = new Date(time);

    date.setDate(date.getDate());
    let weekDay = date.getDay();
    var weekDate = show_day[weekDay]

    var YY = date.getFullYear() + '-';
    var MM = (date.getMonth() + 1 < 10 ? '0' + (date.getMonth() + 1) : date.getMonth() + 1) + '月';
    var DD = (date.getDate() < 10 ? '0' + (date.getDate()) : date.getDate());
    var hh = (date.getHours() < 10 ? '0' + date.getHours() : date.getHours());
    var mm = ':' + (date.getMinutes() < 10 ? '0' + date.getMinutes() : date.getMinutes());
    var ss = ':' + (date.getSeconds() < 10 ? '0' + date.getSeconds() : date.getSeconds());
    return MM + DD + "日 " + weekDate + " " + hh + mm;
  },

  onPullDownRefresh() {
    //数据处理
    var timeStamp = new Date();
    var titledt = this.formatDate(timeStamp);
    this.setData({
      titleDate: titledt
    })
    console.log("============" + this.formatDate(timeStamp))
  },
})

// 初始化图表函数
function initChart(canvas: any, width: any, height: any, dpr: any) {
  chart = echarts.init(canvas, null, {
    width: width,
    height: height,
    devicePixelRatio: dpr
  })

  // canvas.setChart(chart)
  // 显示Echarts图表类型信息,可以去Echarts官网复制粘贴
  let option = {
    title: {
      text: 'mmhg',
      y: '5%',
      x: '2%',
      textStyle: {
        fontSize: 12,
        fontWeight: 'normal',
      },
    },
    color: ["#05c8ac", '#60A0ff'],  //线的颜色
    legend: {
      data: ['m压', 'h压'],     //标识哪个颜色对应哪个数据
      padding: 1,   //   内边距
      x: '30%',
      y: '6%',
    },
    grid: {
      top: '24%',
      left: '3%',
      right: '4%',
      bottom: '11%',
      containLabel: true
    },
    xAxis: {//x轴
      type: 'category',
      data: [1,2,3,4,5,6]
    },
    yAxis: {//y轴
      type: 'value'
    },
    series: [
      {
        data: [110,102,103,99,98,140],
        name: "m压",
        type: 'line',
        smooth: false,
        label: {
          show: true
        }
      },
      {
        data: [70,65,85,81,76,78],
        name: "h压",
        type: 'line',
        smooth: false,
        label: {
          show: true
        }
      }
    ],
    dataZoom: [
      {
        type: 'inside',// 内置于坐标系中
        show: false,
        left: 33, //滚动条靠左侧的百分比
        start: 0,
        end: 80,
        xAxisIndex: [0]
      }, {
        type: 'inside',
        show: true,
        xAxisIndex: [0],
        start: 0,//滚动条的起始位置
        end: 0.25 //滚动条的截止位置(按比例分割你的柱状图x轴长度)
      }
    ]
  };

  chart.setOption(option);
  return chart;
}
到了这里,关于微信小程序使用Echart实现折线图案例的文章就介绍完了。如果您还想了解更多内容,请在右上角搜索TOY模板网以前的文章或继续浏览下面的相关文章,希望大家以后多多支持TOY模板网!