简介
很多公司都在将自己的无线网络升级到802.11n,以实现更大的吞吐量、更广的覆盖范围和更高的可靠性,然而保证无线LAN(WLAN)的性能对于确保足够的网络容量和覆盖率尤为重要。下面,我们将探讨如何通过iPerf来测定网络性能,这是一个简单易用测量TCP/UDP的吞吐量、损耗和延迟的工具。
软件安装
# ubuntu系统
sudo apt install iperf
说明:不同的系统安装方式不同,这里只介绍ubuntu系统
使用介绍
案例一:工具检验测试
启动一个串口,输入指令
iperf -s
# 开启iperf服务端
效果如下:
启动另一个窗口,输入指令
iperf -c 127.0.0.1
# 作为客户端运行,测试10s回环通信数据
测试结果如下:

上面的例子只是简单测试了回环通信的吞吐量,如果显示正常,说明iperf安装和运行均正常。
案例二:TCP通信测试
先关闭上面的测试窗口,或结束上面的服务程序,我们这里还是以127.0.0.1作回环测试,时间应用场景中只需要把IP地址替换为对应服务端的IP地址即可
启动服务端,输入指令
iperf -s -b 7M -i 5
# 作为服务端运行,带宽7M,报告回显间隔时间5s
效果如下
打开新的terminal,启动客户端,输入指令
iperf -c 127.0.0.1 -b 7M -i 5 -t 30
#作为客户端,连接服务端ip地址127.0.0.1,带宽7M,与服务端保持一致,报告回显间隔5s,测试时间30s
测试效果如下:
我们这里测试吞吐量的结果为7.34M左右,是因为我们限制了测试数据的带宽就是7M,我们做的回环测试,实际回环的吞吐量应该是G为单位,测试过程中,如果发现测试的带宽与限制带宽接近,说明限制设置的太小了,需要适当调整-b参数,或者参考硬件厂家给的指标测试。
案例三:UDP测试
先关闭上面的测试窗口,或结束上面的服务程序,我们这里还是以127.0.0.1作回环测试,时间应用场景中只需要把IP地址替换为对应服务端的IP地址即可
启动服务端,输入指令
iperf -s -u -b 7M -i 5
# 作为UDP服务端启动iperf,限制带宽7M,报告回显时间间隔5s
效果如下:
启动客户端,输入指令
iperf -u -c 127.0.0.1 -b 7M -i 5 -t 30
测试效果如下:
我们这里测试吞吐量的结果为7.34M左右,是因为我们限制了测试数据的带宽就是7M,我们做的回环测试,实际回环的吞吐量应该是G为单位,测试过程中,如果发现测试的带宽与限制带宽接近,说明限制设置的太小了,需要适当调整-b参数,或者参考硬件厂家给的指标测试。
此时服务端显示内容如下:
我们可以看到服务端还可以显示通信延时Jitter(在连续传输中的平滑平均值差)和丢包率:Lost/Total Data
详细解读
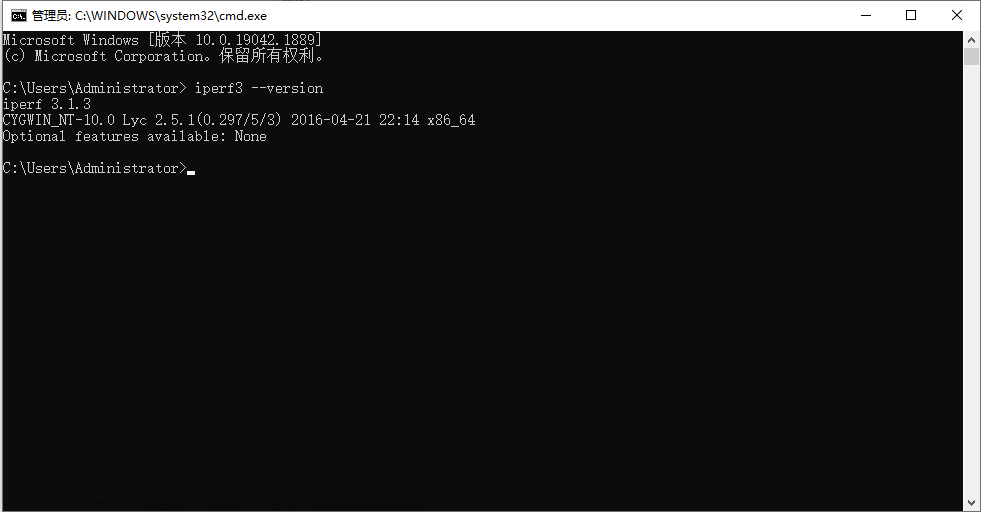
我们可以直接参考系统自带的帮助文档,如下:
iperf -h
Usage: iperf [-s|-c host] [options]
iperf [-h|--help] [-v|--version]
Client/Server:
    -b, --bandwidth #[kmgKMG | pps]  bandwidth to send at in bits/sec or packets per second
    -e, --enhancedreports    use enhanced reporting giving more tcp/udp and traffic information
    -f, --format    [kmgKMG]   format to report: Kbits, Mbits, KBytes, MBytes
    -i, --interval  #        seconds between periodic bandwidth reports
    -l, --len       #[kmKM]    length of buffer in bytes to read or write (Defaults: TCP=128K, v4 UDP=1470, v6 UDP=1450)
    -m, --print_mss          print TCP maximum segment size (MTU - TCP/IP header)
    -o, --output    <filename> output the report or error message to this specified file
    -p, --port      #        server port to listen on/connect to
    -u, --udp                use UDP rather than TCP
    --udp-counters-64bit use 64 bit sequence numbers with UDP
    -w, --window    #[KM]    TCP window size (socket buffer size)
    -z, --realtime           request realtime scheduler
    -B, --bind <host>[:<port>][%<dev>] bind to <host>, ip addr (including multicast address) and optional port and device
    -C, --compatibility      for use with older versions does not sent extra msgs
    -M, --mss       #        set TCP maximum segment size (MTU - 40 bytes)
    -N, --nodelay            set TCP no delay, disabling Nagle's Algorithm
    -S, --tos       #        set the socket's IP_TOS (byte) field
Server specific:
    -s, --server             run in server mode
    -t, --time      #        time in seconds to listen for new connections as well as to receive traffic (default not set)
    --udp-histogram #,#  enable UDP latency histogram(s) with bin width and count, e.g. 1,1000=1(ms),1000(bins)
    -B, --bind <ip>[%<dev>]  bind to multicast address and optional device
    -H, --ssm-host <ip>      set the SSM source, use with -B for (S,G)
    -U, --single_udp         run in single threaded UDP mode
    -D, --daemon             run the server as a daemon
    -V, --ipv6_domain        Enable IPv6 reception by setting the domain and socket to AF_INET6 (Can receive on both IPv4 and IPv6)
Client specific:
    -c, --client    <host>   run in client mode, connecting to <host>
    -d, --dualtest           Do a bidirectional test simultaneously
    --ipg                set the the interpacket gap (milliseconds) for packets within an isochronous frame
    --isochronous <frames-per-second>:<mean>,<stddev> send traffic in bursts (frames - emulate video traffic)
    -n, --num       #[kmgKMG]    number of bytes to transmit (instead of -t)
    -r, --tradeoff           Do a bidirectional test individually
    -t, --time      #        time in seconds to transmit for (default 10 secs)
    -B, --bind [<ip> | <ip:port>] bind ip (and optional port) from which to source traffic
    -F, --fileinput <name>   input the data to be transmitted from a file
    -I, --stdin              input the data to be transmitted from stdin
    -L, --listenport #       port to receive bidirectional tests back on
    -P, --parallel  #        number of parallel client threads to run
    -R, --reverse            reverse the test (client receives, server sends)
    -T, --ttl       #        time-to-live, for multicast (default 1)
    -V, --ipv6_domain        Set the domain to IPv6 (send packets over IPv6)
    -X, --peer-detect        perform server version detection and version exchange
    -Z, --linux-congestion <algo>  set TCP congestion control algorithm (Linux only)
Miscellaneous:
    -x, --reportexclude [CDMSV]   exclude C(connection) D(data) M(multicast) S(settings) V(server) reports
    -y, --reportstyle C      report as a Comma-Separated Values
    -h, --help               print this message and quit
    -v, --version            print version information and quit

[kmgKMG] Indicates options that support a k,m,g,K,M or G suffix
Lowercase format characters are 10^3 based and uppercase are 2^n based
(e.g. 1k = 1000, 1K = 1024, 1m = 1,000,000 and 1M = 1,048,576)

The TCP window size option can be set by the environment variable
TCP_WINDOW_SIZE. Most other options can be set by an environment variable
IPERF_<long option name>, such as IPERF_BANDWIDTH.

Source at <http://sourceforge.net/projects/iperf2/>
Report bugs to <iperf-users@lists.sourceforge.net>
我们抽取我在测试过程中用到的一些参数做一些翻译和解读
Client/Server: # 客户端和服务端公有的参数
带宽参数,单位:字节每秒:kmg或者KMG,小写为10的3次方,大写为2的n次方,比如1k=1000,1K=1024,;单位包数量每秒:pps(packets per second)
    -b, --bandwidth #[kmgKMG | pps]  bandwidth to send at in bits/sec or packets per second
回显报告的间隔时间
    -i, --interval  #        seconds between periodic bandwidth reports
指定端口号,默认为5001
    -p, --port      #        server port to listen on/connect to
udp模式,不带-u默认为tcp模式
    -u, --udp                use UDP rather than TCP
tcp窗口大小,默认无上限,可以不设此参数,作为udp模式测试时也不需要此参数 ,单位:KM,1K=1024
    -w, --window    #[KM]    TCP window size (socket buffer size)

Server specific:  #服务端私有参数
指定以服务端运行
    -s, --server             run in server mode
指定测试时间,服务端一般一直开着,不设此参数
    -t, --time      #        time in seconds to listen for new connections as well as to receive traffic (default not set)

Client specific:  #客户端私有参数
指定以客户端运行,后面要带服务端的IP地址
    -c, --client    <host>   run in client mode, connecting to <host>
指定测试时间,不带参数默认测试10s
    -t, --time      #        time in seconds to transmit for (default 10 secs)
翻转测试,iperf2并不支持此功能,无法使用,可以推荐使用iperf3
    -R, --reverse            reverse the test (client receives, server sends)

Miscellaneous:   #混合参数,指既不是服务端也不是客户端的时候使用
显示帮助菜单
    -h, --help               print this message and quit
显示版本
    -v, --version            print version information and quit
·
·
·
欢迎各位老铁一键三连,本号后续会不断更新树莓派、人工智能、STM32、ROS小车相关文章和知识。
大家对感兴趣的知识点可以在文章下面留言,我可以优先帮大家讲解哦
欢迎大家光临我的淘宝小店【玩转智能机器人】,会定期推出教程中使用的物美价优的硬件,你的光临就是对我的支持文章来源:https://www.toymoban.com/news/detail-460148.html
原创不易,转载请说明出处。文章来源地址https://www.toymoban.com/news/detail-460148.html
到了这里,关于网络测试工具—— iperf2详细使用方法的文章就介绍完了。如果您还想了解更多内容,请在右上角搜索TOY模板网以前的文章或继续浏览下面的相关文章,希望大家以后多多支持TOY模板网!