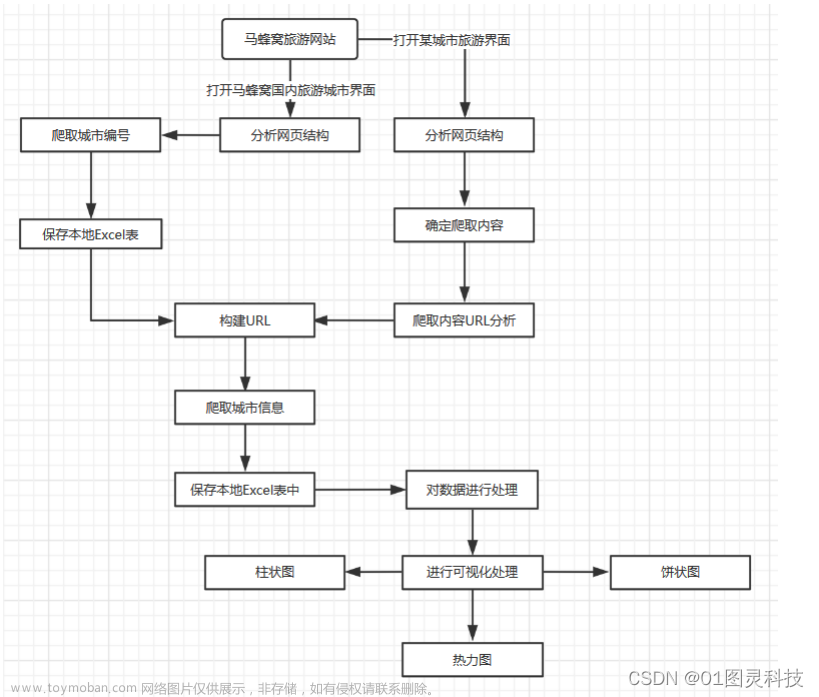
前言
这篇文章记录以下两点:
1.获取天气信息的方法和步骤以及遇到的问题和改进方法
2.获取到天气信息后进行数据清洗和可视化展示
总的来说,就是将网站中的天气信息通过爬虫技术保存在文件中,再通过对文件中的文本数据进行处理后用图表方式展现出来。
一、爬虫部分
1.选定网址
(1)网址选择
- 因为要对网站内的数据进行获取,第一步就是要找到存在对应信息的网址,这里选择一个天气网站

- 通过robots协议可知,该网站可以进行爬虫爬取

(2)分析
- 主页网站并没有需要的大量天气信息;
- 思考:我们想要获取天气信息应该是针对某一城市的某些天;
- 在主页中找到该网址(这里以成都的天气为例):xxx/weather40d/101270101.shtml

- 通过该网站发现,当点击40天的天气信息时,网址URL的第一个路径为weather40d;
- 点击其他选项卡,不难发现,依次为:今天(1d),7天(无,这里需要避坑),8-15天(15d);

- 除此之外,尾部路径的数字101270101代表的是成都市;101110101代表西安市;
2.获取成都7天的天气信息
(1)请求成都最近7天天气信息的网站
- 首先请求,看是否正常
# coding:utf-8
import requests


def get_data(url):
    headers = {
        "User-Agent": "Mozilla/5.0 (Windows NT 10.0; WOW64) AppleWebKit/537.36 (KHTML, like Gecko) Chrome/94.0.4606.81 Safari/537.36"
    }

    r = requests.get(url=url,headers=headers)
    if r.status_code == 200:

        print('请求成功')
    else:
        print('请求失败')


URL = 'http://www.weather.com.cn/weather7d/101270101.shtml'

get_data(URL)
- 下面图片为输出结果,说明该网站可以正常请求访问

- 目前看来没有问题,开始准备获取成都最近7天的天气信息
(2)获取成都7天的天气信息
我们发现天气信息是保存在网页源代码里,只需要获取网页源代码后进行解析即可获取到数据
a.通过text方法获取网页源代码
# coding:utf-8
import requests


def get_data(url):
    headers = {
        "User-Agent": "Mozilla/5.0 (Windows NT 10.0; WOW64) AppleWebKit/537.36 (KHTML, like Gecko) Chrome/94.0.4606.81 Safari/537.36"
    }

    r = requests.get(url=url, headers=headers)
    if r.status_code == 200:
        # 设置编码格式
        r.encoding = 'UTF-8'
        # 通过text方法返回网页源码
        return r.text
    else:
        return '请求失败'


URL = 'http://www.weather.com.cn/weather7d/101270101.shtml'

print(get_data(URL))
b.解析网页源码

- 显然,需要的信息在类名为c7d、id名为7d的div标签下,它里面只有一个ul标签(该标签为列表标签),ul标签里有需要的7天的天气信息,为7个li标签;
- 总的来说,只需要找到id名为7d的div标签,便可找到天气信息,紧接着找到ul标签,遍历其中的li标签,提取信息即可。
c.获取数据
URL = 'http://www.weather.com.cn/weather/101270101.shtml'
# 调用函数获取网页源代码
html_code = get_data(URL)
soup = BeautifulSoup(html_code, "html.parser")

div = soup.find("div", id="7d")
# 获取div标签,下面这种方式也可以
# div = soup.find('div', attrs={'id': '7d', 'class': 'c7d'})  # div
ul = div.find("ul")  # ul
lis = ul.find_all("li")  # li

# 此行为该网站更新信息时间
# print(soup.find("div", id='around').find("h1").find("i").text)
li_today = lis[0]
# 发现在晚上访问该网站,今日的天气是没有最高气温,需要手动添加,无法遍历添加
weather_list = []
weather = []
# 添加今天的数据
date_today = li_today.find('h1').text  # 日期
wea_today = li_today.find('p', class_="wea").text  # 天气
tem_h_today = 'NONE'
tem_l_today = li_today.find('p', class_="tem").find("i").text  # 温度最低
spans_today = li_today.find('p', attrs={"class": "win"}).find_all("span")
win1_today = ''  # 风向
for s in spans_today:
    win1_today += s.get('title') + '且'
win2_today = li_today.find('p', attrs={"class": "win"}).find("i").text  # 风力

weather_today = [date_today, wea_today, tem_h_today, tem_l_today, win1_today + win2_today]

weather_all = []
# 添加剩下6天的数据
for li in lis[1:]:
    date = li.find('h1').text  # 日期
    wea = li.find('p', class_="wea").text  # 天气
    tem_h = li.find('p', class_="tem").find("span").text  # 温度最高
    tem_l = li.find('p', class_="tem").find("i").text  # 温度最低
    spans = li.find('p', attrs={"class": "win"}).find("span")  # 此处不需要find_all
    win1 = spans.get('title') + '且'  # 风向
    win2 = li.find('p', attrs={"class": "win"}).find("i").text  # 风力
    weather = [date, wea, tem_h, tem_l, win1 + win2]

    weather_all.append(weather)

# 插入首天数据
weather_all.insert(0, weather_today)
print(weather_all)
- 通过以上方式,便可得到7天的数据。
3.获取成都40天的天气信息
(1)分析网站
- 7天的天气信息过少,需要获取更多数据;
- 此刻,以获取7天天气信息的方式去获取40天天气信息时,发现,并没有需要的天气信息;
- 经过对比,在网页的检查功能中,可以找到天气信息,但是在网页源代码中并没有该数据;
- 下图为检查功能中的天气信息:

- 下图为网页源代码中的天气:

- 对比发现,所需的天气信息,在网页源代码中是空白,我们便知此处是由动态网页生成,那就需要找到动态网页中保存数据的文件。
(2)动态网页的数据
- 一般来说,动态网页的数据保存在网页文件夹里的JSON文件中,只需要找到该文件即可;
- 依旧在审查元素(右键检查)里,找到Network;

- 刚点进去是一片空白,因为该网页已经渲染完毕,只需要刷新即可重新渲染

- 继续通过XHR过滤器寻找JSON文件,是一片空白

- 继续通过JS过滤器寻找,发现了所需的文件

(3)尝试获取动态网页数据
- 需要在headers找到重新请求的网站;

# coding:utf-8
import requests

def get_data(web_url):
    headers = {
        "User-Agent": "Mozilla/5.0 (Windows NT 10.0; WOW64) AppleWebKit/537.36 (KHTML, like Gecko) Chrome/94.0.4606.81 Safari/537.36"
    }
    r = requests.get(url=web_url, headers=headers)
    if r.status_code == 200:
        # 返回响应对象中JSON解码的数据内容
        weather_data = r.json()
        return weather_data
    else:
        return '请求失败!'


url = 'http://d1.weather.com.cn/calendar_new/2022/101270101_202207.html'
data = get_data(url)
print(data)
- 通过上述方法,并不能请求成功,发现错误代码403
a.测试1:使用随机用户代理(此方法失败)
# coding:utf-8
import requests
import random


def get_data(web_url):
    my_headers = [
        "Mozilla/5.0 (Windows NT 6.3; WOW64) AppleWebKit/537.36 (KHTML, like Gecko) Chrome/39.0.2171.95 Safari/537.36",
        "Mozilla/5.0 (Macintosh; Intel Mac OS X 10_9_2) AppleWebKit/537.36 (KHTML, like Gecko) Chrome/35.0.1916.153 Safari/537.36",
        "Mozilla/5.0 (Windows NT 6.1; WOW64; rv:30.0) Gecko/20100101 Firefox/30.0",
        "Mozilla/5.0 (Macintosh; Intel Mac OS X 10_9_2) AppleWebKit/537.75.14 (KHTML, like Gecko) Version/7.0.3 Safari/537.75.14",
        "Mozilla/5.0 (compatible; MSIE 10.0; Windows NT 6.2; Win64; x64; Trident/6.0)",
        'Mozilla/5.0 (Windows; U; Windows NT 5.1; it; rv:1.8.1.11) Gecko/20071127 Firefox/2.0.0.11',
        'Opera/9.25 (Windows NT 5.1; U; en)',
        'Mozilla/4.0 (compatible; MSIE 6.0; Windows NT 5.1; SV1; .NET CLR 1.1.4322; .NET CLR 2.0.50727)',
        'Mozilla/5.0 (compatible; Konqueror/3.5; Linux) KHTML/3.5.5 (like Gecko) (Kubuntu)',
        'Mozilla/5.0 (X11; U; Linux i686; en-US; rv:1.8.0.12) Gecko/20070731 Ubuntu/dapper-security Firefox/1.5.0.12',
        'Lynx/2.8.5rel.1 libwww-FM/2.14 SSL-MM/1.4.1 GNUTLS/1.2.9',
        "Mozilla/5.0 (X11; Linux i686) AppleWebKit/535.7 (KHTML, like Gecko) Ubuntu/11.04 Chromium/16.0.912.77 Chrome/16.0.912.77 Safari/535.7",
        "Mozilla/5.0 (X11; Ubuntu; Linux i686; rv:10.0) Gecko/20100101 Firefox/10.0 "
    ]
    random_header = random.choice(my_headers)

    headers = {
        'User-Agent': random_header
    }

    r = requests.get(url=web_url, headers=headers)
    if r.status_code == 200:
        # 返回响应对象中JSON解码的数据内容
        html_data = r.json()
        return html_data
    else:
        return '爬取失败!'


url = 'http://d1.weather.com.cn/calendar_new/2022/101270101_202207.html'
data = get_data(url)
print(data)
- 依旧失败
b.测试2:设置headers参数(此方法成功)
- 不难发现,headers中有个Referer参数,该参数说明:当前网址是由此参数对应值所包含的网站跳转过来,为了防止恶意请求,添加上该参数,便可正常请求了

# coding:utf-8
import requests
import random
import json

def get_data(web_url):
    my_headers = [
        "Mozilla/5.0 (Windows NT 6.3; WOW64) AppleWebKit/537.36 (KHTML, like Gecko) Chrome/39.0.2171.95 Safari/537.36",
        "Mozilla/5.0 (Macintosh; Intel Mac OS X 10_9_2) AppleWebKit/537.36 (KHTML, like Gecko) Chrome/35.0.1916.153 Safari/537.36",
        "Mozilla/5.0 (Windows NT 6.1; WOW64; rv:30.0) Gecko/20100101 Firefox/30.0",
        "Mozilla/5.0 (Macintosh; Intel Mac OS X 10_9_2) AppleWebKit/537.75.14 (KHTML, like Gecko) Version/7.0.3 Safari/537.75.14",
        "Mozilla/5.0 (compatible; MSIE 10.0; Windows NT 6.2; Win64; x64; Trident/6.0)",
        'Mozilla/5.0 (Windows; U; Windows NT 5.1; it; rv:1.8.1.11) Gecko/20071127 Firefox/2.0.0.11',
        'Opera/9.25 (Windows NT 5.1; U; en)',
        'Mozilla/4.0 (compatible; MSIE 6.0; Windows NT 5.1; SV1; .NET CLR 1.1.4322; .NET CLR 2.0.50727)',
        'Mozilla/5.0 (compatible; Konqueror/3.5; Linux) KHTML/3.5.5 (like Gecko) (Kubuntu)',
        'Mozilla/5.0 (X11; U; Linux i686; en-US; rv:1.8.0.12) Gecko/20070731 Ubuntu/dapper-security Firefox/1.5.0.12',
        'Lynx/2.8.5rel.1 libwww-FM/2.14 SSL-MM/1.4.1 GNUTLS/1.2.9',
        "Mozilla/5.0 (X11; Linux i686) AppleWebKit/535.7 (KHTML, like Gecko) Ubuntu/11.04 Chromium/16.0.912.77 Chrome/16.0.912.77 Safari/535.7",
        "Mozilla/5.0 (X11; Ubuntu; Linux i686; rv:10.0) Gecko/20100101 Firefox/10.0 "
    ]
    random_header = random.choice(my_headers)
	# 获取随机headers
    headers = {
        "Referer": "http://www.weather.com.cn/",
        'User-Agent': random_header
    }

    r = requests.get(url=web_url, headers=headers)
    if r.status_code == 200:
        content = r.content.decode(encoding='utf-8')
        # 此json文件中前面有变量名,剔除变量名,只要后面的数组数据
        weathers = json.loads(content[11:])
        return weathers
    else:
        return '爬取失败!'


url = 'http://d1.weather.com.cn/calendar_new/2022/101270101_202207.html'
data = get_data(url)
print(data)
- 仔细观察,此URL末尾便是对应年月,于是只需要修改末尾的年月数据,便可获取大量天气信息;
4.获取成都180天的天气数据
def get_y_m_url():
    # 定义列表url_list
    url_list = []
    # 使用format功能构造每月数据的url
    for month_2022 in range(1, 7):
        url_2022 = 'http://d1.weather.com.cn/calendar_new/2022/101270101_20220{}.html'.format(month_2022)
        # 保存多月数据的url到列表url_list中
        url_list.append(url_2022)
    return url_list


url_list_all = get_y_m_url()
# for循环遍历列表url_list
for url in url_list_all:
    # 调用函数get_data获取每月数据
    weather_data = get_data(url)
    # 打印输出每月数据
    print(weather_data)
二、数据处理及可视化展示
1.分析数据
- 首先分析第一个月的数据,其实只需要的是日期、降雨概率、最高温度、最低温度;

2.获取数据
(1)获取一个月数据并处理
- 获取一个月的数据进行整理
# 创建空列表保存天气数据列表
weather_info = []
url = 'http://d1.weather.com.cn/calendar_new/2022/101110801_202206.html'
# 调用函数进行数据获取
weather_data = get_data(url)
for every_day_weather in weather_data:
    # 日期
    date = every_day_weather['date']
    # 降雨概率
    rainfall_probability = every_day_weather['hgl']
    # 最高温
    tem_max = every_day_weather['hmax']
    # 最低温
    tem_min = every_day_weather['hmin']
    # 将以上四个数据保存在字典里,为一天的数据
    one_day_weahther = {'date': date, 'rainfall_probability': rainfall_probability, 'tem_max': tem_max,'tem_min': tem_min}
    # 将每天的数据保存在列表里
    weather_info.append(one_day_weahther)
print(weather_info)
- 下图为获取到的1个月的天气信息

(2)处理180天数据
# 创建空列表保存天气数据列表
weather_info = []
# for循环遍历列表url_list
for url in url_list_all:
    # 调用函数get_data获取每月数据
    weather_data = get_data(url)
    for every_day_weather in weather_data:
        # 日期
        date = every_day_weather['date']
        # 降雨概率
        rainfall_probability = every_day_weather['hgl']
        # 最高温
        tem_max = every_day_weather['hmax']
        # 最低温
        tem_min = every_day_weather['hmin']
        # 将以上四个数据保存在字典里,为一天的数据
        one_day_weahther = {'date': date, 'rainfall_probability': rainfall_probability, 'tem_max': tem_max,'tem_min': tem_min}
        # 将每天的数据保存在列表里,同时去重
        if one_day_weahther not in weather_info:
            weather_info.append(one_day_weahther)
3.保存数据
- 将180天的数据信息以CSV格式保存下来
# 保存天气数据到CSV文件
def save_csv(weather_data):
    # 打开文件
    csv_file = open('weather_info.csv', 'w', encoding='UTF-8-SIG', newline='\n')
    # 设置表头信息fieldnames=['date', 'rainfall_probability', 'tem_max', 'tem_min']
    fieldnames = ['date', 'rainfall_probability', 'tem_max', 'tem_min']
    # 创建DictWriter对象,并返回给变量dict_writer
    dict_writer = csv.DictWriter(csv_file, fieldnames=fieldnames)
    # 使用writeheader功能写入表头信息
    dict_writer.writeheader()
    # 使用writerows功能写入多行数据
    dict_writer.writerows(weather_data)
    # 关闭文件
    csv_file.close()

save_csv(weather_info_final)
4.天气信息可视化展示
(1)成都——深圳平均温度对比图

line = (
    Line(
        init_opts=opts.InitOpts(animation_opts=opts.AnimationOpts(animation_duration=5000),
                                bg_color='rgba(255,250,205,0.2)',
                                width='1000px',
                                height='600px',
                                page_title='成都——深圳平均天气对比图',
                                # 设置主题
                                theme=ThemeType.MACARONS
                                )
    )
        .add_xaxis(xaxis_data=x)
        .add_yaxis(series_name="成都", y_axis=y_cd, is_smooth=True)
        .add_yaxis(series_name="深圳", y_axis=y_sz, is_smooth=True)
        .set_global_opts(title_opts=opts.TitleOpts(title="成都——深圳平均温度对比图"),
                         xaxis_opts=opts.AxisOpts(name='年月'),
                         yaxis_opts=opts.AxisOpts(name='温度  单位:℃'), )
        .render('compare_average_tem.html')
)
(2)成都——深圳最高温度对比图

import csv
import pyecharts.options as opts
from pyecharts.charts import Line
import numpy

line = (
    Line(
        init_opts=opts.InitOpts(animation_opts=opts.AnimationOpts(animation_duration=5000),
                                bg_color='rgba(255,250,205,0.2)',
                                width='1000px',
                                height='600px',
                                page_title='成都——深圳最高温度对比图',
                                theme=ThemeType.ROMANTIC
                                )
    )
        .add_xaxis(xaxis_data=x)
        .add_yaxis(series_name="成都", y_axis=y_cd, is_smooth=True)
        .add_yaxis(series_name="深圳", y_axis=y_sz, is_smooth=True)
        .set_global_opts(title_opts=opts.TitleOpts(title="成都——深圳最高温度对比图"),
                         xaxis_opts=opts.AxisOpts(name='年月'),
                         yaxis_opts=opts.AxisOpts(name='温度  单位:℃'), )
        .render('compare_max_tem.html')
)
(3)成都——深圳最低温度对比图

import csv
import pyecharts.options as opts
from pyecharts.charts import Line
import numpy
line = (
    Line(
        init_opts=opts.InitOpts(animation_opts=opts.AnimationOpts(animation_duration=5000),
                                bg_color='rgba(255,250,205,0.2)',
                                width='1000px',
                                height='600px',
                                page_title='成都——深圳最低温度对比图',
                                theme=ThemeType.WESTEROS

                                )
    )
        .add_xaxis(xaxis_data=x)
        .add_yaxis(series_name="成都", y_axis=y_cd, is_smooth=True)
        .add_yaxis(series_name="深圳", y_axis=y_sz, is_smooth=True)
        .set_global_opts(title_opts=opts.TitleOpts(title="成都——深圳最低温度对比图"),
                         xaxis_opts=opts.AxisOpts(name='年月'),
                         yaxis_opts=opts.AxisOpts(name='温度  单位:℃'), )

        .render('compare_min_tem.html')

)
(4)成都——深圳温度区间天数图

import csv
from pyecharts.globals import ThemeType
import pyecharts.options as opts
from pyecharts.charts import Bar
import pandas as pd
bar = (
    Bar(
        # 设置果冻特效动画
        init_opts=opts.InitOpts(animation_opts=opts.AnimationOpts(animation_delay=500, animation_easing="elasticOut"),
                                bg_color='rgba(255,250,205,0.2)',
                                width='1000px',
                                height='600px',
                                page_title='成都——深圳温度区间天数图',
                                theme=ThemeType.INFOGRAPHIC
                                )
    )
        .add_xaxis(xaxis_data=x)
        .add_yaxis(series_name="成都", y_axis=cd_max_count)
        .add_yaxis(series_name="深圳", y_axis=sz_max_count)
        .set_global_opts(title_opts=opts.TitleOpts(title="成都——深圳温度区间天数图"),
                         xaxis_opts=opts.AxisOpts(name='温度区间'),
                         yaxis_opts=opts.AxisOpts(name='天数  单位:天'), )

        .render('compare_tem_count.html')

)
(5)成都半年每日最高温度占比

pie = (
    Pie(
        # 设置果冻特效动画
        init_opts=opts.InitOpts(animation_opts=opts.AnimationOpts(animation_delay=500, animation_easing="elasticOut"),
                                bg_color='rgba(255,250,205,0.2)',
                                width='1000px',
                                height='600px',
                                page_title='成都半年每日最高温度占比',
                                # theme=ThemeType.INFOGRAPHIC
                                )
    )
        .add('成都180天高温温度占比',
             list(zip(attr_tem_interval, cd_max_count)),
             )

        .set_global_opts(title_opts=opts.TitleOpts(title="成都半年每日最高温度占比"),
                         legend_opts=opts.LegendOpts(pos_left='center'
                                                     , pos_bottom='bottom'
                                                     , orient="horizontal"

                                                     )
                         )
        # a:系列名称(标题),b:数据项名称,c:数值,d:百分比
        .set_series_opts(label_opts=opts.LabelOpts(formatter='{b}:{c}天({d}%)'))
        # 设置每块区域的颜色
        .set_colors(['#00FFFF', '#00BFFF', '#FFD700', '#FFA500', '#FF0000'])
        .render('cd_tem_pie.html')

)
(6)成都半年每日最高温度占比——南丁格尔图

pie = (
    Pie(
        # 设置果冻特效动画
        init_opts=opts.InitOpts(animation_opts=opts.AnimationOpts(animation_delay=500, animation_easing="elasticOut"),
                                bg_color='rgba(255,250,205,0.2)',
                                width='1000px',
                                height='600px',
                                page_title='成都半年每日最高温度占比——南丁格尔图',
                                # theme=ThemeType.INFOGRAPHIC
                                )
    )
        .add('成都180天高温温度占比',
             list(zip(attr_tem_interval, cd_max_count)),
             # 是否展示成南丁格尔图,通过半径区分数据大小。可选择两种模式:
             # 'radius' 扇区圆心角展现数据的百分比,半径展现数据的大小。
             # 'area' 所有扇区圆心角相同,仅通过半径展现数据大小。
             rosetype="radius",
             # 饼图的半径,数组的第一项是内半径,第二项是外半径(如果两项均设置则为环状图)
             # 默认设置成百分比,相对于容器高宽中较小的一项的一半
             radius="55%",
             # 饼图的中心(圆心)坐标,数组的第一项是横坐标,第二项是纵坐标
             # 默认设置成百分比,设置成百分比时第一项是相对于容器宽度,第二项是相对于容器高度
             center=["50%", "50%"],
             )

        .set_global_opts(title_opts=opts.TitleOpts(title="成都半年每日最高温度占比——南丁格尔图"),
                         legend_opts=opts.LegendOpts(pos_left='center'
                                                     , pos_bottom='bottom'
                                                     , orient="horizontal"

                                                     )
                         )
        # a:系列名称(标题),b:数据项名称,c:数值,d:百分比
        .set_series_opts(label_opts=opts.LabelOpts(formatter='{b}:{c}天({d}%)'))
        # 设置每块区域的颜色
        .set_colors(['#00FFFF', '#00BFFF', '#FFD700', '#FFA500', '#FF0000'])
        .render('cd_tem_pie_coxcomb.html')

)
若本篇内容对您有所帮助,请三连点赞,关注,收藏支持下。
创作不易,白嫖不好,各位的支持和认可,就是我创作的最大动力,我们下篇文章见!
圈圈仔OvO | 文文章来源:https://www.toymoban.com/news/detail-474094.html
如果本篇博客有任何错误,请批评指教,不胜感激 !文章来源地址https://www.toymoban.com/news/detail-474094.html
到了这里,关于Python爬取180天的天气信息及数据分析的文章就介绍完了。如果您还想了解更多内容,请在右上角搜索TOY模板网以前的文章或继续浏览下面的相关文章,希望大家以后多多支持TOY模板网!