0 了解数据
来源: UCI Machine Learning Repository (UCI Machine Learning Repository)
数据集信息:
这份数据与葡萄牙银行机构的直接营销活动有关。这些营销活动基于电话呼叫。通常需要多次联系同一客户,以确定是否会订阅产品(银行定期存款)。
属性信息:
输入变量:
1-age:年龄(数值型)
2-job:职业类型(分类型)
'admin.':行政人员
'blue-collar':蓝领工人
'entrepreneur':企业家
'housemaid':家庭主妇
'management':管理人员
'retired':退休人员
'self-employed':自雇人士
'services':服务行业人员
'student':学生
'technician':技术人员
'unemployed':失业人员
'unknown':未知职业
3-marital:婚姻状况(分类型)
'divorced':离异或丧偶
'married':已婚
'single':单身
'unknown':未知婚姻状态
4-education:教育程度(分类型)
'basic.4y':4年制基础教育
'basic.6y':6年制基础教育
'basic.9y':9年制基础教育
'high.school':高中教育
'illiterate':文盲
'professional.course':职业课程教育
'university.degree':大学本科以上教育
'unknown':未知教育程度
5-default:默认信用:是否有信用违约?(分类型:'no'否,'yes'是,'unknown'未知)
6-housing:住房贷款:是否有住房贷款?(分类型:'no'否,'yes'是,'unknown'未知)
7-loan:个人贷款:是否有个人贷款?(分类型:'no'否,'yes'是,'unknown'未知)
8-contact:联系方式:联系沟通类型(分类型:'cellular':手机,'telephone':电话)
9- month:月份:年度最后一次联系月份(分类型)
10- day_of_week:星期几:最后一次联系星期几(分类型)
11-duration:持续时间:最后一次联系持续时间,以秒为单位(数值型)。重要说明:此属性对输出目标影响很大(例如,如果持续时间为0,则y='no')。然而,在进行通话之前并不知道持续时间。而且,在通话结束后,y显然是已知的。因此,此输入仅应包括在基准目的中,并且如果意图是拥有真实的预测模型,则应将其丢弃。
12-campaign:营销活动:在此次营销活动和针对此客户期间执行的联系次数(数值型,包括最后一次联系)
13-pdays:客户上次从以前的营销活动中联系后经过的天数(数值型;999表示先前没有联系过客户)
14-previous:以前的联系:在此次营销活动和针对此客户之前执行的联系次数(数值型)
15-poutcome:以前营销活动的结果(分类型)
'failure':营销活动失败
'nonexistent':之前未进行过营销活动
'success':营销活动成功
16-emp.var.rate:就业变化率 - 季度指标(数值型)
17-cons.price.idx:消费者物价指数 - 月度指标(数值型)
18-cons.conf.idx:消费者信心指数 - 月度指标(数值型)
19-euribor3m:欧元区3个月间隔利率 - 日度指标(数值型)
20-nr.employed:雇员数量- 季度指标(数值型)
输出变量:
y:客户是否已经订阅了定期存款?(二元:'yes'是,'no否')
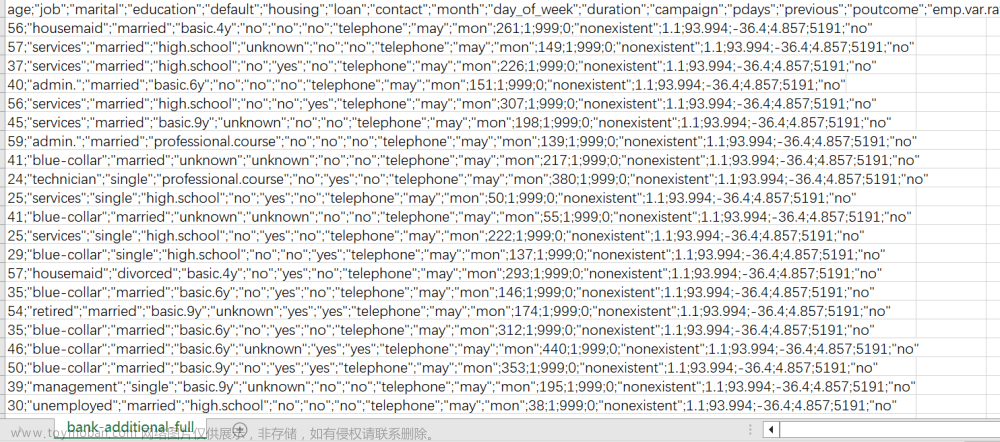
1 导入数据
使用pandas库中的read_csv()方法读取名为'bank.csv'的数据文件,并将其保存在名为'df'的DataFrame对象中。参数'encoding'指定了数据文件的编码方式为'utf-8-sig',参数'sep'指定了数据文件中的字段分隔符为';'。
实现代码:
# 1 导入数据
df = pd.read_csv('bank-additional-full.csv', encoding='utf-8-sig', sep=';')
pd.set_option('display.max_columns', 100)  # 显示完整的列
# print(df.head(30))
# print(df.shape)
2 数据预处理
2.1 分类数据数值化
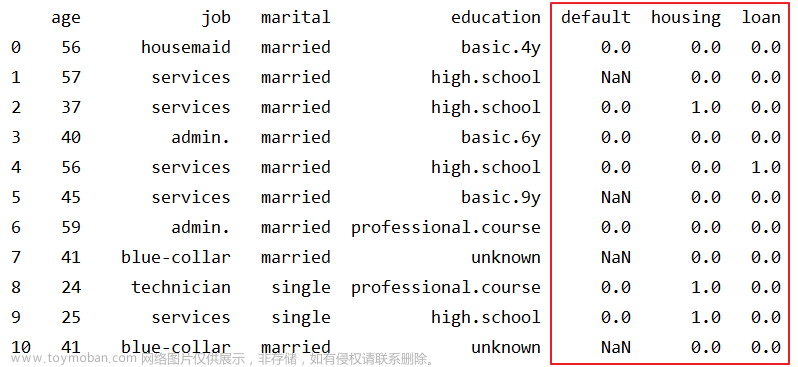
此处的分类数据分为两种情况,一是只含有两种取值(除了 'unknown' 缺失值以外有两种取值),二是含有多种取值的分类数据,如教育程度(education)。对于第一种情况,我们可以直接使用 0 和 1 来代替其两种取值。对于第二种情况,我们可以使用哑编码或者独热编码将分类数据转换为数值数据,此处,我们使用哑编码。
处理后数据(部分)如图,我们可以看出对于default而言,unknown转换为了NaN,其他取值使用0和1替换。
对于job而言,我们进行了哑编码之后的结果如下图,我们可以看出第一条数据为000100000000,表示housemaid。

实现代码:
def transform_to_binary(df, col_name):
    # yes->1   no -> 0   unknown -> NaN
    df[col_name] = df[col_name].map({'yes': 1, 'no': 0})  # 将"yes"值替换为1,将"no"值替换为0
    df[col_name].replace('unknown', np.nan, inplace=True)  # 将"unknown"替换为NaN
    return df

def dummy_variables(df, columns):
    # 哑编码
    for col in columns:
        # 将 "unknown" 替换为 NaN
        df[col] = df[col].replace('unknown', np.nan)
        # 进行哑编码
        dummies = pd.get_dummies(df[col], prefix=col, dummy_na=True)
        # 将原始列删除,并将编码列添加到 DataFrame 中
        df = df.drop(col, axis=1)
        df = pd.concat([df, dummies], axis=1)
    return df

# 2.1 分类数据数值化(哑编码)
categorical_columns = ['job', 'marital', 'education', 'default', 'housing', 'loan', 'contact', 'month', 'day_of_week',
                       'poutcome', 'y']  # 分类数据
numerical_columns = list(set(df.columns) - set(categorical_columns))  # 数值数据

# 二元分类数据
categoricaltobinarycols = ['default', 'housing', 'loan', 'y']
for col in categoricaltobinarycols:
    df = transform_to_binary(df, col)
# 分类数据哑编码
df = dummy_variables(df, ['job', 'marital', 'education', 'contact', 'month', 'day_of_week', 'poutcome'])
2.2 数值型数据规范化
数值型数据的规范化是指将数据缩放到指定的范围内,通常是将数据缩放到[0,1]或[-1,1]的区间内。进行规范化的原因是不同变量具有不同的量纲,这会影响机器学习算法的性能,导致一些变量对结果的贡献更大,而另一些变量对结果的贡献更小。Python中可以使用MinMaxScaler来进行规范化。
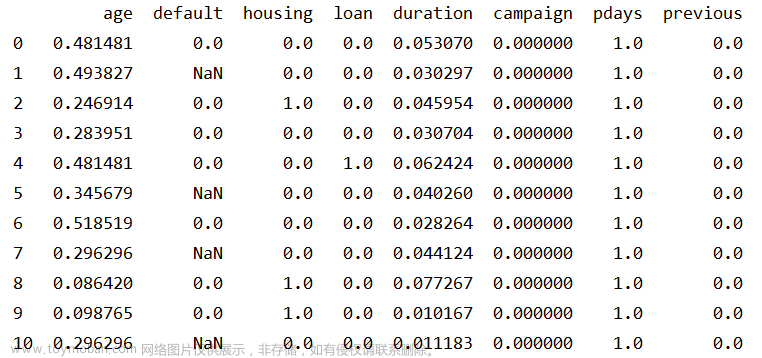
处理后数据如图,我们可以看出通过规范化可以将数值投射到[0,1]。
实现代码:
def normalize_columns(df, columns):
    # 进行规范化
    scaler = MinMaxScaler()
    for col in columns:
        if df[col].dtype != 'object':
            # 从 DataFrame 中提取出该列,并将其转换为二维数组
            col_data = df[[col]].values
            # 调用 MinMaxScaler 对象的 fit_transform() 方法进行规范化
            normalized_data = scaler.fit_transform(col_data)
            # 将规范化后的数组转换回一维,并将其添加回 DataFrame 中
            df[col] = normalized_data.flatten()
    return df

# 2.2 数值型数据标准化
df = normalize_columns(df, numerical_columns)
2.3 缺失值处理
我们需要检查数据中是否存在缺失值。数据中包含数值型数据和分类型数据。对于数值型数据(age,duration,campaign,pdays,previous,emp.var.rate,cons.price.idx,cons.conf.idx,euribor3m,nr.employed),我们可以使用 isnull() 方法来检查是否存在缺失值。对于分类型数据(),'unknown' 表示数据缺失,我们已将'unknown'替换为NaN,现使用isnull()方法进行统计。
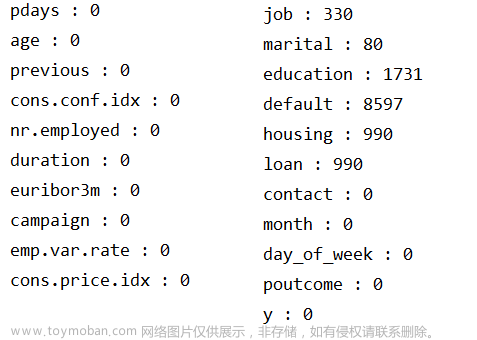
从结果可以看出,数值型数据没有缺失值,分类型中job, marital, education,default, housing, loan中存在缺失值。常见的缺失值处理方法如图所示:
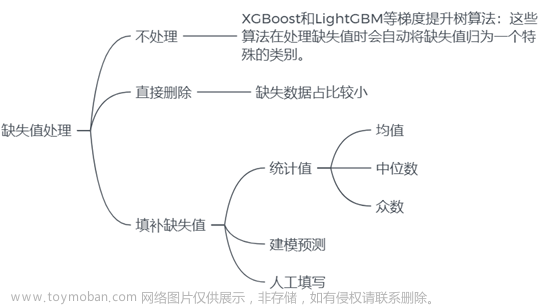
我们将目前存在缺失值的字段分为两种情况进行处理:
-
对于含有缺失值数据占比较小的字段(job 和 marital),我们可以直接删除这些缺失值所在的数据。
-
对于缺失值占比较大的字段(housing,loan,education和 default),我们可以使用不含缺失值的数据作为训练集,使用随机森林来预测缺失值,并用预测结果来填充缺失值。
实现代码:
# 2.3 缺失值处理

# 查看数值型属性缺失值
for col in numerical_columns:
     print(col + " : " + str(df[col].isnull().sum()))

 # 查看字符型属性缺失值
df.replace('unknown', np.nan, inplace=True)  #将"unknown"替换为NaN
for col in categorical_columns:
    print(col + " : " + str(df[col].isnull().sum()))


# 删除job和marital字段中的缺失值

job_cols = [col for col in df.columns if re.search('^job_', col)] # 使用正则表达式查找所有以 "job" 开头的列名
for col in job_cols:
    df.dropna(subset=[col], inplace=True)

marital_cols =[col for col in df.columns if re.search('^marital_', col)] # 使用正则表达式查找所有以 "marital" 开头的列名
for col in job_cols:
    df.dropna(subset=[col], inplace=True)

# 使用随机森林算法来预测缺失值
col_list = ['housing', 'loan', 'default']
education_cols = [col for col in df.columns if re.search('^education_', col)]
col_list += education_cols
df = impute_missing_values(df, col_list)

# 将经过处理后的 df 保存为 CSV 文件
df.to_csv('processed_data.csv', index=True)
3 模型建立
3.1 建模思路
对于银行营销数据,我们希望可以通过相关信息来确定客户是否会订阅产品(银行定期存款),即我们需要建立模型,使其可以根据输入变量(年龄,职业等)来预测输出变量(客户是否已经订阅定期存款),这是一个分类问题。
分类(classification)是指将数据按照某种标准或属性分成不同的类别或组别的过程。在分类问题中,数据通常被表示为特征(features)或属性(attributes),每个特征或属性具有一个值。分类的任务是对数据集进行学习并构造一个拥有预测功能的分类模型,用于预测未知样本的类标号。
以下是几种常用的分类方法:
-
决策树(Decision Tree):通过树状结构来描述各种决策,其中每个叶节点表示一个类别,而非叶节点表示一个判断条件。
-
朴素贝叶斯(Naive Bayes):基于贝叶斯定理的分类方法,它假设各个特征之间是相互独立的。
-
逻辑回归(Logistic Regression):一种广义线性模型,适用于二元分类或多元分类。
-
支持向量机(Support Vector Machine):通过构建最优超平面(或者多个最优超平面)来实现分类。
-
随机森林(Random Forest):一种基于决策树的集成学习方法,通过多个决策树的投票来决定分类结果。
-
K近邻算法(K-NearestNeighbor,KNN):根据待分类数据点周围K个最近邻数据点的类别来判断该数据点所属的类别。
为了寻找最优模型,我们可以尝试多种不同的模型(例如逻辑回归、随机森林、支持向量机等),并对每个模型寻找最优模型参数。然后,将每个模型的预测结果与实际结果进行比较,选择表现最好的模型作为最终的模型。
3.2 划分数据集与重采样
在划分数据集时,通常将数据划分为训练集、验证集和测试集三个部分。划分比例的具体选择取决于具体的应用场景和数据量大小等因素,一般而言,通常按照 60%-20%-20% 或 70%-15%-15% 的比例进行划分,我们选择按照60%-20%-20%划分数据集。
训练集用于训练模型,确定模型的参数和结构。通常使用大部分数据作为训练集,以便使模型能够充分学习数据的特征和规律。验证集用于调整模型的超参数,如学习率、正则化参数等。在训练过程中,验证集的表现可以帮助我们选择最好的模型,并进行模型的调整,从而避免过拟合。测试集用于评估模型的泛化性能,检查模型是否过拟合或欠拟合。测试集应该是独立于训练集和验证集的,这样才能客观地评估模型的性能。
在对数据中输出变量y进行统计后发现,负样本(y=0)远多于正样本(y=1),负样本占大多数,这会导致模型的预测结果偏向负样本,而对于正样本的预测不够准确,从而影响了模型的准确性和可靠性。为减弱数据不均衡问题带来的不利影响,我们将采用重采样方法,重采样包括欠采样和过采样两种。

欠采样指的是从多数类(即负例)中删除一些样本,使得正例和负例的数量接近。欠采样可以减少数据量,提高训练速度,但是可能会造成信息损失,且如果欠采样不合理,可能会导致欠拟合的问题。
过采样指的是从少数类(即正例)中生成新的样本,使得正例和负例的数量接近。过采样可以增加数据量,提高模型的泛化性能,但是如果过采样不合理,可能会导致过拟合的问题。
我们将使用SMOTE实现过采样以平衡数据,SMOTE(Synthetic Minority Over-samplingTechnique)是根据少数类样本之间的相似性生成新的样本,以达到平衡数据集的目的。具体来说,SMOTE算法的步骤如下:
1.对于每个少数类样本,计算其与所有少数类样本之间的欧氏距离,并将距离最近的K个样本记录下来,这些样本称为其K近邻样本。
2.对于每个少数类样本,从其K近邻样本中随机选择一个样本,然后在少数类样本与该样本之间的连线上随机生成一个新的样本,即生成的新样本的每个特征值都是原始样本和该K近邻样本对应特征值的线性插值。
3.将生成的新样本添加到原始的少数类样本集中,从而构成一个新的平衡的数据集。
实现代码:
#划分数据集
train_data, test_val_data = train_test_split(df, test_size=0.4,
                                             random_state=42)  # 使用train_test_split函数将原始数据集data按照test_size=0.4的比例划分为训练集train_data和测试集+验证集的组合test_val_data,其中test_size表示测试集所占比例,这里设置为40%。
test_data, val_data = train_test_split(test_val_data, test_size=0.5,
                                       random_state=42)  # 使用train_test_split函数将test_val_data按照test_size=0.5的比例划分为测试集test_data和验证集val_data
# 打印数据集大小
print(f'Train data size: {train_data.shape[0]}')
print(f'Validation data size: {val_data.shape[0]}')
print(f'Test data size: {test_data.shape[0]}')

# 简单统计查看数据是否平衡
print(df['y'].value_counts())

# 对训练集数据进行SMOTE

X_train = train_data.drop("y", axis=1)
y_train = train_data["y"]

smote = SMOTE(random_state=42, k_neighbors=3)
X_train_res, y_train_res = smote.fit_resample(X_train, y_train)
print('原始数据集中各类别样本数量:\n', y_train.value_counts())
print('过采样后数据集中各类别样本数量:\n', y_train_res.value_counts())

X_train_res = X_train_res.values
y_train_res = y_train_res.values

X_test = test_data.drop("y", axis=1).values
y_test = test_data["y"].values

X_val = val_data.drop("y", axis=1).values
y_val = val_data["y"].values
3.3 模型的训练与评估
常见的分类模型包括逻辑回归(Logistic Regression)、决策树(Decision Tree)、随机森林(Random Forest)、朴素贝叶斯(Naive Bayes)、支持向量机(Support Vector Machine,SVM)、K近邻算法(K-Nearest Neighbors)、神经网络(Neural Networks)等。我们将选择逻辑回归、朴素贝叶斯、支持向量机和随机森林在训练集上进行训练,并分别进行参数寻优,在交叉验证集上进行评估,随机森林表现更优,所以最终选择在随机森林模型在测试集上进行测试。
通过网格调参得到各模型在训练集上的最优参数:
逻辑回归:

朴素贝叶斯:

随机森林:

使用各模型最佳参数对训练集数据进行训练,并在交叉验证集上进行测试,打印各模型正样本的f1-score:

最后,我们将选择f1得分最高的随机森林模型进行应用,打印正样本的f1-score:

实现代码:
# 3.0 定义评价指标为正样本的F1-score
scoring = {'f1_score': make_scorer(f1_score, pos_label=1)}

#3.1在训练集上建立逻辑回归模型(Logistic Regression),并寻找最优参数

# 创建Logistic Regression对象
lr_model = LogisticRegression(max_iter = 100000)

# 定义要搜索的参数组合
parameters_lr = {
    'solver': ['lbfgs', 'liblinear'],
    'penalty': ['l1', 'l2'],
    'C': [0.1, 1, 10]
}

# 创建GridSearchCV对象
grid_search_lr = GridSearchCV(lr_model, parameters_lr, scoring=scoring, cv=5, return_train_score=True, refit='f1_score')

# 在训练集上拟合GridSearchCV对象
grid_search_lr.fit(X_train_res, y_train_res)

# 输出最优参数及其对应的分数
print("Model name: Logistic Regression")
print("Best parameters: ", grid_search_lr.best_params_)
print('Best Score:', grid_search_lr.best_score_)

#3.2在训练集上建立朴素贝叶斯模型(Naive Bayes),并寻找最优参数

# 设置参数范围
parameters_clf = {
    'var_smoothing': np.logspace(0,-9, num=100)
}

# 创建一个GaussianNB分类器对象
clf = GaussianNB()

# 创建GridSearchCV对象
grid_search_clf = GridSearchCV(clf, parameters_clf, scoring=scoring, cv=5,return_train_score=True, refit='f1_score')

# 在训练集上拟合GridSearchCV对象
grid_search_clf.fit(X_train_res,y_train_res)

# 打印最优参数和最优得分
print("Model name: Naive Bayes")
print("Best parameters: {}".format(grid_search_clf.best_params_))
print("Best F1-score: {:.2f}".format(grid_search_clf.best_score_))

#3.3在训练集上建立随机森林模型(Random Forest),并寻找最优参数

# 定义参数范围
parameters_rfc = {'n_estimators': [50, 100, 200],
          'max_depth': [5, 10, 20],
          'min_samples_split': [2, 5, 10],
          'min_samples_leaf': [1, 2, 4]}

# 创建模型
rfc = RandomForestClassifier()

# 创建GridSearchCV对象
grid_search_rfc = GridSearchCV(estimator=rfc, param_grid=parameters_rfc, scoring=scoring, cv=5,return_train_score=True, refit='f1_score')

# 在训练集上拟合GridSearchCV对象
grid_search_rfc.fit(X_train_res,y_train_res)

# 输出最优参数和最优得分
print("Model name: Random Forest")
print('Best parameters:', grid_search_rfc.best_params_)
print('Best score:', grid_search_rfc.best_score_)

#4 在交叉验证集上测试各模型的性能
best_lr_model = LogisticRegression(C=0.1, penalty='l1', solver='liblinear', max_iter=100000)
best_clf_model = GaussianNB(var_smoothing=1.519911082952933e-06)
best_rfc_model= RandomForestClassifier(max_depth =20,min_samples_leaf=1,min_samples_split=2,n_estimators = 100)

models = [best_lr_model, best_clf_model, best_rfc_model]

best_lr_model.fit(X_train_res,y_train_res)
best_clf_model.fit(X_train_res,y_train_res)
best_rfc_model.fit(X_train_res,y_train_res)

for model in models:
    y_pred = model.predict(X_val)
    f1 = f1_score(y_val, y_pred, pos_label=1)
    print("模型", model.__class__.__name__, "在val上正样本的F1分数为:", f1)

#5 在测试集上应用随机森林 RandomForestClassifier
y_pred_test = best_rfc_model.predict(X_test)
f1 = f1_score(y_test, y_pred_test, pos_label=1)
print("模型", model.__class__.__name__, "在测试集上正样本的F1分数为:", f1)
4 展望
最终建立的随机森林模型还有提高的可能性,我们可以考虑以下几个方面来提高F1得分:
-
特征工程:通过选择更好的特征或者构造新的特征,使得模型更能捕捉样本之间的差异和关联,提高模型的分类性能。
-
模型集成:将多个模型进行集成,可以获得更好的分类性能,如投票、平均、加权平均等集成方法。文章来源:https://www.toymoban.com/news/detail-480535.html
-
模型选择:尝试使用其他算法或者改进的模型结构,如神经网络、深度学习等,以期获得更好的分类性能。文章来源地址https://www.toymoban.com/news/detail-480535.html
完整代码
#data preprocessing

import pandas as pd
import numpy as np
import re
from sklearn.ensemble import RandomForestClassifier
from sklearn.preprocessing import MinMaxScaler


def transform_to_binary(df, col_name):
    # yes->1   no -> 0   unknown -> NaN
    df[col_name] = df[col_name].map({'yes': 1, 'no': 0})  # 将"yes"值替换为1,将"no"值替换为0
    df[col_name].replace('unknown', np.nan, inplace=True)  # 将"unknown"替换为NaN
    return df

def dummy_variables(df, columns):
    # 哑编码
    for col in columns:
        # 将 "unknown" 替换为 NaN
        df[col] = df[col].replace('unknown', np.nan)
        # 进行哑编码
        dummies = pd.get_dummies(df[col], prefix=col, dummy_na=True)
        # 将原始列删除,并将编码列添加到 DataFrame 中
        df = df.drop(col, axis=1)
        df = pd.concat([df, dummies], axis=1)
    return df


def normalize_columns(df, columns):
    # 进行规范化
    scaler = MinMaxScaler()
    for col in columns:
        if df[col].dtype != 'object':
            # 从 DataFrame 中提取出该列,并将其转换为二维数组
            col_data = df[[col]].values
            # 调用 MinMaxScaler 对象的 fit_transform() 方法进行规范化
            normalized_data = scaler.fit_transform(col_data)
            # 将规范化后的数组转换回一维,并将其添加回 DataFrame 中
            df[col] = normalized_data.flatten()
    return df


def impute_missing_values(df, column_list):
    # 创建训练集和测试集
    train_data = df[df[column_list].notnull().all(axis=1)]
    test_data = df[df[column_list].isnull().any(axis=1)]

    # 分离特征和标签
    X_train = train_data.drop(column_list, axis=1)
    y_train = train_data[column_list]

    X_test = test_data.drop(column_list, axis=1)

    # 使用随机森林模型拟合
    rf = RandomForestClassifier()
    rf.fit(X_train, y_train)

    # 预测缺失值
    y_pred = rf.predict(X_test)

    # 填充缺失值
    df.loc[df[column_list].isnull().any(axis=1), column_list] = y_pred

    # 返回填充后的数据
    return df

# 1 导入数据
df = pd.read_csv('bank-additional-full.csv', encoding='utf-8-sig', sep=';')
pd.set_option('display.max_columns', 100)  # 显示完整的列
# print(df.head(30))
# print(df.shape)


# 2 数据预处理与特征工程
# 2.1 分类数据数值化(哑编码)
categorical_columns = ['job', 'marital', 'education', 'default', 'housing', 'loan', 'contact', 'month', 'day_of_week',
                       'poutcome', 'y']  # 分类数据
numerical_columns = list(set(df.columns) - set(categorical_columns))  # 数值数据

# 二元分类数据
categoricaltobinarycols = ['default', 'housing', 'loan', 'y']
for col in categoricaltobinarycols:
    df = transform_to_binary(df, col)
# 分类数据哑编码
df = dummy_variables(df, ['job', 'marital', 'education', 'contact', 'month', 'day_of_week', 'poutcome'])
# 2.2 数值型数据标准化
df = normalize_columns(df, numerical_columns)

# 2.3 缺失值处理

# # 查看数值型属性缺失值
# for col in numerical_columns:
#     print(col + " : " + str(df[col].isnull().sum()))
#
# # 查看字符型属性缺失值
# df.replace('unknown', np.nan, inplace=True)  #将"unknown"替换为NaN
# for col in categorical_columns:
#     print(col + " : " + str(df[col].isnull().sum()))


# 删除job和marital字段中的缺失值

job_cols = [col for col in df.columns if re.search('^job_', col)] # 使用正则表达式查找所有以 "job" 开头的列名
for col in job_cols:
    df.dropna(subset=[col], inplace=True)

marital_cols =[col for col in df.columns if re.search('^marital_', col)] # 使用正则表达式查找所有以 "marital" 开头的列名
for col in job_cols:
    df.dropna(subset=[col], inplace=True)

# 使用随机森林算法来预测缺失值
col_list = ['housing', 'loan', 'default']
education_cols = [col for col in df.columns if re.search('^education_', col)]
col_list += education_cols
df = impute_missing_values(df, col_list)

# 将经过处理后的 df 保存为 CSV 文件
df.to_csv('processed_data.csv', index=True)

#-------------------------------------------------------------------------------------
# models

import pandas as pd
import numpy as np
from sklearn.model_selection import train_test_split
from imblearn.over_sampling import SMOTE
from sklearn.model_selection import GridSearchCV
from sklearn.metrics import f1_score, make_scorer
from sklearn.linear_model import LogisticRegression
from sklearn.naive_bayes import GaussianNB
from sklearn.ensemble import RandomForestClassifier
from sklearn import svm

# 1.导入数据
df = pd.read_csv('processed_data.csv', encoding='utf-8-sig')
pd.set_option('display.max_columns', 100)
df = df.drop(df.columns[0], axis=1)  # 原始数据中第一列为列号,导入后需要去掉
# print(df.head(30))

# 2.划分数据集
train_data, test_val_data = train_test_split(df, test_size=0.4,
                                             random_state=42)  # 使用train_test_split函数将原始数据集data按照test_size=0.4的比例划分为训练集train_data和测试集+验证集的组合test_val_data,其中test_size表示测试集所占比例,这里设置为40%。
test_data, val_data = train_test_split(test_val_data, test_size=0.5,
                                       random_state=42)  # 使用train_test_split函数将test_val_data按照test_size=0.5的比例划分为测试集test_data和验证集val_data
# 打印数据集大小
print(f'Train data size: {train_data.shape[0]}')
print(f'Validation data size: {val_data.shape[0]}')
print(f'Test data size: {test_data.shape[0]}')

# 简单统计查看数据是否平衡
print(df['y'].value_counts())

# 对训练集数据进行SMOTE

X_train = train_data.drop("y", axis=1)
y_train = train_data["y"]

smote = SMOTE(random_state=42, k_neighbors=3)
X_train_res, y_train_res = smote.fit_resample(X_train, y_train)
print('原始数据集中各类别样本数量:\n', y_train.value_counts())
print('过采样后数据集中各类别样本数量:\n', y_train_res.value_counts())

X_train_res = X_train_res.values
y_train_res = y_train_res.values

X_test = test_data.drop("y", axis=1).values
y_test = test_data["y"].values

X_val = val_data.drop("y", axis=1).values
y_val = val_data["y"].values

# 3.0 定义评价指标为正样本的F1-score
scoring = {'f1_score': make_scorer(f1_score, pos_label=1)}

#3.1在训练集上建立逻辑回归模型(Logistic Regression),并寻找最优参数

# 创建Logistic Regression对象
lr_model = LogisticRegression(max_iter = 100000)

# 定义要搜索的参数组合
parameters_lr = {
    'solver': ['lbfgs', 'liblinear'],
    'penalty': ['l1', 'l2'],
    'C': [0.1, 1, 10]
}

# 创建GridSearchCV对象
grid_search_lr = GridSearchCV(lr_model, parameters_lr, scoring=scoring, cv=5, return_train_score=True, refit='f1_score')

# 在训练集上拟合GridSearchCV对象
grid_search_lr.fit(X_train_res, y_train_res)

# 输出最优参数及其对应的分数
print("Model name: Logistic Regression")
print("Best parameters: ", grid_search_lr.best_params_)
print('Best Score:', grid_search_lr.best_score_)

#3.2在训练集上建立朴素贝叶斯模型(Naive Bayes),并寻找最优参数

# 设置参数范围
parameters_clf = {
    'var_smoothing': np.logspace(0,-9, num=100)
}

# 创建一个GaussianNB分类器对象
clf = GaussianNB()

# 创建GridSearchCV对象
grid_search_clf = GridSearchCV(clf, parameters_clf, scoring=scoring, cv=5,return_train_score=True, refit='f1_score')

# 在训练集上拟合GridSearchCV对象
grid_search_clf.fit(X_train_res,y_train_res)

# 打印最优参数和最优得分
print("Model name: Naive Bayes")
print("Best parameters: {}".format(grid_search_clf.best_params_))
print("Best F1-score: {:.2f}".format(grid_search_clf.best_score_))

#3.3在训练集上建立随机森林模型(Random Forest),并寻找最优参数

# 定义参数范围
parameters_rfc = {'n_estimators': [50, 100, 200],
          'max_depth': [5, 10, 20],
          'min_samples_split': [2, 5, 10],
          'min_samples_leaf': [1, 2, 4]}

# 创建模型
rfc = RandomForestClassifier()

# 创建GridSearchCV对象
grid_search_rfc = GridSearchCV(estimator=rfc, param_grid=parameters_rfc, scoring=scoring, cv=5,return_train_score=True, refit='f1_score')

# 在训练集上拟合GridSearchCV对象
grid_search_rfc.fit(X_train_res,y_train_res)

# 输出最优参数和最优得分
print("Model name: Random Forest")
print('Best parameters:', grid_search_rfc.best_params_)
print('Best score:', grid_search_rfc.best_score_)

# 3.4 在训练集上建立支持向量机(SVM),并寻找最优参数
# 定义参数范围
parameters_svc = {
    'C': np.logspace(-2, 2, 5),
    'kernel': ['linear', 'poly', 'rbf', 'sigmoid'],
    'gamma': ['scale', 'auto'] + list(np.logspace(-3, 3, 7))
}
# 定义模型
svc = svm.SVC()

# 定义GridSearchCV
grid_search_svc = GridSearchCV(svc, param_grid=parameters_svc, scoring=scoring, cv=5, return_train_score=True,
                               refit='f1_score', n_jobs=-1)

# 训练模型
grid_search_svc.fit(X_train_res, y_train_res)

# 输出最佳参数和最佳得分
print("Model name: Support Vector Machine")
print("Best parameters: ", grid_search_svc.best_params_)
print("Best score: ", grid_search_svc.best_score_)

#4 在交叉验证集上测试各模型的性能
best_lr_model = LogisticRegression(C=0.1, penalty='l1', solver='liblinear', max_iter=100000)
best_clf_model = GaussianNB(var_smoothing=1.519911082952933e-06)
best_rfc_model= RandomForestClassifier(max_depth =20,min_samples_leaf=1,min_samples_split=2,n_estimators = 100)

models = [best_lr_model, best_clf_model, best_rfc_model]

best_lr_model.fit(X_train_res,y_train_res)
best_clf_model.fit(X_train_res,y_train_res)
best_rfc_model.fit(X_train_res,y_train_res)

for model in models:
    y_pred = model.predict(X_val)
    f1 = f1_score(y_val, y_pred, pos_label=1)
    print("模型", model.__class__.__name__, "在val上正样本的F1分数为:", f1)

#5 在测试集上应用随机森林 RandomForestClassifier
y_pred_test = best_rfc_model.predict(X_test)
f1 = f1_score(y_test, y_pred_test, pos_label=1)
print("模型", model.__class__.__name__, "在测试集上正样本的F1分数为:", f1)
到了这里,关于用银行营销数据学习数据挖掘:探索预测客户购买行为的模型的文章就介绍完了。如果您还想了解更多内容,请在右上角搜索TOY模板网以前的文章或继续浏览下面的相关文章,希望大家以后多多支持TOY模板网!


