1.定义lcm通信传输数据
result_pcd_t.lcm
package exlcm;

struct results_pcd_t
{
    int64_t  dims[2];
    int64_t  total_nums;
    int64_t  num_ranges;
    double  ranges[num_ranges];
    double  results[total_nums];
}
2.测试脚本,读取点云数据并显示
test.py
import numpy as np
import show_result

def read_pcd(filepath):
    lidar = []
    lidars = []
    with open(filepath,'r') as f:
        line = f.readline().strip()
        while line:
            linestr = line.split(" ")
            if len(linestr) == 4:
                linestr_convert = list(map(float, linestr))
                lidar.append(linestr_convert)
                lidars.extend(linestr_convert)
            line = f.readline().strip()
    return np.array(lidar, dtype=np.float32)

if __name__ == "__main__":
    filepath = "/home/nvidia/Leador_storage/zs/xiaomayi/data/caiji/2023-03-15-15-53-20/85.pcd"
    pcd_data = read_pcd(filepath)
    print(pcd_data)
    print(type(pcd_data))
    pred_bboxes = np.array([[0,0,0,8,4,2,0.4]], dtype=np.float32)
    show_result.show_result(pcd_data,pred_bboxes = pred_bboxes,show=True)
show_result.py
# Copyright (c) OpenMMLab. All rights reserved.
from os import path as osp

# import mmcv
import numpy as np
# import trimesh

def show_result(points,
                pred_bboxes,
                show=False,
                snapshot=False,
                pred_labels=None):
    """Convert results into format that is directly readable for meshlab.

    Args:
        points (np.ndarray): Points.
        gt_bboxes (np.ndarray): Ground truth boxes.
        pred_bboxes (np.ndarray): Predicted boxes.
        out_dir (str): Path of output directory
        filename (str): Filename of the current frame.
        show (bool, optional): Visualize the results online. Defaults to False.
        snapshot (bool, optional): Whether to save the online results.
            Defaults to False.
        pred_labels (np.ndarray, optional): Predicted labels of boxes.
            Defaults to None.
    """

    if show:
        from open3d_vis import Visualizer

        vis = Visualizer(points)
        if pred_bboxes is not None:
            if pred_labels is None:
                vis.add_bboxes(bbox3d=pred_bboxes)
            else:
                palette = np.random.randint(
                    0, 255, size=(pred_labels.max() + 1, 3)) / 256
                labelDict = {}
                for j in range(len(pred_labels)):
                    i = int(pred_labels[j].numpy())
                    if labelDict.get(i) is None:
                        labelDict[i] = []
                    labelDict[i].append(pred_bboxes[j])
                for i in labelDict:
                    vis.add_bboxes(
                        bbox3d=np.array(labelDict[i]),
                        bbox_color=palette[i],
                        points_in_box_color=palette[i])

        # if gt_bboxes is not None:
        #     vis.add_bboxes(bbox3d=gt_bboxes, bbox_color=(0, 0, 1))
        # show_path = osp.join(result_path,
        #                      f'{filename}_online.png') if snapshot else None
        vis.show(None)

    # if points is not None:
    #     _write_obj(points, osp.join(result_path, f'{filename}_points.obj'))
open3d_vis.py
# Copyright (c) OpenMMLab. All rights reserved.
import copy

import numpy as np
import torch

try:
    import open3d as o3d
    from open3d import geometry
except ImportError:
    raise ImportError(
        'Please run "pip install open3d" to install open3d first.')


def _draw_points(points,
                 vis,
                 points_size=2,
                 point_color=(0.5, 0.5, 0.5),
                 mode='xyz'):
    """Draw points on visualizer.

    Args:
        points (numpy.array | torch.tensor, shape=[N, 3+C]):
            points to visualize.
        vis (:obj:`open3d.visualization.Visualizer`): open3d visualizer.
        points_size (int, optional): the size of points to show on visualizer.
            Default: 2.
        point_color (tuple[float], optional): the color of points.
            Default: (0.5, 0.5, 0.5).
        mode (str, optional):  indicate type of the input points,
            available mode ['xyz', 'xyzrgb']. Default: 'xyz'.

    Returns:
        tuple: points, color of each point.
    """
    vis.get_render_option().point_size = points_size  # set points size
    if isinstance(points, torch.Tensor):
        points = points.cpu().numpy()

    points = points.copy()
    pcd = geometry.PointCloud()
    if mode == 'xyz':
        pcd.points = o3d.utility.Vector3dVector(points[:, :3])
        points_colors = np.tile(np.array(point_color), (points.shape[0], 1))
    elif mode == 'xyzrgb':
        pcd.points = o3d.utility.Vector3dVector(points[:, :3])
        points_colors = points[:, 3:6]
        # normalize to [0, 1] for open3d drawing
        if not ((points_colors >= 0.0) & (points_colors <= 1.0)).all():
            points_colors /= 255.0
    else:
        raise NotImplementedError

    pcd.colors = o3d.utility.Vector3dVector(points_colors)
    vis.add_geometry(pcd)

    return pcd, points_colors


def _draw_bboxes(bbox3d,
                 vis,
                 points_colors,
                 pcd=None,
                 bbox_color=(0, 1, 0),
                 points_in_box_color=(1, 0, 0),
                 rot_axis=2,
                 center_mode='lidar_bottom',
                 mode='xyz'):
    """Draw bbox on visualizer and change the color of points inside bbox3d.

    Args:
        bbox3d (numpy.array | torch.tensor, shape=[M, 7]):
            3d bbox (x, y, z, x_size, y_size, z_size, yaw) to visualize.
        vis (:obj:`open3d.visualization.Visualizer`): open3d visualizer.
        points_colors (numpy.array): color of each points.
        pcd (:obj:`open3d.geometry.PointCloud`, optional): point cloud.
            Default: None.
        bbox_color (tuple[float], optional): the color of bbox.
            Default: (0, 1, 0).
        points_in_box_color (tuple[float], optional):
            the color of points inside bbox3d. Default: (1, 0, 0).
        rot_axis (int, optional): rotation axis of bbox. Default: 2.
        center_mode (bool, optional): indicate the center of bbox is
            bottom center or gravity center. available mode
            ['lidar_bottom', 'camera_bottom']. Default: 'lidar_bottom'.
        mode (str, optional):  indicate type of the input points,
            available mode ['xyz', 'xyzrgb']. Default: 'xyz'.
    """
    if isinstance(bbox3d, torch.Tensor):
        bbox3d = bbox3d.cpu().numpy()
    bbox3d = bbox3d.copy()

    in_box_color = np.array(points_in_box_color)
    for i in range(len(bbox3d)):
        center = bbox3d[i, 0:3]
        dim = bbox3d[i, 3:6]
        yaw = np.zeros(3)
        yaw[rot_axis] = bbox3d[i, 6]
        rot_mat = geometry.get_rotation_matrix_from_xyz(yaw)

        if center_mode == 'lidar_bottom':
            center[rot_axis] += dim[
                rot_axis] / 2  # bottom center to gravity center
        elif center_mode == 'camera_bottom':
            center[rot_axis] -= dim[
                rot_axis] / 2  # bottom center to gravity center
        box3d = geometry.OrientedBoundingBox(center, rot_mat, dim)

        line_set = geometry.LineSet.create_from_oriented_bounding_box(box3d)
        line_set.paint_uniform_color(bbox_color)
        # draw bboxes on visualizer
        vis.add_geometry(line_set)

        # change the color of points which are in box
        if pcd is not None and mode == 'xyz':
            indices = box3d.get_point_indices_within_bounding_box(pcd.points)
            points_colors[indices] = in_box_color

    # update points colors
    if pcd is not None:
        pcd.colors = o3d.utility.Vector3dVector(points_colors)
        vis.update_geometry(pcd)


def show_pts_boxes(points,
                   bbox3d=None,
                   show=True,
                   save_path=None,
                   points_size=2,
                   point_color=(0.5, 0.5, 0.5),
                   bbox_color=(0, 1, 0),
                   points_in_box_color=(1, 0, 0),
                   rot_axis=2,
                   center_mode='lidar_bottom',
                   mode='xyz'):
    """Draw bbox and points on visualizer.

    Args:
        points (numpy.array | torch.tensor, shape=[N, 3+C]):
            points to visualize.
        bbox3d (numpy.array | torch.tensor, shape=[M, 7], optional):
            3D bbox (x, y, z, x_size, y_size, z_size, yaw) to visualize.
            Defaults to None.
        show (bool, optional): whether to show the visualization results.
            Default: True.
        save_path (str, optional): path to save visualized results.
            Default: None.
        points_size (int, optional): the size of points to show on visualizer.
            Default: 2.
        point_color (tuple[float], optional): the color of points.
            Default: (0.5, 0.5, 0.5).
        bbox_color (tuple[float], optional): the color of bbox.
            Default: (0, 1, 0).
        points_in_box_color (tuple[float], optional):
            the color of points which are in bbox3d. Default: (1, 0, 0).
        rot_axis (int, optional): rotation axis of bbox. Default: 2.
        center_mode (bool, optional): indicate the center of bbox is bottom
            center or gravity center. available mode
            ['lidar_bottom', 'camera_bottom']. Default: 'lidar_bottom'.
        mode (str, optional):  indicate type of the input points, available
            mode ['xyz', 'xyzrgb']. Default: 'xyz'.
    """
    # TODO: support score and class info
    assert 0 <= rot_axis <= 2

    # init visualizer
    vis = o3d.visualization.Visualizer()
    vis.create_window()
    mesh_frame = geometry.TriangleMesh.create_coordinate_frame(
        size=1, origin=[0, 0, 0])  # create coordinate frame
    vis.add_geometry(mesh_frame)

    # draw points
    pcd, points_colors = _draw_points(points, vis, points_size, point_color,
                                      mode)

    # draw boxes
    if bbox3d is not None:
        _draw_bboxes(bbox3d, vis, points_colors, pcd, bbox_color,
                     points_in_box_color, rot_axis, center_mode, mode)

    if show:
        vis.run()

    if save_path is not None:
        vis.capture_screen_image(save_path)

    vis.destroy_window()


def _draw_bboxes_ind(bbox3d,
                     vis,
                     indices,
                     points_colors,
                     pcd=None,
                     bbox_color=(0, 1, 0),
                     points_in_box_color=(1, 0, 0),
                     rot_axis=2,
                     center_mode='lidar_bottom',
                     mode='xyz'):
    """Draw bbox on visualizer and change the color or points inside bbox3d
    with indices.

    Args:
        bbox3d (numpy.array | torch.tensor, shape=[M, 7]):
            3d bbox (x, y, z, x_size, y_size, z_size, yaw) to visualize.
        vis (:obj:`open3d.visualization.Visualizer`): open3d visualizer.
        indices (numpy.array | torch.tensor, shape=[N, M]):
            indicate which bbox3d that each point lies in.
        points_colors (numpy.array): color of each points.
        pcd (:obj:`open3d.geometry.PointCloud`, optional): point cloud.
            Default: None.
        bbox_color (tuple[float], optional): the color of bbox.
            Default: (0, 1, 0).
        points_in_box_color (tuple[float], optional):
            the color of points which are in bbox3d. Default: (1, 0, 0).
        rot_axis (int, optional): rotation axis of bbox. Default: 2.
        center_mode (bool, optional): indicate the center of bbox is
            bottom center or gravity center. available mode
            ['lidar_bottom', 'camera_bottom']. Default: 'lidar_bottom'.
        mode (str, optional):  indicate type of the input points,
            available mode ['xyz', 'xyzrgb']. Default: 'xyz'.
    """
    if isinstance(bbox3d, torch.Tensor):
        bbox3d = bbox3d.cpu().numpy()
    if isinstance(indices, torch.Tensor):
        indices = indices.cpu().numpy()
    bbox3d = bbox3d.copy()

    in_box_color = np.array(points_in_box_color)
    for i in range(len(bbox3d)):
        center = bbox3d[i, 0:3]
        dim = bbox3d[i, 3:6]
        yaw = np.zeros(3)
        # TODO: fix problem of current coordinate system
        # dim[0], dim[1] = dim[1], dim[0]  # for current coordinate
        # yaw[rot_axis] = -(bbox3d[i, 6] - 0.5 * np.pi)
        yaw[rot_axis] = -bbox3d[i, 6]
        rot_mat = geometry.get_rotation_matrix_from_xyz(yaw)
        if center_mode == 'lidar_bottom':
            center[rot_axis] += dim[
                rot_axis] / 2  # bottom center to gravity center
        elif center_mode == 'camera_bottom':
            center[rot_axis] -= dim[
                rot_axis] / 2  # bottom center to gravity center
        box3d = geometry.OrientedBoundingBox(center, rot_mat, dim)

        line_set = geometry.LineSet.create_from_oriented_bounding_box(box3d)
        line_set.paint_uniform_color(bbox_color)
        # draw bboxes on visualizer
        vis.add_geometry(line_set)

        # change the color of points which are in box
        if pcd is not None and mode == 'xyz':
            points_colors[indices[:, i].astype(np.bool)] = in_box_color

    # update points colors
    if pcd is not None:
        pcd.colors = o3d.utility.Vector3dVector(points_colors)
        vis.update_geometry(pcd)


def show_pts_index_boxes(points,
                         bbox3d=None,
                         show=True,
                         indices=None,
                         save_path=None,
                         points_size=2,
                         point_color=(0.5, 0.5, 0.5),
                         bbox_color=(0, 1, 0),
                         points_in_box_color=(1, 0, 0),
                         rot_axis=2,
                         center_mode='lidar_bottom',
                         mode='xyz'):
    """Draw bbox and points on visualizer with indices that indicate which
    bbox3d that each point lies in.

    Args:
        points (numpy.array | torch.tensor, shape=[N, 3+C]):
            points to visualize.
        bbox3d (numpy.array | torch.tensor, shape=[M, 7]):
            3D bbox (x, y, z, x_size, y_size, z_size, yaw) to visualize.
            Defaults to None.
        show (bool, optional): whether to show the visualization results.
            Default: True.
        indices (numpy.array | torch.tensor, shape=[N, M], optional):
            indicate which bbox3d that each point lies in. Default: None.
        save_path (str, optional): path to save visualized results.
            Default: None.
        points_size (int, optional): the size of points to show on visualizer.
            Default: 2.
        point_color (tuple[float], optional): the color of points.
            Default: (0.5, 0.5, 0.5).
        bbox_color (tuple[float], optional): the color of bbox.
            Default: (0, 1, 0).
        points_in_box_color (tuple[float], optional):
            the color of points which are in bbox3d. Default: (1, 0, 0).
        rot_axis (int, optional): rotation axis of bbox. Default: 2.
        center_mode (bool, optional): indicate the center of bbox is
            bottom center or gravity center. available mode
            ['lidar_bottom', 'camera_bottom']. Default: 'lidar_bottom'.
        mode (str, optional):  indicate type of the input points,
            available mode ['xyz', 'xyzrgb']. Default: 'xyz'.
    """
    # TODO: support score and class info
    assert 0 <= rot_axis <= 2

    # init visualizer
    vis = o3d.visualization.Visualizer()
    vis.create_window()
    mesh_frame = geometry.TriangleMesh.create_coordinate_frame(
        size=1, origin=[0, 0, 0])  # create coordinate frame
    vis.add_geometry(mesh_frame)

    # draw points
    pcd, points_colors = _draw_points(points, vis, points_size, point_color,
                                      mode)

    # draw boxes
    if bbox3d is not None:
        _draw_bboxes_ind(bbox3d, vis, indices, points_colors, pcd, bbox_color,
                         points_in_box_color, rot_axis, center_mode, mode)

    if show:
        vis.run()

    if save_path is not None:
        vis.capture_screen_image(save_path)

    vis.destroy_window()


class Visualizer(object):
    r"""Online visualizer implemented with Open3d.

    Args:
        points (numpy.array, shape=[N, 3+C]): Points to visualize. The Points
            cloud is in mode of Coord3DMode.DEPTH (please refer to
            core.structures.coord_3d_mode).
        bbox3d (numpy.array, shape=[M, 7], optional): 3D bbox
            (x, y, z, x_size, y_size, z_size, yaw) to visualize.
            The 3D bbox is in mode of Box3DMode.DEPTH with
            gravity_center (please refer to core.structures.box_3d_mode).
            Default: None.
        save_path (str, optional): path to save visualized results.
            Default: None.
        points_size (int, optional): the size of points to show on visualizer.
            Default: 2.
        point_color (tuple[float], optional): the color of points.
            Default: (0.5, 0.5, 0.5).
        bbox_color (tuple[float], optional): the color of bbox.
            Default: (0, 1, 0).
        points_in_box_color (tuple[float], optional):
            the color of points which are in bbox3d. Default: (1, 0, 0).
        rot_axis (int, optional): rotation axis of bbox. Default: 2.
        center_mode (bool, optional): indicate the center of bbox is
            bottom center or gravity center. available mode
            ['lidar_bottom', 'camera_bottom']. Default: 'lidar_bottom'.
        mode (str, optional):  indicate type of the input points,
            available mode ['xyz', 'xyzrgb']. Default: 'xyz'.
    """

    def __init__(self,
                 points=None,
                 bbox3d=None,
                 save_path=None,
                 points_size=2,
                 point_color=(0.5, 0.5, 0.5),
                 bbox_color=(0, 1, 0),
                 points_in_box_color=(1, 0, 0),
                 rot_axis=2,
                 center_mode='lidar_bottom',
                 mode='xyz'):
        super(Visualizer, self).__init__()
        assert 0 <= rot_axis <= 2

        # init visualizer
        self.o3d_visualizer = o3d.visualization.Visualizer()
        self.o3d_visualizer.create_window()
        mesh_frame = geometry.TriangleMesh.create_coordinate_frame(
            size=1, origin=[0, 0, 0])  # create coordinate frame
        self.o3d_visualizer.add_geometry(mesh_frame)

        self.points_size = points_size
        self.point_color = point_color
        self.bbox_color = bbox_color
        self.points_in_box_color = points_in_box_color
        self.rot_axis = rot_axis
        self.center_mode = center_mode
        self.mode = mode
        self.seg_num = 0

        # draw points
        if points is not None:
            self.pcd, self.points_colors = _draw_points(
                points, self.o3d_visualizer, points_size, point_color, mode)

        # draw boxes
        if bbox3d is not None:
            _draw_bboxes(bbox3d, self.o3d_visualizer, self.points_colors,
                         self.pcd, bbox_color, points_in_box_color, rot_axis,
                         center_mode, mode)

    def add_bboxes(self, bbox3d, bbox_color=None, points_in_box_color=None):
        """Add bounding box to visualizer.

        Args:
            bbox3d (numpy.array, shape=[M, 7]):
                3D bbox (x, y, z, x_size, y_size, z_size, yaw)
                to be visualized. The 3d bbox is in mode of
                Box3DMode.DEPTH with gravity_center (please refer to
                core.structures.box_3d_mode).
            bbox_color (tuple[float]): the color of bbox. Default: None.
            points_in_box_color (tuple[float]): the color of points which
                are in bbox3d. Default: None.
        """
        if bbox_color is None:
            bbox_color = self.bbox_color
        if points_in_box_color is None:
            points_in_box_color = self.points_in_box_color
        _draw_bboxes(bbox3d, self.o3d_visualizer, self.points_colors, self.pcd,
                     bbox_color, points_in_box_color, self.rot_axis,
                     self.center_mode, self.mode)

    def add_seg_mask(self, seg_mask_colors):
        """Add segmentation mask to visualizer via per-point colorization.

        Args:
            seg_mask_colors (numpy.array, shape=[N, 6]):
                The segmentation mask whose first 3 dims are point coordinates
                and last 3 dims are converted colors.
        """
        # we can't draw the colors on existing points
        # in case gt and pred mask would overlap
        # instead we set a large offset along x-axis for each seg mask
        self.seg_num += 1
        offset = (np.array(self.pcd.points).max(0) -
                  np.array(self.pcd.points).min(0))[0] * 1.2 * self.seg_num
        mesh_frame = geometry.TriangleMesh.create_coordinate_frame(
            size=1, origin=[offset, 0, 0])  # create coordinate frame for seg
        self.o3d_visualizer.add_geometry(mesh_frame)
        seg_points = copy.deepcopy(seg_mask_colors)
        seg_points[:, 0] += offset
        _draw_points(
            seg_points, self.o3d_visualizer, self.points_size, mode='xyzrgb')

    def show(self, save_path=None):
        """Visualize the points cloud.

        Args:
            save_path (str, optional): path to save image. Default: None.
        """

        self.o3d_visualizer.run()
        # self.o3d_visualizer.close()
        # self.o3d_visualizer.clear_geometries()

        if save_path is not None:
            self.o3d_visualizer.capture_screen_image(save_path)

        self.o3d_visualizer.destroy_window()
        return

# def update():
#      self.o3d_visualizer.clear_geometries()

# def fun (self.o3d_visualizer)
#     self.o3d_visualizer.run()
测试脚本
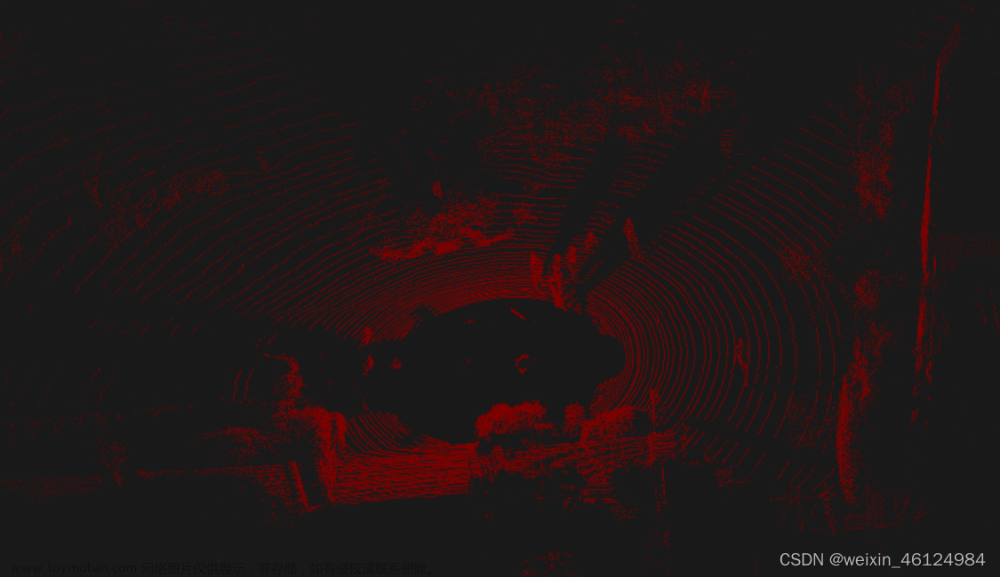
内容:test_lcm.py是lcm通信的lisenner脚本,目的是接受lcm发送过来的点云数据和3D框检测结果,然后调用open3d库实时显示点云和3D框。
test_lcm.py
import numpy as np
import show_result

import lcm
from exlcm import results_pcd_t
import open3d as o3d
from open3d_vis import Visualizer
from open3d import geometry
def read_pcd(filepath):
    lidar = []
    lidars = []
    with open(filepath,'r') as f:
        line = f.readline().strip()
        while line:
            linestr = line.split(" ")
            if len(linestr) == 4:
                linestr_convert = list(map(float, linestr))
                lidar.append(linestr_convert)
                lidars.extend(linestr_convert)
            line = f.readline().strip()
    return np.array(lidar, dtype=np.float32)

def my_handler(channel, data):
    msg = results_pcd_t.decode(data)
    pcd_data = np.array(list(msg.ranges)).reshape(-1,4)
    # filepath = "/home/nvidia/85.pcd"
    # pcd_data = read_pcd(filepath)
    # print(pcd_data)
    # print(type(pcd_data))
    # pred_bboxes = np.array([[0,0,0,8,4,2,0.4]], dtype=np.float32)
    pred_bboxes = np.array(list(msg.results)).reshape(msg.dims[0],msg.dims[1])
    print(pred_bboxes)
    # show_result.show_result(pcd_data,pred_bboxes = pred_bboxes,show=True)

    mode='xyz'
    points = pcd_data.copy()
    if mode == 'xyz':
        pointcloud.points = o3d.utility.Vector3dVector(points[:, :3])
    elif mode == 'xyzrgb':
        pointcloud.points = o3d.utility.Vector3dVector(points[:, :3])

    else:
        raise NotImplementedError
    vis.o3d_visualizer.add_geometry(pointcloud,reset_bounding_box=False)

    bbox3d = pred_bboxes.copy()
    bbox_color=(0, 1, 0)
    center_mode='lidar_bottom'
    rot_axis=2
    for i in range(len(bbox3d)):
        center = bbox3d[i, 0:3]
        dim = bbox3d[i, 3:6]
        yaw = np.zeros(3)
        yaw[rot_axis] = bbox3d[i, 6]
        if bbox3d[i, 6] < 0.6:
            continue
        rot_mat = geometry.get_rotation_matrix_from_xyz(yaw)

        if center_mode == 'lidar_bottom':
            center[rot_axis] += dim[
                rot_axis] / 2  # bottom center to gravity center
        elif center_mode == 'camera_bottom':
            center[rot_axis] -= dim[
                rot_axis] / 2  # bottom center to gravity center
        box3d = geometry.OrientedBoundingBox(center, rot_mat, dim)

        line_set = geometry.LineSet.create_from_oriented_bounding_box(box3d)
        line_set.paint_uniform_color(bbox_color)
        # draw bboxes on visualizer
        vis.o3d_visualizer.add_geometry(line_set,reset_bounding_box=False)


    global to_reset
    if to_reset:
        vis.o3d_visualizer.reset_view_point(True)
        to_reset = False
    vis.o3d_visualizer.poll_events()
    vis.o3d_visualizer.update_renderer()
    # vis.o3d_visualizer.run()
    vis.o3d_visualizer.clear_geometries()


    print("show result end ")


if __name__ == "__main__":
    lc = lcm.LCM("udpm://239.255.76.67:7668?ttl=1")
    subscription = lc.subscribe("RESULT", my_handler)
    vis = Visualizer()
    pointcloud = geometry.PointCloud()
    vis.o3d_visualizer.add_geometry(pointcloud)
    vis.o3d_visualizer.get_render_option().point_size = 2  # set points size
    to_reset = True
    try:
        while True:
            lc.handle()
    except KeyboardInterrupt:
        pass

    lc.unsubscribe(subscription)

    # filepath = "/home/nvidia/85.pcd"
    # pcd_data = read_pcd(filepath)
    # print(pcd_data)
    # print(type(pcd_data))
    # pred_bboxes = np.array([[0,0,0,8,4,2,0.4]], dtype=np.float32)
    # show_result.show_result(pcd_data,pred_bboxes = pred_bboxes,show=True)
send-message.py
import lcm
import time

from exlcm import results_pcd_t

lc = lcm.LCM("udpm://239.255.76.67:7668?ttl=1")

msg = results_pcd_t()
msg.dims[0] = 2
msg.dims[1] = 7
msg.total_nums = 14
msg.num_ranges = 16
msg.ranges = range(16)
msg.results = range(msg.total_nums)

while True:
    lc.publish("RESULT", msg.encode())
附录:
Open3D实时点云显示
前言
一般情况我们通过open3d中的draw_geometries()进行点云可视化,但这个函数会锁定一个进程直到可视化的窗口被关闭,才会继续渲染下一帧点云图像,无法做到点云持续的动态显示。本文介绍了一个自定义渲染循环的教程。
代码文章来源:https://www.toymoban.com/news/detail-484740.html
# -*- coding: utf-8 -*-
# @Time : 2022/10/25 16:22
# @Author : JulyLi
# @File : inno_sdk.py

import open3d as o3d
import numpy as np
import queue
import threading
from os import path


def visualize_pointscloud(show_q):
    vis = o3d.visualization.Visualizer()
    vis.create_window(width=800, height=600)
    pointcloud = o3d.geometry.PointCloud()
    to_reset = True
    vis.add_geometry(pointcloud)

    while True:
        try:
            pcd = show_q.get()

            pcd = np.asarray(pcd.points).reshape((-1, 3))
            pointcloud.points = o3d.utility.Vector3dVector(pcd)
            # vis.update_geometry()
            # 注意,如果使用的是open3d 0.8.0以后的版本,这句话应该改为下面格式
            vis.update_geometry(pointcloud)
            if to_reset:
                vis.reset_view_point(True)
                to_reset = False
            vis.poll_events()
            vis.update_renderer()
        except:
            continue


if __name__ == '__main__':

    show_q = queue.Queue(1)
    visual = threading.Thread(target=visualize_pointscloud, args=(show_q,))
    visual.start()

    input_dir = r"D:\Bvision\PCL\9818"
    frame = 0
    while True:
        input_name = path.join(input_dir, str(frame)+".pcd")
        print(input_name)
        # 获取雷达数据
        pcd = o3d.io.read_point_cloud(input_name)

        if show_q.full():
            show_q.get()
        show_q.put(pcd)
        frame += 1  # 迭代读取下一张图片
        frame %= 98  # 由于文件夹中最多只有98图片,超出了,又会回到0,循环
总结
这里整体思想是按名称读取文件然后送入队列中,使用多线程进行点云显示,当文件读完之后,重新开始读取。
读者可以根据自己的数据情况修改,已完成实时点云显示。文章来源地址https://www.toymoban.com/news/detail-484740.html
到了这里,关于open3d实时显示点云和3D框的文章就介绍完了。如果您还想了解更多内容,请在右上角搜索TOY模板网以前的文章或继续浏览下面的相关文章,希望大家以后多多支持TOY模板网!