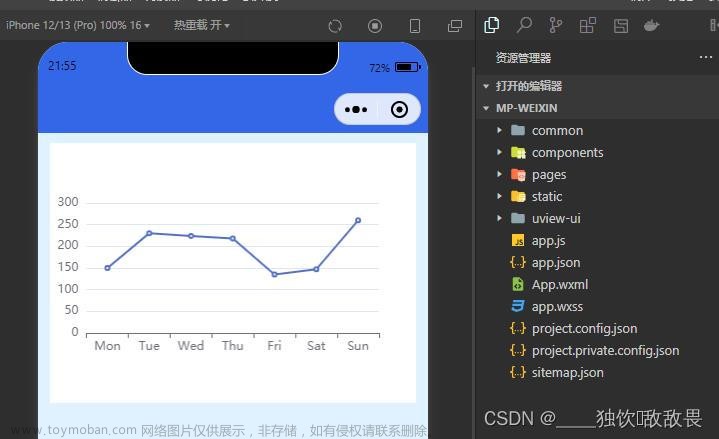
UNIAPP微信小程序使用Echarts
1. 前言
最近要在uniapp做的小程序中使用echarts,网上搜了很多教程都很麻烦,这里提供一种简便快捷CV方案。
先说下图表选型的问题,如果你只用于微信小程序,可以使用本方案,Echarts丰富多样的图表和广大的开源图库都已使用。如果要考虑兼容性问题,比如兼容支付宝小程序、APP、百度小程序……这里推荐使用uchart。缺点就是图表样式没有Echarts丰富。
2. 下载EchartsForWx插件
需要首先确保本机安装了Hbuilder
- 打开插件市场的**echarts-for-wx**插件。点击使用Hbuilder导入插件。

- 导入插件后,在项目目录会有一个js_sdk的文件夹生成。复制js_sdk下的uni-ec-canvas到根目录的components目录。
3. 自定义Echarts组件
在根目录的components文件夹下此时已经有了一个uni-ec-canvas的组件。我们这里新建一个pieChart的组件。
组件内容如下文章来源:https://www.toymoban.com/news/detail-485984.html
<template>
	<view>
		<uni-ec-canvas class="uni-ec-canvas" id="uni-ec-canvas" ref="canvas" canvas-id="uni-ec-canvas" :ec="ec">
		</uni-ec-canvas>
	</view>
</template>

<script>
	import uniEcCanvas from '@/components/uni-ec-canvas/uni-ec-canvas.vue'
	import * as echarts from '@/components/uni-ec-canvas/echarts'
	let chart = null
	export default {
		components: {
			uniEcCanvas
		},
		props: {
			abnormal: {
				type: Number,
				// 定义是否必须传
				required: true,
				// 定义默认值
				default: 0
			},
			absence: {
				type: Number,
				// 定义是否必须传
				required: true,
				// 定义默认值
				default: 0
			},
		},
		data() {
			return {
				ec: {
					//是否懒加载
					lazyLoad: true
				},
			}
		},
		methods: {
			initChart(canvas, width, height, canvasDpr) {
				chart = echarts.init(canvas, null, {
					width: width,
					height: height,
					devicePixelRatio: canvasDpr
				})
				canvas.setChart(chart)
				var data=[{value:this.abnormal, name:'正常',"itemStyle":{"normal":{"color":"#00CCB8"}}},
					{value:this.absence, name:'异常',"itemStyle":{"normal":{"color":"#FFCB96"}}}];
				var dataName = data.reduce((per,cur,i)=>{per[i]=cur.name;return per},[]);
				var a=0;
				for(var i=0; i<data.length; i++)
				{
					a+=data[i].value;
				}
				data.push({value:a, name:'__other', itemStyle:{normal:{color:'rgba(0,0,0,0)'}}});
				let option = {
					legend: {
						orient: "horizontal",//图例的布局,水平布局、垂直布局
						icon:'circle',
						bottom:50,
						textStyle: {//图例字体样式
							color: "#00CCB8",
							fontSize: 15,
							fontFamily: "微软雅黑"
						},
						data:dataName,
						formatter: e =>{
							let val=0;
							data.forEach(el => {
								if(e == el.name) val = el.value
							});
							return `${e}${val}天`
						}
					},
					series : [
						{
							name: '上下班统计',
							type: 'pie',
							startAngle:-180,
							radius : '95%',
							center: ['50%', '60%'],
							data:data,
							itemStyle: {
								borderRadius:0,
								borderColor:'#fff',
								borderWidth:5
							},

							label: {
								normal: {
									show: false,
								},
							},
							labelLine: {
								normal: {
									show: false
								}
							},
						}
					]
				};
				chart.setOption(option)
				return chart
			},
		},
		mounted() {
			this.$refs.canvas.init(this.initChart)
		}
	}
</script>
<style>
	.uni-ec-canvas {
		width: 100%;
		height: 500rpx;
		display: block;
		margin-top: 30rpx;
	}
</style>
4. 使用组件
<template>
	<view>
		<pie-chart :abnormal="abnormal" :absence="absence"></pie-chart>
	</view>
</template>

<script>
	import pieChart from '@/components/pieChart/index'
	let chart = null
	export default {
		components: {
			pieChart
		},
		data() {
			return {
				abnormal:10,
				absence:19,
			}
		},
	}
</script>
5. 效果图
 文章来源地址https://www.toymoban.com/news/detail-485984.html
6. Echarts各式各样的定制化图表
- Made A Pie https://madeapie.com 复刻Make A Pie
- Echarts社区makeapie https://www.makeapie.cn/echarts 复刻Make A Pie
- MCChart http://echarts.zhangmuchen.top/#/index
- PPChart http://ppchart.com/
- ISQQW https://www.isqqw.com/homepage
- chartsdev http://chartsdev.com/ 复刻Make A Pie
到了这里,关于UNIAPP微信小程序使用Echarts的文章就介绍完了。如果您还想了解更多内容,请在右上角搜索TOY模板网以前的文章或继续浏览下面的相关文章,希望大家以后多多支持TOY模板网!


