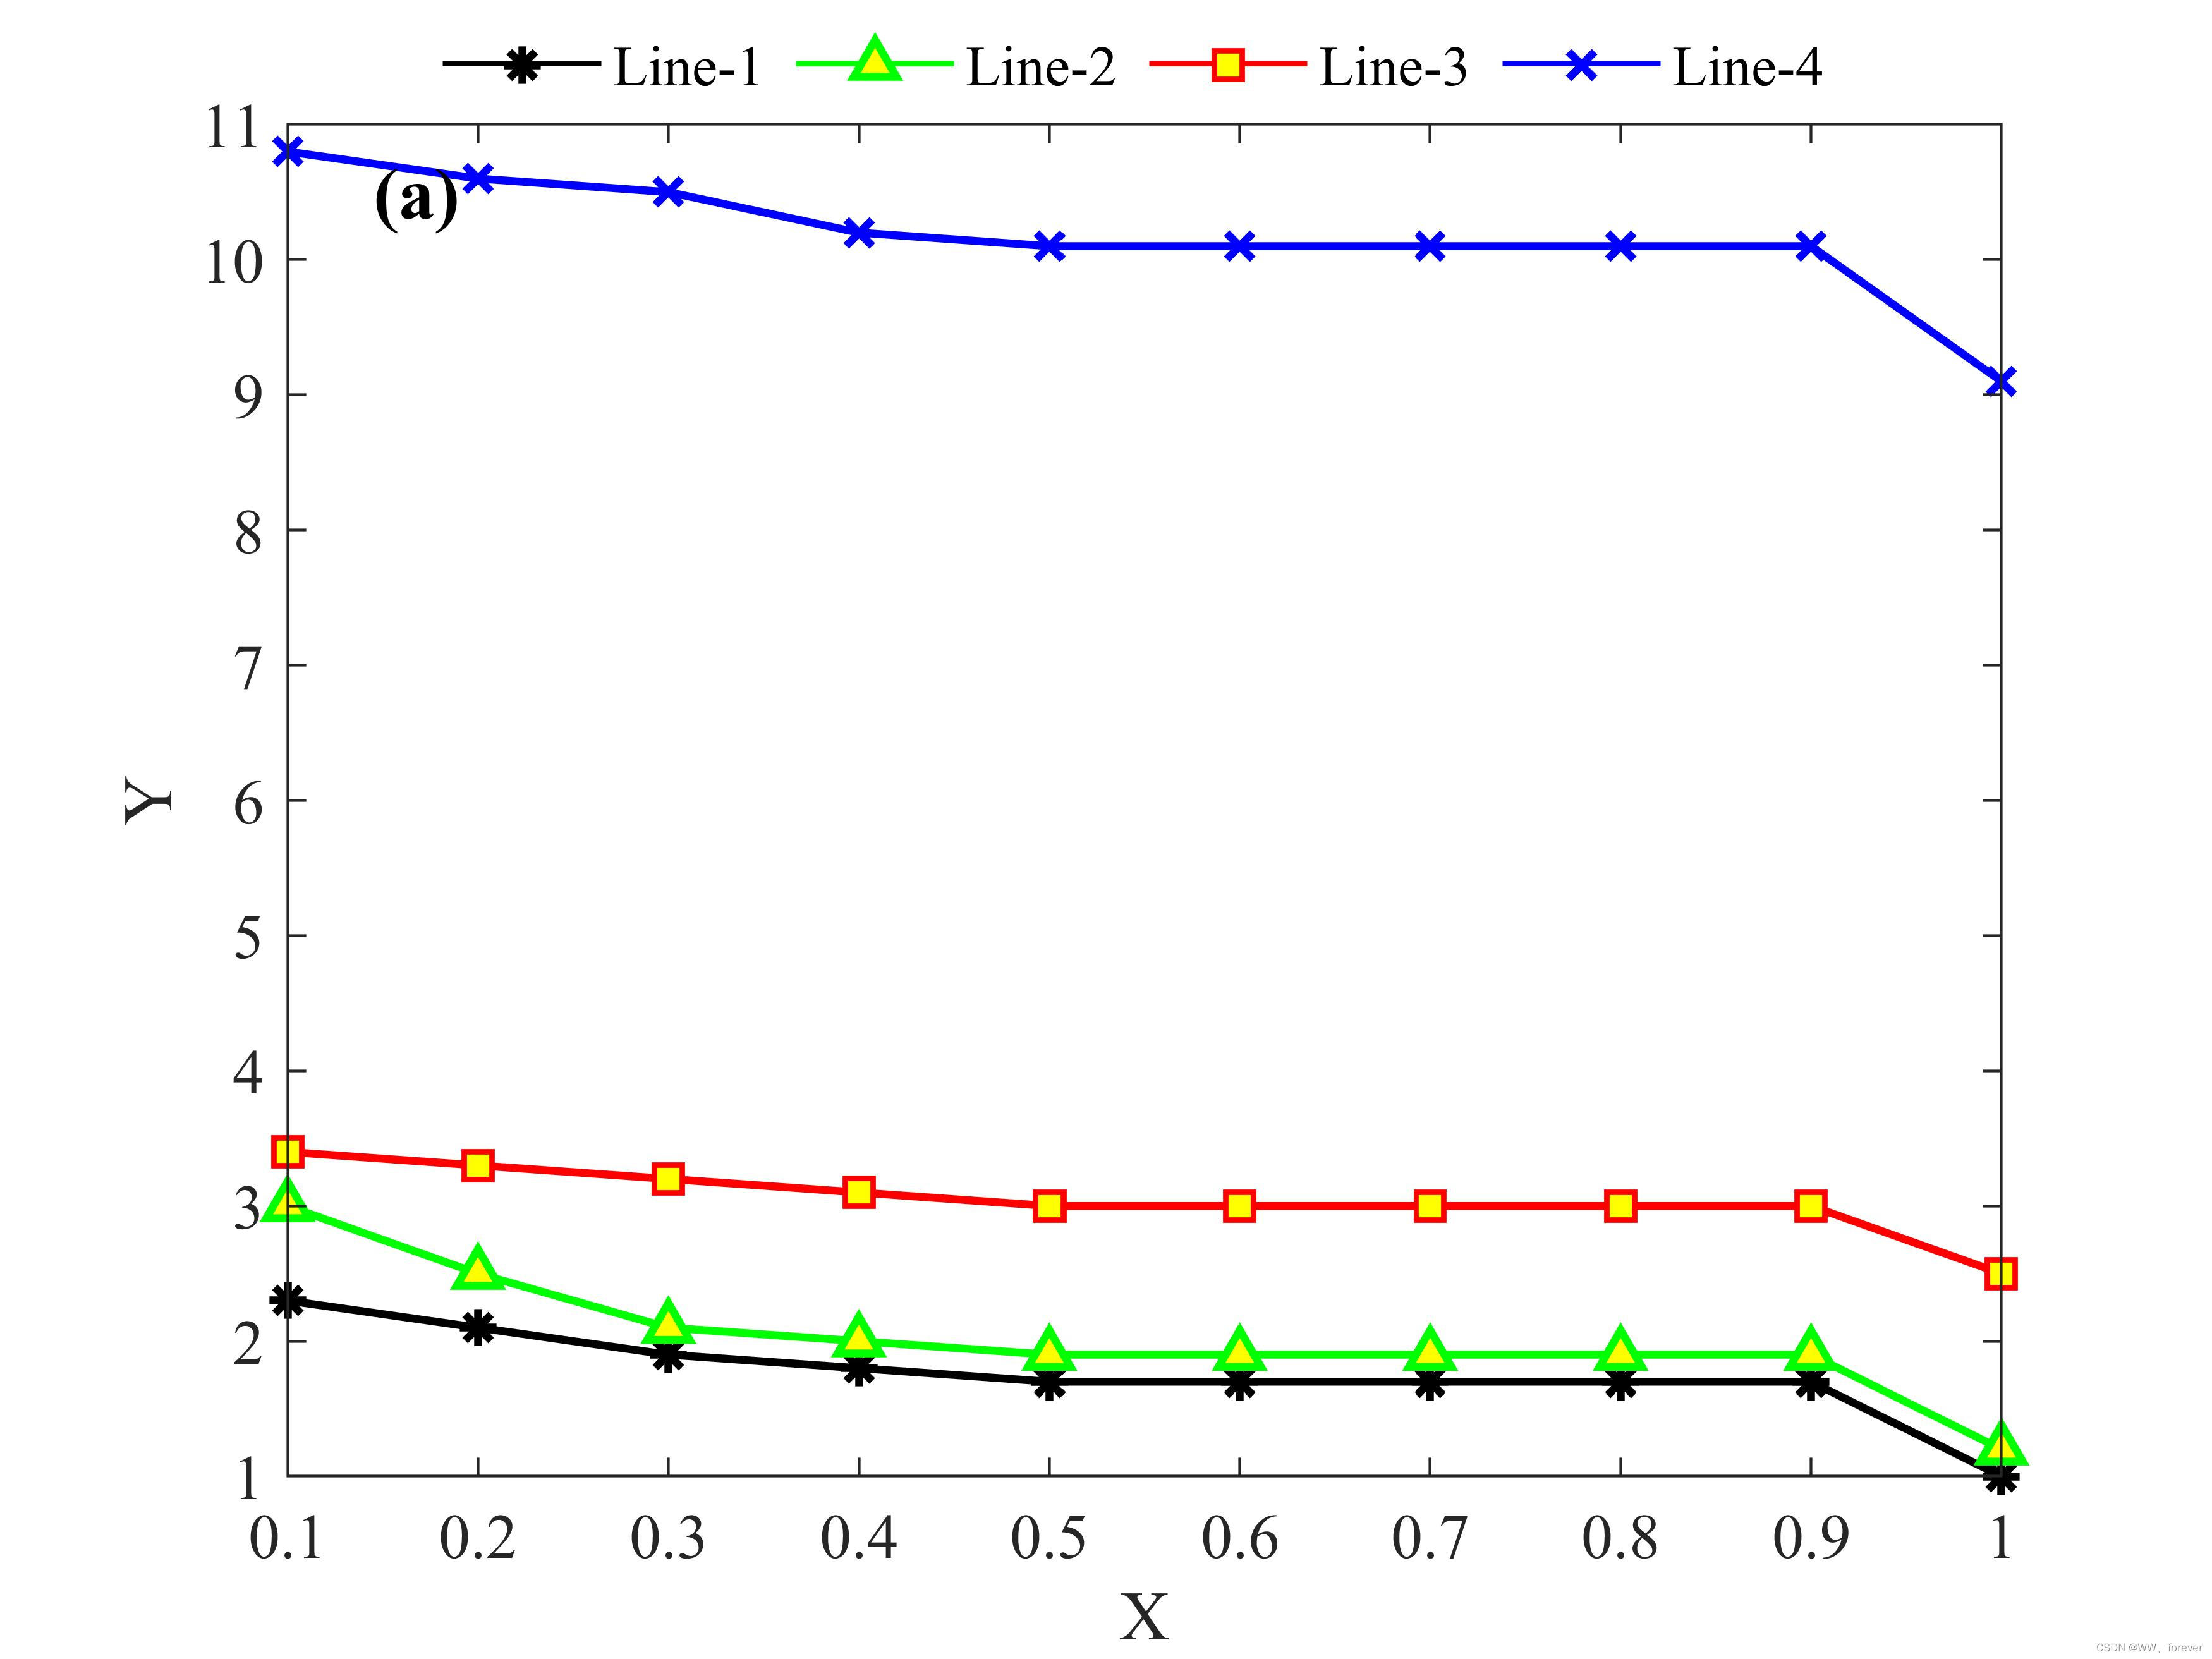
1 分组绘制柱状图
1.1 案例1:常规分组柱状图
绘制分组数据,并对数据格式和边框等进行设置,成图如下所示:
MATLAB绘制代码如下:
clc
close all
clear
%% 导入数据
pathFigure= '.\Figures\' ;
Name = ["生活","生态","工业","农业","汇总"];
xLables = ['Ⅰ' ; 'Ⅱ'; 'Ⅲ'];
mycolor = [53,42,134;
          21,132,212;
          55,184,156;
          215,186,84;
          247,250,13]./255;

x = [1 2 3];
XX = [0	0	0	3.92	2.78
0	0	0	6.63	4.2
0.78	8.37	9.98	22.15	15.46];

figure(1);
hold on;
box on;
h = bar(  XX ,'FaceColor','flat');
for k = 1:size(XX,2)
    h(k).FaceColor = mycolor(k,:);
end
set(gca,'XTick', x , 'XTickLabel',xLables);
set(gca,'FontSize',12,'Fontname', 'Times New Roman');
xlabel("情景",'FontName','宋体','FontSize',14,'Fontweight','bold');                          % 后续调整坐标标题
ylabel("\fontname{宋体}\fontsize{15}缺水率(\fontname{Times New Roman}\fontsize{15}%\fontname{宋体}\fontsize{15})",'FontSize',14,'Fontweight','bold');                          % 后续调整坐标标题
hl = legend( Name );
set(hl,'Box','off','location','NorthWest','NumColumns',1,'FontSize',12,'FontName','宋体');
ax1 = gca;
ax1.FontSize = 12;
ax1.LineWidth = 1;
set(gca,'Layer','top');

str= strcat(pathFigure, "Figure1", '.tiff');
print(gcf, '-dtiff', '-r600', str);
2 绘制多组柱状图并修改文字颜色一致

图源:J2022-Observed decrease in light precipitation in part due to urbanization-Scientific Reports
2.1 案例
3 绘制双轴-倒立柱状图
成图如下:
MATLAB代码如下:
clc
close all
clear
%% 导入数据
pathFigure= '.\Figures\' ;

X = randn(40,1);
Ymax = 50;
Y = Ymax*randn(40,1);

%% 开始绘图
figure(1)
hold on;box on;grid off;
h(3) = area( X,'FaceColor', [0.5529,0.7137,0.8039] ,'LineStyle','none');
[AX,h(1),h(2)] = plotyy( 1:length(X), X, 1:length(X) , Y, 'plot','bar');              % 画双轴,AX(1)左轴,AX(2)右轴,H为曲线本身
set(AX(2),'YDir','reverse','Ylim',[0, Ymax*3 ],'YTick',[0:20:Ymax*2],'FontSize',12,'Fontname', 'Times New Roman');                    % 设置右边轴为倒立
set(gca,'box','off','Ytick',[])
set(AX(1),'YLim',[min(X)*1.5,1.5*max(X)],'YTick',[floor(min(X)*1.5):1:ceil(1.5*max(X)) ],'Fontsize',10,'YColor','k');
%设置坐标轴的标题
h(5) = plot( zeros( length(X) ,1) ,'k-','linewidth',0.75);
set(get(AX(1),'Xlabel'),'String','XLabel','Fontname', 'Times New Roman');
set(get(AX(1),'Ylabel'),'String','YLabel1','Fontname', 'Times New Roman');
set(get(AX(2),'Ylabel'),'string','YLabel2','LineStyle','none','Fontname', 'Times New Roman');
set(gca,'Layer','top','FontSize',12,'Fontname', 'Times New Roman');

str= strcat(pathFigure, "Figure 1", '.jpg');
print(gcf, '-djpeg', '-r600', str);
4 绘制区间位置柱状图
区间范围柱状图是柱状图的一种,能够更加清晰地展示各类目数据区间范围分布的差异。支持通过获取数据的最小值和最大值之间的范围,展示不同类目下柱图的数据样式。 如下图所示:
图源:J2022-Amplification of non-stationary drought to heatwave duration and intensity in eastern China Spatiotemporal pattern and causes文章来源:https://www.toymoban.com/news/detail-492164.html
5 堆积柱状图
成果图如下:
相关MATLAB绘图代码如下:文章来源地址https://www.toymoban.com/news/detail-492164.html
%% 图形绘制

figure(1);
hold on;
box on;
h = bar(  Data'*100,'stacked' ,'FaceColor','flat');
set(gca,'Layer','top','FontSize',12,'Fontname', 'Times New Roman');
set(gca,'YTick', [0:20:105] , 'YTickLabel', [0:20:100] ,'Fontname', 'Times New Roman');
set(gca,'XTick', [1.5:2:6] , 'XTickLabel', BasinName);
xlabel("流域",'FontName','宋体','FontSize',14,'Fontweight','bold');                          % 后续调整坐标标题
ylabel("\fontname{宋体}贡献率\fontname{Times New Roman}/%",'FontSize',14,'Fontweight','bold');                          % 后续调整坐标标题
hl = legend( Name );
set(hl,'Box','off','location','NorthOutside','NumColumns',6,'FontSize',10,'FontName','Times New Roman');
set(gca,'Layer','top');

str= strcat(pathFigure, "Figure1", '.tiff');
print(gcf, '-dtiff', '-r600', str);
参考
到了这里,关于【MATLAB基础绘图第7棒】绘制各式柱状图的文章就介绍完了。如果您还想了解更多内容,请在右上角搜索TOY模板网以前的文章或继续浏览下面的相关文章,希望大家以后多多支持TOY模板网!


