1. 处理word模板
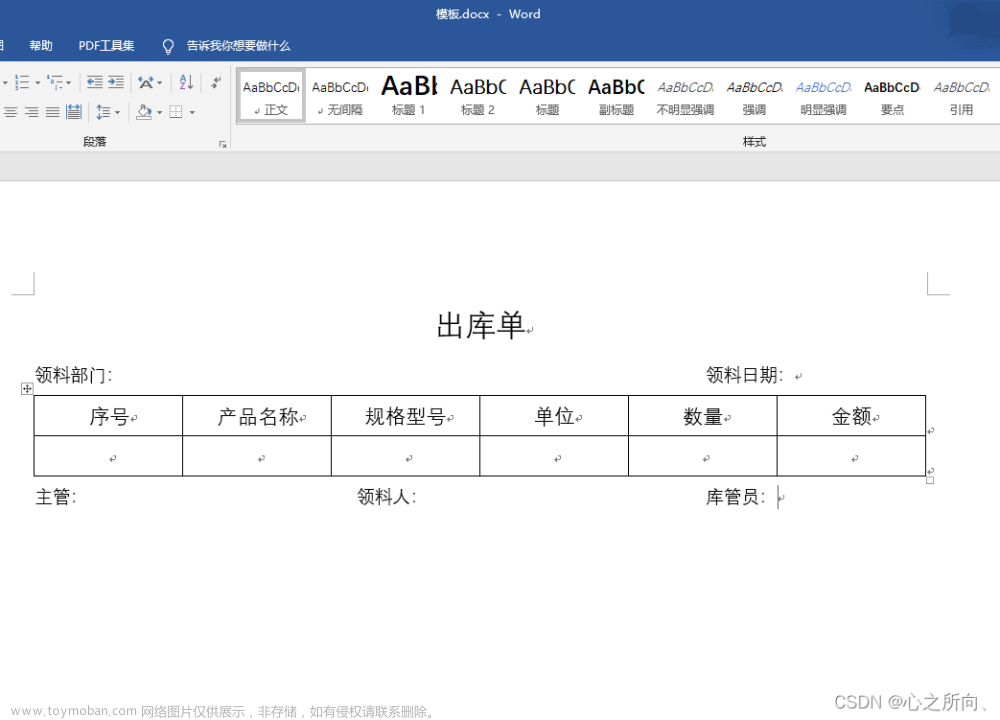
1.1 定义word模版

1.2 定义完我们的模板之后,我们要将文档保存为xml的格式
定义完我们的模板之后,我们要将文档保存为xml的格式

1.3 xml格式化
生成的xml格式看起来比较乱,没有层次感, 所以需要格式化一下
格式化

1.4 修改xml
基础信息的定义
基础信息的定义只要保证我们转化成的xml文件中的${name}等格式没错误即可

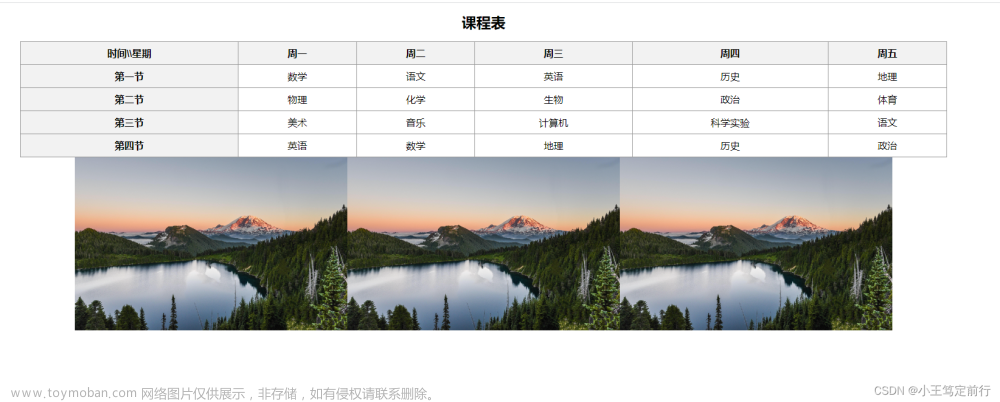
表格的定义
遍历实现,表格的数据填充
在xml文件中我们的 <w:tbl> 代表是我们的表格 ,<w:tr> 代表的是我们的行 ,<w:tc> 代表我们的列
我们要想使用表格的方式,肯定大部分是要使用我们的list集合进行数据填充的,我们可以通过下面的方式进行遍历填充数据
我们在表格的表头下的<w:tr>上添加
<#list TestList as item>

</#list>

图片的定义
首先我们要在指定位置添加一个图片,我们保存为xml文件后,我们的图片信心会变为base64转码的字符串,将这部分进行删除,替换为${images},所以我们进行填充时也要是base64转码后的数据

修改xml文件为ftl文件
最后将我们的文件修改为 .ftl 格式的文件复制到我们 templates文件夹下

2. 生成word文档
2.1 引入依赖
    <dependency>
        <groupId>org.freemarker</groupId>
        <artifactId>freemarker</artifactId>
        <version>2.3.30</version>
    </dependency>
2.2 代码实现
定义我们要填充的数据
  public Map<String,Object> dataMap() throws IOException {
        //获取基础数据
        Map<String , Object> map = new HashMap<>();
        map.put("name","qtt");
        map.put("age","25");

        //获取表格数据
        List<Map<String,Object>> bookList = new ArrayList<>();
        for (int i = 0; i < 5; i++) {
            Map<String, Object> map1 = new HashMap<>();
            map1.put("month",i);
            map1.put("income", i);
            map1.put("expense", i +100);
            bookList.add(map1);
        }
        map.put("bookList",bookList);

        //获取图片流且进行base64转码
        File file = new File("C:\\Users\\Administrator\\Desktop\\teacher\\01.jpg");
        FileInputStream fileInputStream = new FileInputStream(file);
        byte[] bytes = new byte[fileInputStream.available()];
        fileInputStream.read(bytes);
        BASE64Encoder base64Encoder = new BASE64Encoder();
        String encode = base64Encoder.encode(bytes);
        map.put("images",encode);
        //关闭流
        fileInputStream.close();

        return map;
    }
定义我们我们的填充方法
public void insertWord() throws IOException, TemplateException {
      //定义我们的编码方式
      Configuration configuration = new Configuration();
      configuration.setDefaultEncoding("UTF-8");

      //指定我们word的目录
      configuration.setDirectoryForTemplateLoading(new File("src/main/resources/templates"));

      //指定我们要使用的word模板.ftl
      Template template = configuration.getTemplate("testModel.ftl", "UTF-8");

      //指定输出流到的位置
      BufferedWriter bufferedWriter = new BufferedWriter(new OutputStreamWriter(new FileOutputStream("E:/222/demo.doc"), "UTF-8"));

      //执行填充输出
      template.process(this.dataMap(),bufferedWriter);

      //关闭io流
      bufferedWriter.flush();
      bufferedWriter.close();
  }
我们还可以直接定义为下载,不用使用输出流指定下载地址,直接通过下载的方式指定地址
	@GetMapping("/upload")
   public void upload(HttpServletResponse response){
       try {
           //定义我们的编码方式
           Configuration configuration = new Configuration();
           configuration.setDefaultEncoding("UTF-8");
           //指定我们word的目录
           configuration.setDirectoryForTemplateLoading(new File("src/main/resources/templates"));
           //指定我们要使用的word模板.ftl
           Template template = configuration.getTemplate("testModel.ftl", "UTF-8");

           //返回word文档
           SimpleDateFormat simpleDateFormat = new SimpleDateFormat("yyyyMMddHHmmss");
           String format = simpleDateFormat.format(new Date());
           String fileName = URLEncoder.encode("接口文档" + format, "UTF-8");
           response.setCharacterEncoding("UTF-8");
           //请求头定义为下载
           response.setHeader("Content-Disposition","attachment;filename="+fileName+".doc");

           //获取apiDoc所需要的数据
           Map<String, Object> map = dataMap();

           //渲染模板
           template.process(map, response.getWriter());
           //response的Writer不需要我们手动关,tomcat会帮我们关的
       } catch (Exception e) {
           log.error("导出word异常:", e);
       }
   }
注意:
1.优为注意:freemarker是不支持 null 的,所以我们的数据要么全部附上值,要么给为空的值设置为 " " ,否则会报错
2.我们在定义表格l遍历填充的时候,一定要注意传入的表格字段类型是list,不能是map,否则会报错
3. java后台生成柱状图图片并存到本地
3.1 引入依赖
<!-- Hutool工具包 -->
<dependency>
    <groupId>cn.hutool</groupId>
    <artifactId>hutool-all</artifactId>
    <version>5.6.2</version>
</dependency>
<!-- JFreeChart图表库 -->
<dependency>
    <groupId>org.jfree</groupId>
    <artifactId>jfreechart</artifactId>
    <version>1.5.3</version>
</dependency>
3.2 系统字体
复制一下, 粘贴到项目中

3.3 默认字体位置

3.4 代码
3.4.1 JFreeChart工具类
package com.util;

import cn.hutool.core.util.StrUtil;
import org.jfree.chart.*;
import org.jfree.chart.axis.ValueAxis;
import org.jfree.chart.labels.*;
import org.jfree.chart.plot.*;
import org.jfree.chart.renderer.category.*;
import org.jfree.chart.renderer.xy.XYLineAndShapeRenderer;
import org.jfree.chart.ui.*;
import org.jfree.data.category.DefaultCategoryDataset;
import org.jfree.data.general.DefaultPieDataset;
import org.springframework.core.io.ClassPathResource;

import java.awt.*;
import java.io.File;
import java.io.IOException;
import java.text.NumberFormat;
import java.util.List;

/**
 * JFreeChart工具类
 */
public class JFreeChartUtil {
    public static String NO_DATA_MSG = "数据加载失败";

    /**
     * 生成主题
     *
     * @param fontName 字体名称(默认为宋体)
     * @return
     */
    public static StandardChartTheme createChartTheme(String fontName) throws Exception {
        StandardChartTheme theme = new StandardChartTheme("unicode") {
            public void apply(JFreeChart chart) {
                chart.getRenderingHints().put(RenderingHints.KEY_TEXT_ANTIALIASING,
                        RenderingHints.VALUE_TEXT_ANTIALIAS_OFF);
                super.apply(chart);
            }
        };
        theme.setExtraLargeFont(getDefaultFont(Font.PLAIN, 20f));
        theme.setLargeFont(getDefaultFont(Font.PLAIN, 14f));
        theme.setRegularFont(getDefaultFont(Font.PLAIN, 12f));
        theme.setSmallFont(getDefaultFont(Font.PLAIN, 10f));
        return theme;
    }

    /**
     * 获取默认字体
     *
     * @param style
     * @param size  字体大小
     * @return
     * @throws Exception
     */
    public static Font getDefaultFont(int style, Float size) throws Exception {
        //获取宋体文件
        File defaultFontFile = new ClassPathResource("/font/simsun.ttc").getFile();
        Font defaultFont = Font.createFont(Font.TRUETYPE_FONT, defaultFontFile);
        defaultFont = defaultFont.deriveFont(style, size);
        return defaultFont;
    }

    /**
     * 创建饼图数据集合
     *
     * @param legendNameList 图例名称列表
     * @param dataList       数据列表
     * @return
     */
    public static DefaultPieDataset createDefaultPieDataset(List<String> legendNameList, List<Object> dataList) {
        DefaultPieDataset dataset = new DefaultPieDataset();
        //图例名称列表或数据列表为空
        if (legendNameList == null || legendNameList.size() <= 0 || dataList == null || dataList.size() <= 0) {
            return dataset;
        }
        for (int i = 0; i < legendNameList.size() && legendNameList.size() == dataList.size(); i++) {
            String value = dataList.get(i).toString();
            dataset.setValue(legendNameList.get(i), Double.valueOf(value));
        }
        return dataset;
    }

    /**
     * 设置饼状图渲染
     */
    public static void setPieRender(Plot plot) {
        plot.setNoDataMessage(NO_DATA_MSG);
        plot.setInsets(new RectangleInsets(10, 10, 5, 10));
        PiePlot piePlot = (PiePlot) plot;
        piePlot.setInsets(new RectangleInsets(0, 0, 0, 0));
        piePlot.setCircular(true);// 圆形

        // 简单标签
        piePlot.setLabelGap(0.01);
        piePlot.setInteriorGap(0.05D);
        // 图例形状
        piePlot.setLegendItemShape(new Rectangle(10, 10));
        piePlot.setIgnoreNullValues(true);
        // 去掉标签背景色
        piePlot.setLabelBackgroundPaint(null);
        //去掉图表背景颜色
        piePlot.setBackgroundPaint(null);
        // 去掉阴影
        piePlot.setLabelShadowPaint(null);
        // 去掉边框
        piePlot.setLabelOutlinePaint(null);
        piePlot.setShadowPaint(null);
        // 显示标签数据
        piePlot.setLabelGenerator(new StandardPieSectionLabelGenerator("{0}:{2}"));
    }

    /**
     * 创建类别数据集合(柱形图、折线图)
     *
     * @param legendNameList 图例名称列表
     * @param xAxisNameList  x轴名称列表
     * @param dataList       数据列表
     * @return
     */
    public static DefaultCategoryDataset createDefaultCategoryDataset(List<String> legendNameList, List<String> xAxisNameList
            , List<List<Object>> dataList) {
        DefaultCategoryDataset dataset = new DefaultCategoryDataset();
        //图例名称列表、x轴名称列表或数据列表为空
        if (xAxisNameList == null || xAxisNameList.size() <= 0 || legendNameList == null || legendNameList.size() <= 0
                || dataList == null || dataList.size() <= 0) {
            return dataset;
        }
        for (int yAxisIndex = 0; yAxisIndex < legendNameList.size() && legendNameList.size() == dataList.size(); yAxisIndex++) {
            String legendName = legendNameList.get(yAxisIndex);
            List<Object> rowList = dataList.get(yAxisIndex);
            //该组数据不存在或该组数据总数不等于x轴数据数量
            if (rowList == null || rowList.size() != xAxisNameList.size()) {
                continue;
            }
            for (int xAxisIndex = 0; xAxisIndex < rowList.size(); xAxisIndex++) {
                String value = rowList.get(xAxisIndex).toString();
                dataset.setValue(Double.parseDouble(value), legendName, xAxisNameList.get(xAxisIndex));
            }
        }
        return dataset;
    }

    /**
     * 设置柱状图渲染
     *
     * @param plot
     * @param isShowDataLabels 显示数据值标记
     */
    public static void setBarRenderer(CategoryPlot plot, boolean isShowDataLabels) {
        plot.setNoDataMessage(NO_DATA_MSG);
        plot.setInsets(new RectangleInsets(10, 10, 5, 10));
        BarRenderer renderer = (BarRenderer) plot.getRenderer();
        // 设置柱子最大宽度
        renderer.setMaximumBarWidth(0.175);
        //设置图表背景颜色(透明)
        plot.setBackgroundPaint(null);
        //显示数据值标记
        if (isShowDataLabels) {
            renderer.setDefaultItemLabelsVisible(true);
        }
        renderer.setDefaultItemLabelGenerator(new StandardCategoryItemLabelGenerator());
        //注意:此句很关键,若无此句,那数字的显示会被覆盖,给人数字没有显示出来的问题
        renderer.setDefaultPositiveItemLabelPosition(new ItemLabelPosition(
                ItemLabelAnchor.OUTSIDE12, TextAnchor.BASELINE_CENTER));

        setXAixs(plot);
        setYAixs(plot);
    }

    /**
     * 设置折线图样式
     *
     * @param plot
     * @param isShowDataLabels 是否显示数据标签
     * @param isShapesVisible  是否显示数据点
     */
    public static void setLineRender(CategoryPlot plot, boolean isShowDataLabels, boolean isShapesVisible) {
        plot.setNoDataMessage(NO_DATA_MSG);
        plot.setInsets(new RectangleInsets(10, 10, 0, 10), false);
        LineAndShapeRenderer renderer = (LineAndShapeRenderer) plot.getRenderer();
        //设置图表背景颜色(透明)
        plot.setBackgroundPaint(null);
        renderer.setDefaultStroke(new BasicStroke(1.5F));
        //显示数据标签
        if (isShowDataLabels) {
            renderer.setDefaultItemLabelsVisible(true);
            renderer.setDefaultItemLabelGenerator(new StandardCategoryItemLabelGenerator(StandardCategoryItemLabelGenerator.DEFAULT_LABEL_FORMAT_STRING,
                    NumberFormat.getInstance()));
            // 位置
            renderer.setDefaultPositiveItemLabelPosition(new ItemLabelPosition(ItemLabelAnchor.OUTSIDE1, TextAnchor.BOTTOM_CENTER));
        }
        // 数据点绘制形状
        renderer.setDefaultShapesVisible(isShapesVisible);
        setXAixs(plot);
        setYAixs(plot);

    }

    /**
     * 设置散点图样式
     *
     * @param plot
     */
    public static void setScatterRender(XYPlot plot) {
        plot.setNoDataMessage(NO_DATA_MSG);
        plot.setInsets(new RectangleInsets(10, 10, 0, 10), false);
        //设置图表背景颜色(透明)
        plot.setBackgroundPaint(null);
        setXAixs(plot);
        setYAixs(plot);
    }

    /**
     * 设置类别图表(CategoryPlot) X坐标轴线条颜色和样式
     *
     * @param plot
     */
    public static void setXAixs(CategoryPlot plot) {
        Color lineColor = new Color(31, 121, 170);
        // X坐标轴颜色
        plot.getDomainAxis().setAxisLinePaint(lineColor);
        // X坐标轴标记|竖线颜色
        plot.getDomainAxis().setTickMarkPaint(lineColor);

    }

    /**
     * 设置图表(XYPlot) X坐标轴线条颜色和样式
     *
     * @param plot
     */
    public static void setXAixs(XYPlot plot) {
        Color lineColor = new Color(31, 121, 170);
        // X坐标轴颜色
        plot.getDomainAxis().setAxisLinePaint(lineColor);
        // X坐标轴标记|竖线颜色
        plot.getDomainAxis().setTickMarkPaint(lineColor);
        // x轴网格线条
        plot.setDomainGridlinePaint(new Color(192, 192, 192));
    }

    /**
     * 设置类别图表(CategoryPlot) Y坐标轴线条颜色和样式 同时防止数据无法显示
     *
     * @param plot
     */
    public static void setYAixs(CategoryPlot plot) {
        Color lineColor = new Color(192, 208, 224);
        ValueAxis axis = plot.getRangeAxis();
        // Y坐标轴颜色
        axis.setAxisLinePaint(lineColor);
        // Y坐标轴标记|竖线颜色
        axis.setTickMarkPaint(lineColor);
        // 隐藏Y刻度
        axis.setAxisLineVisible(false);
        axis.setTickMarksVisible(false);
        // Y轴网格线条
        plot.setRangeGridlinePaint(new Color(192, 192, 192));
        plot.setRangeGridlineStroke(new BasicStroke(1));
        // 设置顶部Y坐标轴间距,防止数据无法显示
        plot.getRangeAxis().setUpperMargin(0.1);
        // 设置底部Y坐标轴间距
        plot.getRangeAxis().setLowerMargin(0.1);

    }

    /**
     * 设置图表(XYPlot) Y坐标轴线条颜色和样式 同时防止数据无法显示
     *
     * @param plot
     */
    public static void setYAixs(XYPlot plot) {
        Color lineColor = new Color(192, 208, 224);
        ValueAxis axis = plot.getRangeAxis();
        // Y坐标轴颜色
        axis.setAxisLinePaint(lineColor);
        // Y坐标轴标记|竖线颜色
        axis.setTickMarkPaint(lineColor);
        // 隐藏Y刻度
        axis.setAxisLineVisible(false);
        axis.setTickMarksVisible(false);
        // Y轴网格线条
        plot.setRangeGridlinePaint(new Color(192, 192, 192));
        // 设置顶部Y坐标轴间距,防止数据无法显示
        plot.getRangeAxis().setUpperMargin(0.1);
        // 设置底部Y坐标轴间距
        plot.getRangeAxis().setLowerMargin(0.1);
    }

}
3.4.2 GenerateChartUtil图表生成工具类
package com.jfreechart;

import cn.hutool.core.collection.CollectionUtil;
import cn.hutool.core.util.StrUtil;
import org.jfree.chart.ChartFactory;
import org.jfree.chart.ChartUtils;
import org.jfree.chart.JFreeChart;
import org.jfree.chart.StandardChartTheme;
import org.jfree.chart.axis.CategoryAxis;
import org.jfree.chart.axis.CategoryLabelPositions;
import org.jfree.chart.axis.NumberAxis;
import org.jfree.chart.axis.ValueAxis;
import org.jfree.chart.block.BlockBorder;
import org.jfree.chart.labels.ItemLabelAnchor;
import org.jfree.chart.labels.ItemLabelPosition;
import org.jfree.chart.labels.StandardCategoryItemLabelGenerator;
import org.jfree.chart.plot.CategoryPlot;
import org.jfree.chart.plot.PiePlot3D;
import org.jfree.chart.renderer.category.CategoryItemRenderer;
import org.jfree.chart.ui.RectangleEdge;
import org.jfree.chart.ui.TextAnchor;
import org.jfree.chart.util.Rotation;
import org.jfree.data.general.DefaultPieDataset;
import org.jfree.data.xy.XYDataset;

import java.awt.*;
import java.io.ByteArrayOutputStream;
import java.io.IOException;
import java.io.OutputStream;
import java.text.DecimalFormat;
import java.text.NumberFormat;
import java.util.List;

/**
 * 图表生成工具类
 */
public class GenerateChartUtil {

    /**
     * 生成柱状图(返回JFreeChart)
     *
     * @param chartTitle     图表标题
     * @param legendNameList 图例名称列表
     * @param xAxisNameList  x轴名称列表
     * @param dataList       数据列表
     * @param theme          主题(null代表默认主题)
     * @param yAxisTitle     y轴标题
     * @param xAxisTitle     x轴标题
     * @param yAxisMinValue   y轴最小值(可以为空)
     * @param yAxisMaxValue   y轴最大值(可以为空)
     * @param legendColorList 图例背景颜色(可以为空)
     * @param barLabelVisible 是否显示柱体标签(可以为空)
     * @param barLabelFormat  柱体标签格式(可以为空)
     * @return
     */
    public static JFreeChart createBarChart(String chartTitle, List<String> legendNameList, List<String> xAxisNameList
            , List<List<Object>> dataList, StandardChartTheme theme, String yAxisTitle, String xAxisTitle, Double yAxisMinValue
            , Double yAxisMaxValue, List<Color> legendColorList, Boolean barLabelVisible, String barLabelFormat) {
        //设置主题,防止中文乱码
        theme = theme == null ? JFreeChartUtil.createChartTheme("") : theme;
        ChartFactory.setChartTheme(theme);
        //创建柱状图
        JFreeChart chart = ChartFactory.createBarChart(chartTitle, xAxisTitle, yAxisTitle
                , JFreeChartUtil.createDefaultCategoryDataset(legendNameList, xAxisNameList, dataList));
        // 设置抗锯齿,防止字体显示不清楚
        chart.setTextAntiAlias(false);
        // 对柱子进行渲染
        JFreeChartUtil.setBarRenderer(chart.getCategoryPlot(), true);CategoryPlot plot = (CategoryPlot) chart.getPlot();
        CategoryAxis categoryAxis = plot.getDomainAxis();
        // 最大换行数
        categoryAxis.setMaximumCategoryLabelLines(10);
        //y轴
        ValueAxis valueAxis = chart.getCategoryPlot().getRangeAxis();
        if (yAxisMinValue != null) {
            valueAxis.setLowerBound(yAxisMinValue);
        }
        if (yAxisMaxValue != null) {
            valueAxis.setUpperBound(yAxisMaxValue);
        }
        CategoryItemRenderer customBarRenderer = plot.getRenderer();
        //显示每个柱的数值
        if (barLabelVisible != null) {
            customBarRenderer.setDefaultItemLabelsVisible(barLabelVisible);
            //柱体数值格式
            if (StrUtil.isNotEmpty(barLabelFormat)) {
                customBarRenderer.setDefaultItemLabelGenerator(new StandardCategoryItemLabelGenerator(barLabelFormat, NumberFormat.getInstance()));
            }
        }
        //设置系列柱体背景颜色
        if (CollectionUtil.isNotEmpty(legendColorList)) {
            for (int i = 0; i < legendNameList.size() && i < legendColorList.size(); i++) {
                Color color = legendColorList.get(i);
                if (color == null) {
                    continue;
                }
                customBarRenderer.setSeriesPaint(i, color);
            }
        }
        // 设置标注无边框
        chart.getLegend().setFrame(new BlockBorder(Color.WHITE));
        // 标注位于上侧
        chart.getLegend().setPosition(RectangleEdge.TOP);
        return chart;
    }

    /**
     * 生成柱状图(返回outputStream)
     *
     * @param chartTitle     图表标题
     * @param legendNameList 图例名称列表
     * @param xAxisNameList  x轴名称列表
     * @param dataList       数据列表
     * @param theme          主题(null代表默认主题)
     * @param yAxisTitle     y轴标题
     * @param xAxisTitle     x轴标题
     * @param outputStream   输出流
     * @param width          宽度
     * @param height         高度
     * @param yAxisMinValue   y轴最小值(可以为空)
     * @param yAxisMaxValue   y轴最大值(可以为空)
     * @param legendColorList 图例背景颜色(可以为空)
     * @param barLabelVisible 是否显示柱体标签(可以为空)
     * @param barLabelFormat  柱体标签格式(可以为空)
     * @return
     */
    public static void createBarChart(OutputStream outputStream, String chartTitle, List<String> legendNameList, List<String> xAxisNameList
            , List<List<Object>> dataList, StandardChartTheme theme, String yAxisTitle, String xAxisTitle, int width, int height
            , Double yAxisMinValue, Double yAxisMaxValue, List<Color> legendColorList, Boolean barLabelVisible, String barLabelFormat) {
        JFreeChart chart = createBarChart(chartTitle, legendNameList, xAxisNameList, dataList, theme, yAxisTitle, xAxisTitle
                , yAxisMinValue, yAxisMaxValue, legendColorList, barLabelVisible, barLabelFormat);
        try {
            ChartUtils.writeChartAsJPEG(outputStream, 1.0f, chart, width, height, null);
        } catch (IOException e) {
            e.printStackTrace();
        }
    }

    /**
     * 生成柱状图(返回byte[])
     *
     * @param chartTitle     图表标题
     * @param legendNameList 图例名称列表
     * @param xAxisNameList  x轴名称列表
     * @param dataList       数据列表
     * @param theme          主题(null代表默认主题)
     * @param yAxisTitle     y轴标题
     * @param xAxisTitle     x轴标题
     * @param width          宽度
     * @param height         高度
     * @param yAxisMinValue   y轴最小值(可以为空)
     * @param yAxisMaxValue   y轴最大值(可以为空)
     * @param legendColorList 图例背景颜色(可以为空)
     * @param barLabelVisible 是否显示柱体标签(可以为空)
     * @param barLabelFormat  柱体标签格式(可以为空)
     * @return
     */
    public static byte[] createBarChart(String chartTitle, List<String> legendNameList, List<String> xAxisNameList
            , List<List<Object>> dataList, StandardChartTheme theme, String yAxisTitle, String xAxisTitle, int width, int height
            , Double yAxisMinValue , Double yAxisMaxValue, List<Color> legendColorList, Boolean barLabelVisible, String barLabelFormat) {
        ByteArrayOutputStream bas = new ByteArrayOutputStream();
        createBarChart(bas, chartTitle, legendNameList, xAxisNameList, dataList, theme, yAxisTitle, xAxisTitle, width, height
                , yAxisMinValue, yAxisMaxValue, legendColorList, barLabelVisible, barLabelFormat);
        byte[] byteArray = bas.toByteArray();
        return byteArray;
    }

    /**
     * 生成柱堆叠状图(返回JFreeChart)
     *
     * @param chartTitle     图表标题
     * @param legendNameList 图例名称列表
     * @param xAxisNameList  x轴名称列表
     * @param dataList       数据列表
     * @param theme          主题(null代表默认主题)
     * @param yAxisTitle     y轴标题
     * @param xAxisTitle     x轴标题
     * @return
     */
    public static JFreeChart createStackedBarChart(String chartTitle, List<String> legendNameList, List<String> xAxisNameList
            , List<List<Object>> dataList, StandardChartTheme theme, String yAxisTitle, String xAxisTitle) {
        //设置主题,防止中文乱码
        theme = theme == null ? JFreeChartUtil.createChartTheme("") : theme;
        ChartFactory.setChartTheme(theme);
        //创建堆叠柱状图
        JFreeChart chart = ChartFactory.createStackedBarChart(chartTitle, xAxisTitle, yAxisTitle
                , JFreeChartUtil.createDefaultCategoryDataset(legendNameList, xAxisNameList, dataList));
        // 设置抗锯齿,防止字体显示不清楚
        chart.setTextAntiAlias(false);
        // 对柱子进行渲染
        JFreeChartUtil.setBarRenderer(chart.getCategoryPlot(), true);
        // 设置标注无边框
        chart.getLegend().setFrame(new BlockBorder(Color.WHITE));
        // 标注位于上侧
        chart.getLegend().setPosition(RectangleEdge.TOP);
        return chart;
    }

    /**
     * 生成堆叠柱状图(返回outputStream)
     *
     * @param chartTitle     图表标题
     * @param legendNameList 图例名称列表
     * @param xAxisNameList  x轴名称列表
     * @param dataList       数据列表
     * @param theme          主题(null代表默认主题)
     * @param yAxisTitle     y轴标题
     * @param xAxisTitle     x轴标题
     * @param outputStream   输出流
     * @param width          宽度
     * @param height         高度
     * @return
     */
    public static void createStackedBarChart(OutputStream outputStream, String chartTitle, List<String> legendNameList, List<String> xAxisNameList
            , List<List<Object>> dataList, StandardChartTheme theme, String yAxisTitle, String xAxisTitle, int width, int height
    ) {
        JFreeChart chart = createStackedBarChart(chartTitle, legendNameList, xAxisNameList, dataList, theme, yAxisTitle, xAxisTitle);
        try {
            ChartUtils.writeChartAsJPEG(outputStream, 1.0f, chart, width, height, null);
        } catch (IOException e) {
            e.printStackTrace();
        }
    }

    /**
     * 生成堆叠柱状图(返回byte[])
     *
     * @param chartTitle     图表标题
     * @param legendNameList 图例名称列表
     * @param xAxisNameList  x轴名称列表
     * @param dataList       数据列表
     * @param theme          主题(null代表默认主题)
     * @param yAxisTitle     y轴标题
     * @param xAxisTitle     x轴标题
     * @param width          宽度
     * @param height         高度
     * @return
     */
    public static byte[] createStackedBarChart(String chartTitle, List<String> legendNameList, List<String> xAxisNameList
            , List<List<Object>> dataList, StandardChartTheme theme, String yAxisTitle, String xAxisTitle, int width, int height) {
        ByteArrayOutputStream bas = new ByteArrayOutputStream();
        createStackedBarChart(bas, chartTitle, legendNameList, xAxisNameList, dataList, theme, yAxisTitle, xAxisTitle, width, height);
        byte[] byteArray = bas.toByteArray();
        return byteArray;
    }

    /**
     * 生成折线图(返回JFreeChart)
     *
     * @param chartTitle     图表标题
     * @param legendNameList 图例名称列表
     * @param xAxisNameList  x轴名称列表
     * @param dataList       数据列表
     * @param theme          主题(null代表默认主题)
     * @param yAxisTitle     y轴标题
     * @param xAxisTitle     x轴标题
     * @return
     */
    public static JFreeChart createLineChart(String chartTitle, List<String> legendNameList, List<String> xAxisNameList
            , List<List<Object>> dataList, StandardChartTheme theme, String yAxisTitle, String xAxisTitle) {
        //设置主题,防止中文乱码
        theme = theme == null ? JFreeChartUtil.createChartTheme("") : theme;
        ChartFactory.setChartTheme(theme);
        //创建折线图
        JFreeChart chart = ChartFactory.createLineChart(chartTitle, xAxisTitle, yAxisTitle
                , JFreeChartUtil.createDefaultCategoryDataset(legendNameList, xAxisNameList, dataList));
        // 设置抗锯齿,防止字体显示不清楚
        chart.setTextAntiAlias(false);
        // 对折现进行渲染
        JFreeChartUtil.setLineRender(chart.getCategoryPlot(), true, true);
        // 设置标注无边框
        chart.getLegend().setFrame(new BlockBorder(Color.WHITE));
        // 标注位于上侧
        chart.getLegend().setPosition(RectangleEdge.TOP);
        return chart;
    }

    /**
     * 生成折线图(返回outputStream)
     *
     * @param chartTitle     图表标题
     * @param legendNameList 图例名称列表
     * @param xAxisNameList  x轴名称列表
     * @param dataList       数据列表
     * @param theme          主题(null代表默认主题)
     * @param yAxisTitle     y轴标题
     * @param xAxisTitle     x轴标题
     * @param outputStream   输出流
     * @param width          宽度
     * @param height         高度
     * @return
     */
    public static void createLineChart(OutputStream outputStream, String chartTitle, List<String> legendNameList, List<String> xAxisNameList
            , List<List<Object>> dataList, StandardChartTheme theme, String yAxisTitle, String xAxisTitle, int width, int height
    ) {
        JFreeChart chart = createLineChart(chartTitle, legendNameList, xAxisNameList, dataList, theme, yAxisTitle, xAxisTitle);
        try {
            ChartUtils.writeChartAsJPEG(outputStream, 1.0f, chart, width, height, null);
        } catch (IOException e) {
            e.printStackTrace();
        }
    }

    /**
     * 生成折线图(返回byte[])
     *
     * @param chartTitle     图表标题
     * @param legendNameList 图例名称列表
     * @param xAxisNameList  x轴名称列表
     * @param dataList       数据列表
     * @param theme          主题(null代表默认主题)
     * @param yAxisTitle     y轴标题
     * @param xAxisTitle     x轴标题
     * @param width          宽度
     * @param height         高度
     * @return
     */
    public static byte[] createLineChart(String chartTitle, List<String> legendNameList, List<String> xAxisNameList
            , List<List<Object>> dataList, StandardChartTheme theme, String yAxisTitle, String xAxisTitle, int width, int height) {
        ByteArrayOutputStream bas = new ByteArrayOutputStream();
        createLineChart(bas, chartTitle, legendNameList, xAxisNameList, dataList, theme, yAxisTitle, xAxisTitle, width, height);
        byte[] byteArray = bas.toByteArray();
        return byteArray;
    }

    /**
     * 生成散点图(返回JFreeChart)
     *
     * @param chartTitle 图表标题
     * @param dataset    数据集
     * @param theme      主题(null代表默认主题)
     * @param yAxisTitle y轴标题
     * @param xAxisTitle x轴标题
     * @return
     */
    public static JFreeChart createScatterPlot(String chartTitle
            , XYDataset dataset, StandardChartTheme theme, String yAxisTitle, String xAxisTitle) {
        //设置主题,防止中文乱码
        theme = theme == null ? JFreeChartUtil.createChartTheme("") : theme;
        ChartFactory.setChartTheme(theme);
        //创建散点图
        JFreeChart chart = ChartFactory.createScatterPlot(chartTitle, xAxisTitle, yAxisTitle
                , dataset);
        // 设置抗锯齿,防止字体显示不清楚
        chart.setTextAntiAlias(false);
        //散点图渲染
        JFreeChartUtil.setScatterRender(chart.getXYPlot());
        // 设置标注无边框
        chart.getLegend().setFrame(new BlockBorder(Color.WHITE));
        // 标注位于上侧
        chart.getLegend().setPosition(RectangleEdge.TOP);
        return chart;
    }

    /**
     * 生成散点图(返回outputStream)
     *
     * @param chartTitle   图表标题
     * @param dataset      数据集
     * @param theme        主题(null代表默认主题)
     * @param yAxisTitle   y轴标题
     * @param xAxisTitle   x轴标题
     * @param outputStream 输出流
     * @param width        宽度
     * @param height       高度
     * @return
     */
    public static void createScatterPlot(OutputStream outputStream, String chartTitle, XYDataset dataset, StandardChartTheme theme
            , String yAxisTitle, String xAxisTitle, int width, int height
    ) {
        JFreeChart chart = createScatterPlot(chartTitle, dataset, theme, yAxisTitle, xAxisTitle);
        try {
            ChartUtils.writeChartAsJPEG(outputStream, 1.0f, chart, width, height, null);
        } catch (IOException e) {
            e.printStackTrace();
        }
    }

    /**
     * 生成散点图(返回byte[])
     *
     * @param chartTitle 图表标题
     * @param dataset    数据集
     * @param theme      主题(null代表默认主题)
     * @param yAxisTitle y轴标题
     * @param xAxisTitle x轴标题
     * @param width      宽度
     * @param height     高度
     * @return
     */
    public static byte[] createScatterPlot(String chartTitle, XYDataset dataset, StandardChartTheme theme, String yAxisTitle
            , String xAxisTitle, int width, int height) {
        ByteArrayOutputStream bas = new ByteArrayOutputStream();
        createScatterPlot(bas, chartTitle, dataset, theme, yAxisTitle, xAxisTitle, width, height);
        byte[] byteArray = bas.toByteArray();
        return byteArray;
    }
}
3.4.3 chart图示列
3.4.3.1 饼图

3.4.3.2 3D饼图

3.4.3.3 柱状图调试代码一
/**
    * 柱状图
    *
    * @param response
    */
   @GetMapping("/barChart")
   public void barChart(HttpServletResponse response) throws IOException {
       //x轴名称列表
       List<String> xAxisNameList = new ArrayList<>(Arrays.asList("一级", "二级", "三级", "四级", "五级"));
       //图例名称列表
       List<String> legendNameList = new ArrayList<>(Arrays.asList("李四", "张三"));
       //数据列表
       List<List<Object>> dataList = new ArrayList<>();
       dataList.add(new ArrayList<>(Arrays.asList(100, 90, 5, 6, 2)));
       dataList.add(new ArrayList<>(Arrays.asList(2, 0, 3, 4, 5)));
       //图例背景颜色
       List<Color> legendColorList = new ArrayList<>(Arrays.asList(new Color(65, 105, 225)));
       GenerateChartUtil.createBarChart(response.getOutputStream(), "各级变化图", legendNameList, xAxisNameList
               , dataList, JFreeChartUtil.createChartTheme("宋体"), "y轴", "x轴"
               , 600, 400, 0d, 100d, legendColorList, true, "{2}%");
   }

3.4.3.4 柱状图调试代码二
public static void main(String[] args) throws Exception {
        //x轴名称列表
        List<String> xAxisNameList = new ArrayList<>(Arrays.asList("一级", "二级", "三级", "四级", "五级"));
        //图例名称列表
        List<String> legendNameList = new ArrayList<>(Arrays.asList("电压"));
        //数据列表
        List<List<Object>> dataList = new ArrayList<>();
        dataList.add(new ArrayList<>(Arrays.asList(100, 90, 5, 6, 2)));
        //图例背景颜色
        //指定输出流到的位置
        OutputStream os = new FileOutputStream("1.png");
        List<Color> legendColorList = new ArrayList<>(Arrays.asList(new Color(81, 86, 225)));
        GenerateChartUtil.createBarChart(os, "", legendNameList, xAxisNameList
                , dataList, JFreeChartUtil.createChartTheme("宋体"), "电压(mV)", "质量数"
                , 600, 400, 0d, 100d, legendColorList, true, "");
    }

3.4.3.5 堆叠柱状图调试代码
/**
    * 堆叠柱状图
    *
    * @param response
    */
   @GetMapping("/stackedBarChart")
   public void stackedBarChart(HttpServletResponse response) throws IOException {
       //x轴名称列表
       List<String> xAxisNameList = new ArrayList<>(Arrays.asList("一级", "二级", "三级", "四级", "五级"));
       //图例名称列表
       List<String> legendNameList = new ArrayList<>(Arrays.asList("李四", "张三"));
       //数据列表
       List<List<Object>> dataList = new ArrayList<>();
       dataList.add(new ArrayList<>(Arrays.asList(1, 3, 5, 6, 2)));
       dataList.add(new ArrayList<>(Arrays.asList(2, 1, 3, 4, 5)));
       GenerateChartUtil.createStackedBarChart(response.getOutputStream(), "各级变化图", legendNameList, xAxisNameList
               , dataList, JFreeChartUtil.createChartTheme("宋体"), "y轴", "x轴", 600, 400);
   }

3.4.3.6 折线图调试代码
/**
    * 折线图
    *
    * @param response
    */
   @GetMapping("/lineChart")
   public void lineChart(HttpServletResponse response) throws IOException {
       //x轴名称列表
       List<String> xAxisNameList = new ArrayList<>(Arrays.asList("一级", "二级", "三级", "四级", "五级"));
       //图例名称列表
       List<String> legendNameList = new ArrayList<>(Arrays.asList("李四", "张三"));
       //数据列表
       List<List<Object>> dataList = new ArrayList<>();
       dataList.add(new ArrayList<>(Arrays.asList(1, 3, 5, 6, 2)));
       dataList.add(new ArrayList<>(Arrays.asList(2, 1, 3, 4, 5)));
       GenerateChartUtil.createLineChart(response.getOutputStream(), "各级变化图", legendNameList, xAxisNameList
               , dataList, JFreeChartUtil.createChartTheme("宋体"), "y轴", "x轴", 600, 400);
   }
 文章来源:https://www.toymoban.com/news/detail-493105.html
3.4.3.7 散点图调试代码
   /**
    * 散点图
    *
    * @param response
    */
   @GetMapping("/scatterPlot")
   public void scatterPlot(HttpServletResponse response) throws IOException {
       //设置散点图数据集
       //设置第一个
       XYSeries firefox = new XYSeries("Firefox");
       firefox.add(1.0, 1.0);
       firefox.add(2.0, 4.0);
       firefox.add(3.0, 3.0);
       //设置第二个
       XYSeries chrome = new XYSeries("Chrome");
       chrome.add(1.0, 4.0);
       chrome.add(2.0, 5.0);
       chrome.add(3.0, 6.0);
       //设置第三个
       XYSeries ie = new XYSeries("IE");
       ie.add(3.0, 4.0);
       ie.add(4.0, 5.0);
       ie.add(5.0, 4.0);
       //添加到数据集
       XYSeriesCollection dataset = new XYSeriesCollection();
       dataset.addSeries(firefox);
       dataset.addSeries(chrome);
       dataset.addSeries(ie);
       GenerateChartUtil.createScatterPlot(response.getOutputStream(), "各级变化图", dataset
               , JFreeChartUtil.createChartTheme("宋体"), "y轴", "x轴", 600, 400);
   }
 文章来源地址https://www.toymoban.com/news/detail-493105.html
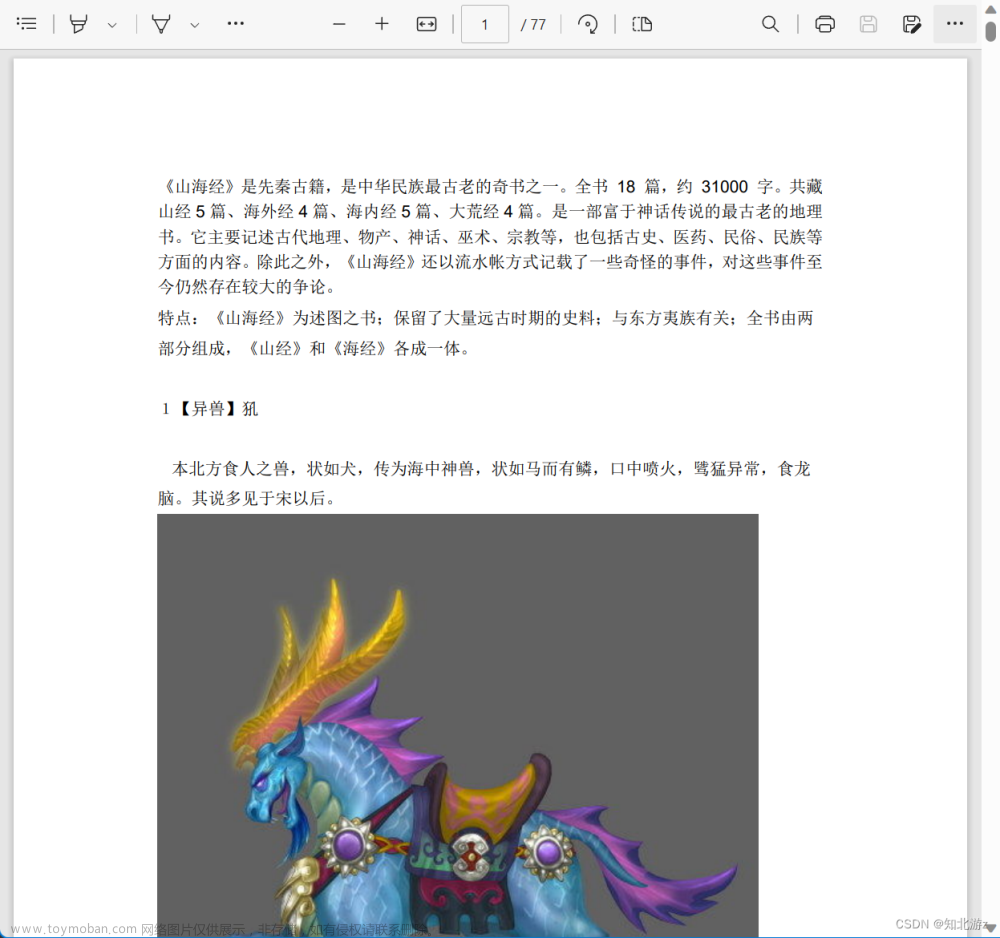
4. word文档转PDF
4.1 引入依赖
<!--word 转 pdf-->
      <dependency>
          <groupId>com.documents4j</groupId>
          <artifactId>documents4j-local</artifactId>
          <version>1.0.3</version>
      </dependency>
      <dependency>
          <groupId>com.documents4j</groupId>
          <artifactId>documents4j-transformer-msoffice-word</artifactId>
          <version>1.0.3</version>
      </dependency>
4.2 代码
public class WordToPdf {
    public static void word2pdf(String wordPath, String pdfPath) throws IOException {
        InputStream docxInputStream = null;
        OutputStream outputStream = null;
        try {
            // 原word地址
            docxInputStream = new FileInputStream(wordPath);
            // 转换后pdf生成地址
            outputStream = new FileOutputStream(pdfPath);
            IConverter converter = LocalConverter.builder().build();
            converter.convert(docxInputStream)
                    .as(DocumentType.DOCX)
                    .to(outputStream)
                    .as(DocumentType.PDF).execute();
            // 关闭
            converter.shutDown();
            // 关闭
            outputStream.close();
            // 关闭
            docxInputStream.close();
        } catch (Exception e) {
            System.out.println("[documents4J] word转pdf失败:" + e.toString());
        } finally {
            if (outputStream != null) {
                outputStream.close();
            }
            if (docxInputStream != null) {
                docxInputStream.close();
            }
        }
    }
}
到了这里,关于Java根据word模板生成word文档并转成PDF文件的文章就介绍完了。如果您还想了解更多内容,请在右上角搜索TOY模板网以前的文章或继续浏览下面的相关文章,希望大家以后多多支持TOY模板网!