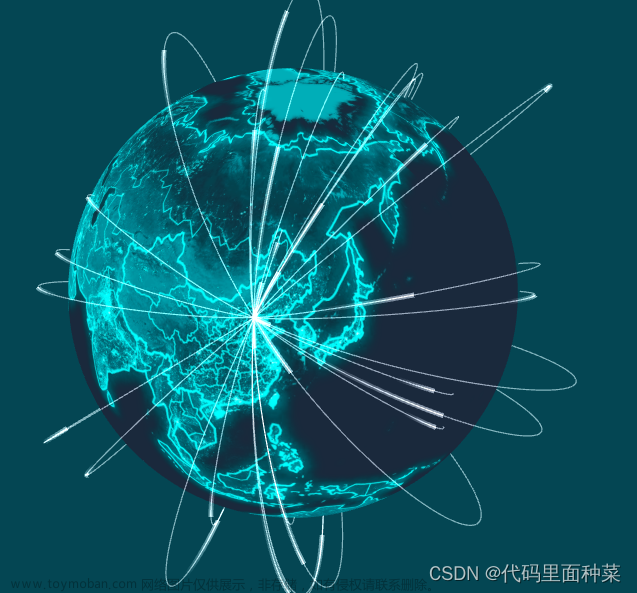
一、 globe+lines3D+scatter3D
效果图:

安装
npm install echarts echarts-gl
代码
<template>
  <div id="myecharts"></div>
</template>

<script>
import * as echarts from "echarts";
export default {
  name: "Globe",
  data() {
    return {};
  },
  computed: {},
  created() {},
  mounted() {
    this.echartsInit();
  },
  methods: {
    echartsInit() {
      require("echarts-gl");
      const series = [
        {
          type: "lines3D",
          effect: {
            show: true,
            period: 3, // 尾迹特性周期
            trailLength: 0.1, // 尾迹0~1,线条长度的百分比
          },
          lineStyle: {
            color: "#d9d919",
            width: 2,
            opacity: 0.4,
          },
          data: [
            [[114.175193,22.275706],[120.4574,-1.743046]],
            [[126.964746,37.58644],[139.767187,35.715616]],
            [[-118.24762,34.058993],[139.767187,35.715616]]
          ]
          // data: this.activeData(this.linesData) // 大多数情况下数据是请求后再经过处理而来
          /*
          起点经纬度 终点经纬度
          [
            [[fromx0,fromy0],[tox0,toy0]],
            [[fromx1,fromy1],[tox1,toy1]]
          ]
          */
        },
        {
          type: "lines3D",
          lineStyle: {
            color: "#fff",
            width: 2,
            opacity: 0.6,
          },
          // data: this.normalData(this.linesData),
          data: [
            [[114.175193,22.275706],[100.454152,13.731434]],
            [[114.175193,22.275706],[2.332962,48.864677]],
            [[101.684555,3.15663],[114.175193,22.275706]],
            [[-118.24762,34.058993],[151.210446,-33.875774]]
          ]
        },
        {
          type: "scatter3D",
          coordinateSystem: "globe",
          zlevel: 3,
          label: {
            show: true,
            position: "bottom",
            formatter: "{b}",
            fontSize: 16
          },
          itemStyle: {
            color: "#d9d919",
          },
          data: [
            {"name":"香港","value":[114.175193,22.275706]},
            {"name":"东京","value":[139.767187,35.715616]},
            {"name":"首尔","value":[126.964746,37.58644]},
            {"name":"印尼","value":[120.4574,-1.743046]},
            {"name":"洛杉矶","value":[-118.24762,34.058993]}
          ],
        },
        {
          type: "scatter3D",
          coordinateSystem: "globe", // 使用的坐标系
          zlevel: 3,
          label: {
            show: true,
            position: "bottom",
            formatter: "{b}",
            fontSize: 16
          },
          itemStyle: {
            color: "#fff",
          },
          data: [
            {"name":"吉隆坡","value":[101.684555,3.15663]},
            {"name":"曼谷","value":[100.454152,13.731434]},
            {"name":"悉尼","value":[151.210446,-33.875774]},
            {"name":"巴黎","value":[2.332962,48.864677]}
          ]
          /*
          [
            {
              name: '',
              value: [lng,lat]
            }
          ]
          */
        }
      ];
      const myecharts = echarts.init(document.getElementById("myecharts"));
      const option = {
        backgroundColor: "#000",
        globe: {
          baseTexture: require('@/assets/images/world.jpg'), // 地球的纹理
          shading: "lambert",
          atmosphere: { // 不需要大气光圈去掉即可
            show: true,
            offset: 4 // 大气层光圈宽度
          },
          viewControl: {
            distance: 200 // 默认视角距离地球表面距离
          },
          light: {
            ambient: {
              intensity: 1.3, // 全局的环境光设置
            },
            main: {
              intensity: 1.5, // 场景主光源设置
            },
          },
        },
        series: series,
      };
      myecharts.setOption(option);
    },
  },
};
</script>

<style lang="scss" scoped>
#myecharts {
  width: 900px;
  height: 900px;
  margin: 0 auto;
}
</style>
问题
散点图使用的是scatter3D,可以看到文字不是贴合在地球表面,某些角度文字会被遮挡(对此没有要求的话,到这里就行了)。尝试了几种方案最终解决问题,以下是散点图贴合地球表面的做法
二、globe+lines3D+scatter
效果图:
安装
npm install echarts echarts-gl
代码
<template>
  <div id="myecharts"></div>
</template>

<script>
import * as echarts from "echarts";
require('@/assets/js/world.js')
export default {
  name: "Globe",
  data() {
    return {};
  },
  computed: {},
  created() {},
  mounted() {
    this.echartsInit();
  },
  methods: {
    echartsInit() {
      require("echarts-gl");
      const series = [
        {
          type: "lines3D",
          effect: {
            show: true,
            period: 3, // 尾迹特性周期
            trailLength: 0.1, // 尾迹0~1,线条长度的百分比
          },
          lineStyle: {
            color: "#d9d919",
            width: 2,
            opacity: 0.4,
          },
          data: [
            [[114.175193,22.275706],[120.4574,-1.743046]],
            [[126.964746,37.58644],[139.767187,35.715616]],
            [[-118.24762,34.058993],[139.767187,35.715616]]
          ]
          // data: this.activeData(this.linesData) // 大多数情况下数据是请求后再经过处理而来
          /*
          起点经纬度 终点经纬度
          [
            [[fromx0,fromy0],[tox0,toy0]],
            [[fromx1,fromy1],[tox1,toy1]]
          ]
          */
        },
        {
          type: "lines3D",
          lineStyle: {
            color: "#fff",
            width: 2,
            opacity: 0.6,
          },
          // data: this.normalData(this.linesData),
          data: [
            [[114.175193,22.275706],[100.454152,13.731434]],
            [[114.175193,22.275706],[2.332962,48.864677]],
            [[101.684555,3.15663],[114.175193,22.275706]],
            [[-118.24762,34.058993],[151.210446,-33.875774]]
          ]
        }
      ];
      const myecharts = echarts.init(document.getElementById("myecharts"));
      myecharts.setOption({
        backgroundColor: "#000",
        globe: {
          baseTexture: require('@/assets/images/world.jpg'), // 地球的纹理
          shading: "lambert",
          layers: [
            {
              type: 'overlay',
              texture: this.globeInit(), // 覆盖层geo和scatter
              distance: 0 // 覆盖层离地表距离
            }
          ],
          atmosphere: { // 不需要大气光圈去掉即可
            show: true,
            offset: 4 // 大气层光圈宽度
          },
          viewControl: {
            distance: 200 // 默认视角距离地球表面距离
          },
          light: {
            ambient: {
              intensity: 1.3, // 全局的环境光设置
            },
            main: {
              intensity: 1.5, // 场景主光源设置
            },
          },
        },
        series: series
      });
    },
    globeInit() {
      const scatter = [
        {
          type: 'scatter',
          coordinateSystem: 'geo',
          zlevel: 3,
          symbolSize: 30, // 标记的大小
          label: {
            show: true,
            position: "bottom",
            formatter: "{b}",
            fontSize: 30,
            color: "#d9d919"
          },
          itemStyle: {
            color: "#d9d919",
          },
          data: [
            {"name":"香港","value":[114.175193,22.275706]},
            {"name":"东京","value":[139.767187,35.715616]},
            {"name":"首尔","value":[126.964746,37.58644]},
            {"name":"印尼","value":[120.4574,-1.743046]},
            {"name":"洛杉矶","value":[-118.24762,34.058993]}
          ],
        },
        {
          type: 'scatter',
          coordinateSystem: 'geo',
          zlevel: 3,
          symbolSize: 30,
          label: {
            show: true,
            position: "bottom",
            formatter: "{b}",
            fontSize: 30,
            color: "#fff"
          },
          itemStyle: {
            color: "#fff",
          },
          data: [
            {"name":"吉隆坡","value":[101.684555,3.15663]},
            {"name":"曼谷","value":[100.454152,13.731434]},
            {"name":"悉尼","value":[151.210446,-33.875774]},
            {"name":"巴黎","value":[2.332962,48.864677]}
          ]
          /*
          [
            {
              name: '',
              value: [lng,lat]
            }
          ]
          */
        }
      ]
      const baseCharts = echarts.init(document.createElement('canvas'), null, {
        width: 4096,
        height: 2048
      })
      baseCharts.setOption({
        backgroundColor: 'transparent', // 海洋颜色
        geo: {
          map: 'world',
          show: false,
          left: 0,
          top: 0,
          right: 0,
          bottom: 0,
          boundingCoords: [ // 定义定位的左上角以及右下角分别所对应的经纬度
            [-180, 90],
            [180, -90]
          ],
          // itemStyle: {
          //   borderColor: 'transparent',
          //   areaColor: 'transparent' // 陆地颜色
          // },
          emphasis: { // 高亮状态下的多边形和标签样式
            disabled: true
          }
        },
        series: scatter
      })
      return baseCharts
    }
  },
};
</script>

<style lang="scss" scoped>
#myecharts {
  width: 900px;
  height: 900px;
  margin: 0 auto;
}
</style>
补充
如果地球纹理不需要使用图片,使用geo组件绘制的地图即可,那么可按以下修改

baseTexture从图片改成echarts 的实例,去掉地球表面层layers,再根据需要进行配置即可

资源
代码已经上传,如有需要可以进行下载
echarts+echarts-gl实现带有散点、路径的3d地球-Node.js文档类资源-CSDN下载
文章提到的globe+scatter3D+lines3D、globe+scatter+lines3D、补充以及world.jpg、world.js,该资源都含有
三个分支是三种情况

主要代码在Globe.vue中 文章来源:https://www.toymoban.com/news/detail-494184.html
 文章来源地址https://www.toymoban.com/news/detail-494184.html
到了这里,关于3d地球散点图加路径lines3D的实现,带有散点即路径的立体地球的文章就介绍完了。如果您还想了解更多内容,请在右上角搜索TOY模板网以前的文章或继续浏览下面的相关文章,希望大家以后多多支持TOY模板网!


