一、主要函数
cv::connectedComponents 函数将二值图像分割成多个连通区域,每个连通区域被赋予一个唯一的标签。函数的返回值为标签数目。该函数的原型如下:
int connectedComponents(InputArray image,
                        OutputArray labels,
                        int connectivity = 8,
                        int ltype = CV_32S);
-
image:输入图像。 -
labels:输出的连通区域标签图像。 -
connectivity:为连通性。 -
ltype:输出图像的数据类型。
cv::connectedComponentsWithStats 函数除了输出连通区域标签图像外,还会输出每个连通区域的一些统计信息,如像素数目、外接矩形等。该函数的原型如下:
int connectedComponentsWithStats(InputArray image,
                                 OutputArray labels,
                                 OutputArray stats,
                                 OutputArray centroids,
                                 int connectivity = 8,
                                 int ltype = CV_32S);
其中,参数 image、labels、connectivity 和 ltype 的含义与 cv::connectedComponents 函数相同,参数 stats 为输出的统计信息,参数 centroids 为输出的连通区域质心。使用这两个函数可以方便地实现图像分割、目标检测等应用。
二、C++代码
#include <iostream>
#include <opencv2\opencv.hpp>

using namespace std;

int main()
{
	//对图像进行距离变换
	cv::Mat img = cv::imread("rice.png");
	if (img.empty())
	{
		cout << "请确认图像文件名称是否正确" << endl;
		return -1;
	}
	cv::Mat rice, riceBW;

	//将图像转成二值图像,用于统计连通域
	cv::cvtColor(img, rice, cv::COLOR_BGR2GRAY);
	cv::threshold(rice, riceBW, 50, 255, cv::THRESH_BINARY);

	//生成随机颜色,用于区分不同连通域
	cv::RNG rng(10086);
	cv::Mat out;
	int number = connectedComponents(riceBW, out, 8, CV_16U);  //统计图像中连通域的个数
	vector<cv::Vec3b> colors;
	for (int i = 0; i < number; i++)
	{
		//使用均匀分布的随机数确定颜色
		cv::Vec3b vec3 = cv::Vec3b(rng.uniform(0, 256), rng.uniform(0, 256), rng.uniform(0, 256));
		colors.push_back(vec3);
	}

	//以不同颜色标记出不同的连通域
	cv::Mat result = cv::Mat::zeros(rice.size(), img.type());
	int w = result.cols;
	int h = result.rows;
	for (int row = 0; row < h; row++)
	{
		for (int col = 0; col < w; col++)
		{
			int label = out.at<uint16_t>(row, col);
			if (label == 0)  //背景的黑色不改变
			{
				continue;
			}
			result.at<cv::Vec3b>(row, col) = colors[label];
		}
	}

	//显示结果
	cv::imshow("原图", img);
	cv::imshow("标记后的图像", result);

	cv::waitKey(0);
	return 0;
}
三、python代码
import cv2
import numpy as np

# -------------------------读取数据----------------------------
img = cv2.imread("E:\\OpenCV\\opencvTEST\\rice.png")
# ------------------------转为灰度图---------------------------
gray_img = cv2.cvtColor(img, cv2.COLOR_BGR2GRAY)
# -------------------Otsu's thresholding----------------------
ret2, th2 = cv2.threshold(gray_img, 0, 255, cv2.THRESH_BINARY + cv2.THRESH_OTSU)
# ------------------------连通域分析---------------------------
num_labels, labels, stats, centroids = cv2.connectedComponentsWithStats(th2, connectivity=8)

# -----------------------查看各个返回值------------------------
# 连通域数量
print('num_labels = ', num_labels)
# 连通域的信息:对应各个轮廓的x、y、width、height和面积
print('stats = ', stats)
# 连通域的中心点
print('centroids = ', centroids)
# 每一个像素的标签1、2、3.。。,同一个连通域的标签是一致的
print('labels = ', labels)

# 不同的连通域赋予不同的颜色
output = np.zeros((img.shape[0], img.shape[1], 3), np.uint8)
for i in range(1, num_labels):
    mask = labels == i
    output[:, :, 0][mask] = np.random.randint(0, 255)
    output[:, :, 1][mask] = np.random.randint(0, 255)
    output[:, :, 2][mask] = np.random.randint(0, 255)
cv2.imshow('oginal', output)
cv2.waitKey()
cv2.destroyAllWindows()
四、结果展示
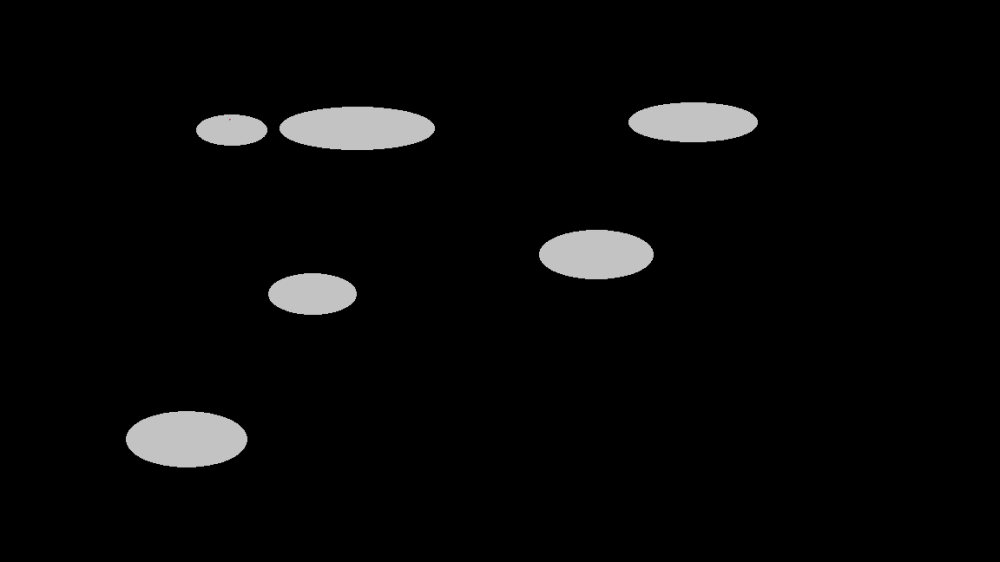
1、原始图像

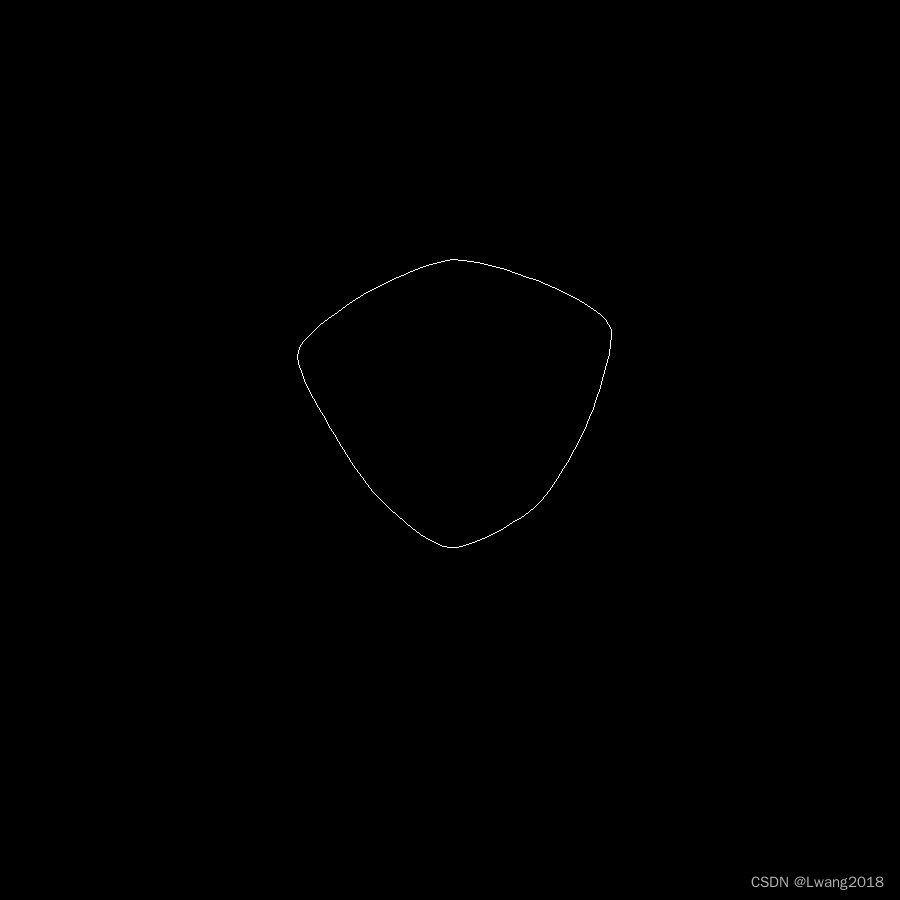
2、检测结果
 文章来源:https://www.toymoban.com/news/detail-501870.html
五、参考链接
[1] OPENCV自学记录(6)——PYTHON实现连通域处理函数CV2.CONNECTEDCOMPONENTSWITHSTATS()和CV2.CONNECTEDCOMPONENTS()
[2] OpenCV_连通区域分析(Connected Component Analysis-Labeling)文章来源地址https://www.toymoban.com/news/detail-501870.html
到了这里,关于OpenCV——图像连通域分析的文章就介绍完了。如果您还想了解更多内容,请在右上角搜索TOY模板网以前的文章或继续浏览下面的相关文章,希望大家以后多多支持TOY模板网!


