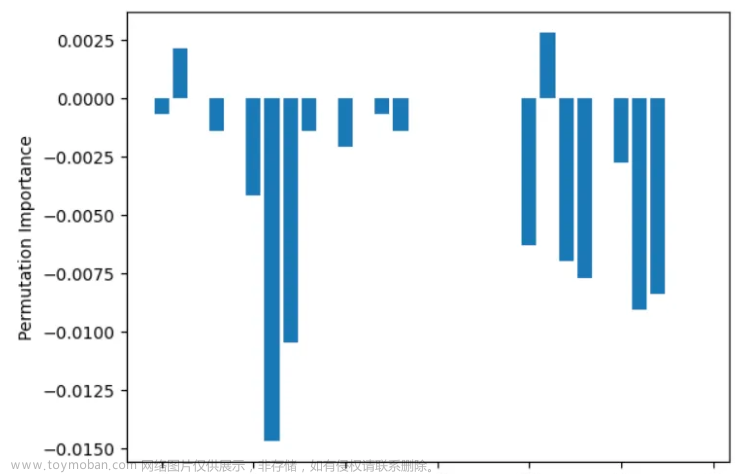
lightgmb算法里面的plot_importance()方法支持特征重要度的查看,下面将以lightgmb算法为例将特征重要度可视化展示出来。另外xgboost算法的实现也几乎一样哦。
事先准备好模型:
import lightgbm as lgb
model_lgb = lgb.LGBMClassifier().fit(X_train, y_train)
以上模型训练好了,下面查看特征重要度:
from lightgbm import plot_importance
fig,ax = plt.subplots(figsize=(10,8))
plot_importance(model_lgb,max_num_features=20,ax=ax)
plt.show()
代码讲解:
import导入lightgbm算法里查看特征重要度的plot_importance包;
plt.subplots(figsize=(10,8))指生成长为10,宽为8的画布;
plot_importance()里面的model_lgb是我们事先定义的函数名,里面存了lightgbm算法;max_num_features=20展示头部20个特征;
运行结果:

不限制max_num_features,即可展示所有的特征:
fig,ax = plt.subplots(figsize=(10,8))
plot_importance(model_lgb,ax=ax)
文章来源:https://www.toymoban.com/news/detail-506769.html
图里面的特征重要度从大到小的排列,就能够直观地了解哪些是影响预测结果的重要特征了。文章来源地址https://www.toymoban.com/news/detail-506769.html
到了这里,关于Python机器学习:plot_importance()查看特征重要度的文章就介绍完了。如果您还想了解更多内容,请在右上角搜索TOY模板网以前的文章或继续浏览下面的相关文章,希望大家以后多多支持TOY模板网!


