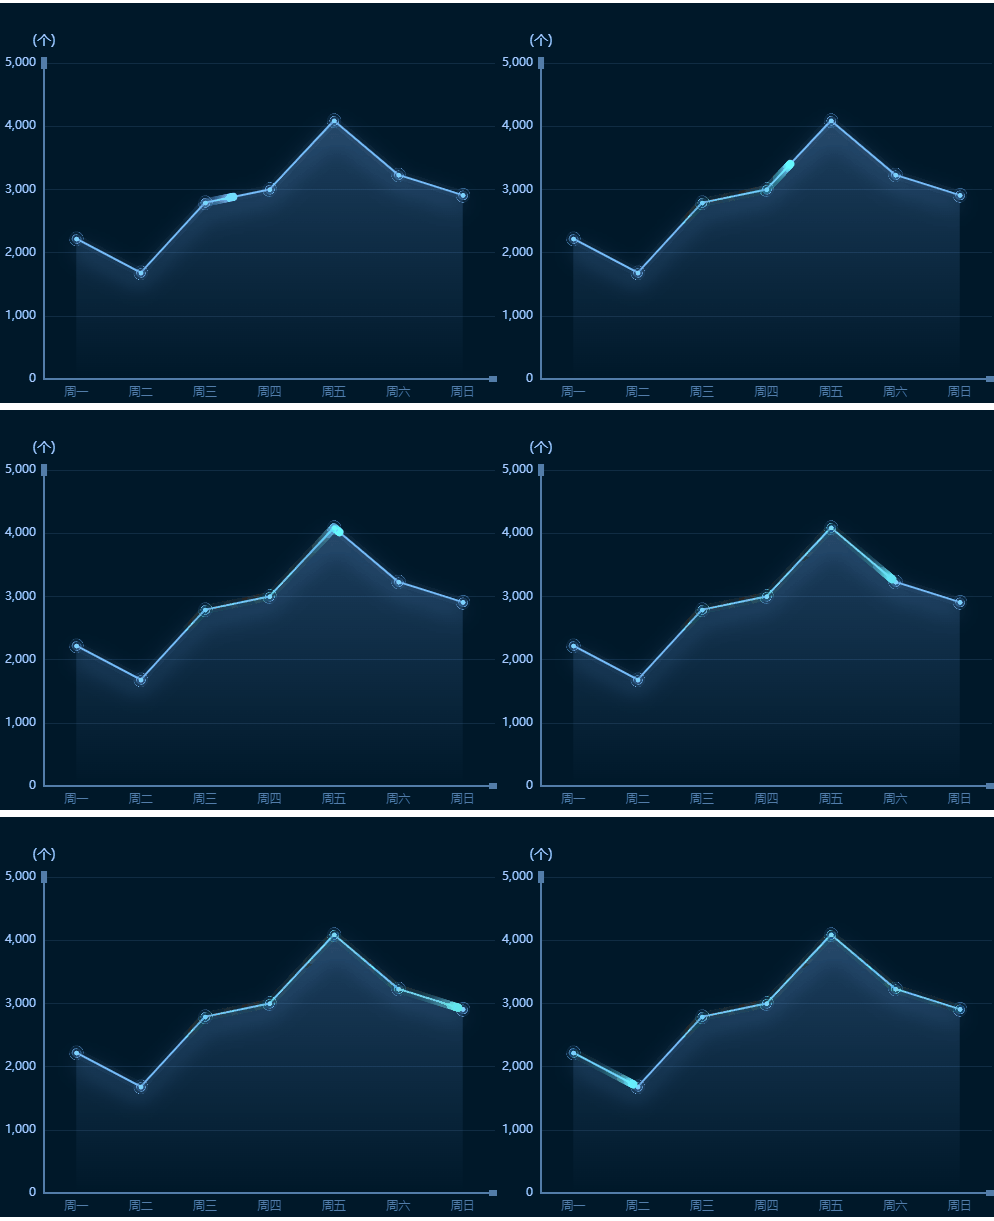
当图表中存在多个柱状图时,如何让每条折线折点对应在每个柱状图中点位置?
配置如下:
option = {
    color: ['#83c034', '#ea4748', '#f8ac00', '#00a2ea'], // 柱状图颜色
    legend: {
        data: ['篮球', '足球', '排球', '羽毛球']
    },
    xAxis: [
        {
            type: 'category',
            name: '星期(天)',
            data: ['星期一', '星期二', '星期三', '星期四', '星期五', '星期六', '星期天'],
            axisLabel: {
                color: '#00000',
                fontSize: 10,
                interval: 0,
            }
        },
        {
            type: 'value',
            max: 7 * 100,
            show: false
        }
    ],
    yAxis: [
        {
            type: 'value',
            name: '采购数量(个)'
        }
    ],
    series: [
        {
            data: ['46', '48', '48', '70', '40', '46', '50'],
            name: '篮球',
            type: 'bar',
            emphasis: {
                focus: 'series'
            },
            itemStyle: {}
        },
        {
            data: ['49', '52', '84', '52', '53', '51', '53'],
            name: '足球',
            type: 'bar',
            emphasis: {
                focus: 'series'
            },
        },
        {
            data: ['62', '70', '59', '47', '68', '79', '67'],
            name: '排球',
            type: 'bar',
            emphasis: {
                focus: 'series'
            },
        },
        {
            data: ['75', '58', '45', '54', '46', '61', '58'],
            name: '羽毛球',
            type: 'bar',
            emphasis: {
                focus: 'series'
            },
        },
        {
            xAxisIndex: 1,
            data: [[20, '46'], [120, '48'], [220, '48'], [320, '70'], [420, '40'], [520, '46'], [620, '50']],
            type: 'line',
            symbol: 'circle',
            symbolSize: 6,
            itemStyle: {
                normal: {
                    lineStyle: {
                        width: 1,
                        color: '#83c034'
                    }
                },
            }
        },
        {
            xAxisIndex: 1,
            data: [[40, '49'], [140, '52'], [240, '84'], [340, '52'], [440, '53'], [540, '51'], [640, '53']],
            type: 'line',
            symbol: 'circle',
            symbolSize: 6, //拐点大小
            itemStyle: {
                normal: {
                    lineStyle: {
                        width: 1, //折线宽度
                        color: '#ea4748' //折线颜色
                    }
                }
            }
        },
        {
            xAxisIndex: 1,
            data: [[60, '62'], [160, '70'], [260, '59'], [360, '47'], [460, '68'], [560, '79'], [660, '67']],
            type: 'line',
            symbol: 'circle', //拐点样式
            symbolSize: 6, //拐点大小
            itemStyle: {
                normal: {
                    lineStyle: {
                        width: 1, //折线宽度
                        color: '#f8ac00' //折线颜色
                    }
                }
            }
        },
        {
            xAxisIndex: 1,
            data: [[80, '75'], [180, '58'], [280, '45'], [380, '54'], [480, '46'], [580, '61'], [680, '58']],
            type: 'line',
            symbol: 'circle', //拐点样式
            symbolSize: 6, //拐点大小
            itemStyle: {
                normal: {
                    lineStyle: {
                        width: 1, //折线宽度
                        color: '#00a2ea' //折线颜色
                    }
                }
            }
        }
    ]
};
图例如下:文章来源:https://www.toymoban.com/news/detail-512521.html
 文章来源地址https://www.toymoban.com/news/detail-512521.html
到了这里,关于echart 实现多柱状图+多折线图的文章就介绍完了。如果您还想了解更多内容,请在右上角搜索TOY模板网以前的文章或继续浏览下面的相关文章,希望大家以后多多支持TOY模板网!


