FINAL笔记
2023-06-27 10:25
缺失值填充:data = Imputer(missing_values=‘NaN’, strategy=‘mean’, axis=0) 或fillna
2023-06-27 10:48
散点图:plt.scatter(iris.data[iris.targetlabel,x_index],iris.data[iris.tar
getlabel,y_index],label=iris.target_names[label],c=color)
2023-06-27 10:50
3q:a=abs(X-mean) ; a[i]>3*std
2023-06-27 10:57
均值归一;MeanNormalization=(x-mean)/(max-min),缩放到一个级别
2023-06-27 11:00
缩放成单位向量:linalg = np.linalg.norm(x, ord=1) X=x/linalg
2023-06-27 11:04
数值离散:均值离散、等宽、等频
2023-06-27 11:07
离散编码:连续转离散(年龄转分段);特征编码:obj转数值
2023-06-27 11:14
get_dummies和OneHotEncoder都是用于将分类变量转换为二进制向量的方法。其中,get_dummies是pandas库中的函数,而OneHotEncoder是sklearn库中的类 。
两者的区别在于,OneHotEncoder适用于多个集合的情况,如训练集和测试集;而get_dummies只适用于一个数据集情况 。此外,OneHotEncoder还可以处理字符串类型的分类变量,而get_dummies则不能直接处理string类型的分类变量。
2023-06-27 11:22
中 feature_selection 的不同方法或函数分别对鸢尾花数据的特征进行方差选择法,卡方检验法(调用 SelectKBest 函数),互信息法(调用mutual_info_classif 函数),而相关系数法需单独调用 scipy 模块中的 stats.pearsonr()函数直接计算。
2023-06-27 11:25
包装法:x_rfe=RFE(estimator=LogisticRegression(),n_features_to_select=3).fit(X, y)
2023-06-27 11:27
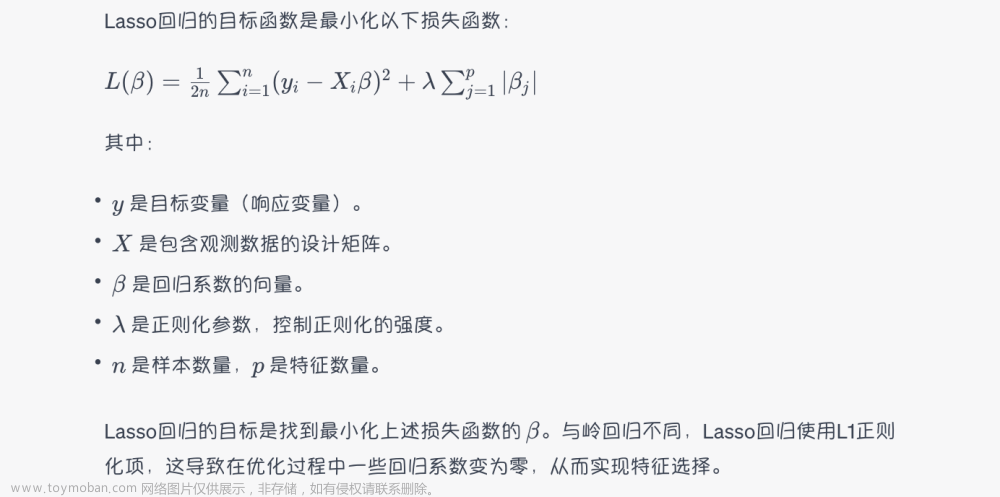
嵌入法:(正则)lasso = Lasso(alpha=1) 和coef、随机森林的feature_importances_
2023-06-27 11:30
线性回归:print(model.coef_) #输出系数 w
print(model.intercept_) #输出截距 b
2023-06-27 11:31
朴素贝叶斯:from sklearn.naive_bayes import BernoulliNB
clf = BernoulliNB()
2023-06-27 11:49
饼图:plt.pie(df[“Sex”].value_counts(),labels=[“male”,“female”],autopct=“%.2f%%”,explode=[0,0.1])
条形图:sns.countplot(dfnew[“Survived”],hue=“Sex”,data=dfnew)
2023-06-27 11:50
记住:
if dfnew.dtypes[x] == np.object:
sns.countplot(dfnew[x])
else:
sns.distplot(dfnew[x])
箱线图:sns.boxplot(dfnew[“Age”])
2023-06-27 11:51
from sklearn.decomposition import PCA
2023-06-27 11:57
分类和聚类算法关注:分类有监督、聚类无监督
2023-06-27 12:00
流程:加载、预处理、相关性、标准化处理、建模、优化、再建模、预测
2023-06-27 13:27
数据拆分后做标准化
2023-06-27 13:28
GradientBoostingRegressor的优化参数:parameters = {‘loss’: [‘ls’,‘lad’,‘huber’,‘quantile’],‘min_samples_leaf’: [1,2,3,4,5],‘alpha’: [0.1,0.3,0.6,0.9]}
2023-06-27 13:32
异常值处理:3q 箱线图 df.boxplot(column=[‘Couple_Year_Income’])
箱线图:sns.boxplot(dfnew[“Age”])
2023-06-27 13:34
异常值删除“:cols_to_drop = np.unique([col[1] for col in cols_pair_to_drop])
2023-06-27 13:35
众数填充的时候,注意有0:df[col_to_fill].fillna(df[col_to_fill].mode()[0])
2023-06-27 13:40
过采样 :from imblearn import over_sampling over_sampling.SMOTE
2023-06-27 13:42
模型持久化:from sklearn.externals import joblib
2023-06-27 13:44
随机森林调参:{‘max_depth’:range(3,30,2)} {‘min_samples_split’:range(10,150,20), ‘min_samples_leaf’:range(10,60,10)} {‘n_estimators’:range(10,101,10)}
2023-06-27 13:45
多分类问题可以用“决策树”和“随机森林”以及“神经网络多层感知分类器”算法来分析处理:
常用“随机森林算法”和“GBDT算法”
针对二分类问题,可使用的算法有逻辑斯谛回归、朴素贝叶斯、支持向量机、树模型等。常用逻辑斯谛回归(广义线性模型)和随机森林(集成树模型)来做对比。考虑到样本极度不均衡,模型评价选用综合指标f1_score。
2023-06-27 13:50
分类算法是将输入的样本分成不同的类别,而回归算法则是预测一个连续的数值。
2023-06-27 13:55
obj转datetime:df[‘Date’] = df[‘Date’].astype(np.datetime64)
字符转数值:df[‘Block’] = pd.factorize(df[‘Block’])[0]
数值类型处理一般都是标准化或者最大最小、均值归一
2023-06-27 13:57
xy.sort_values(by = 0,ascending = False) 排序
2023-06-27 13:59
F1度量(f1_score)对模型进行评估,预测准确率达0.85。一般而言,预测结果大于0.8
2023-06-27 14:00
采用5折交叉验证法(cv=5)进行模型评估 grid = GridSearchCV(rf,params,cv = 5)
2023-06-27 14:01
gbdt提升树 交叉验证 由于调整参数越多模型运行的时间越长,先对学习速率参数调优。如下代码所选取[0.01,0.1,0.3]共3个参数,并采用5折交叉验证法(cv=5)进行模型评估
2023-06-27 14:02
接着采用分类模型算法中的决策树、随机森林与梯度提升树进行分类预测
2023-06-27 14:03
数据集筛选:hdma=hdma[hdma[‘action_taken_name’]!=“Application withdrawn by applicant”]
特征衍生:hdma[‘loan_status’]=[0.0 if x==“Loan originated” else 1.0 for x in hdma[‘action_taken_name’]]
2023-06-27 14:04
相关性分析:corr和X.corrwith(hdma.loan_status).plot.bar(figsize=(20, 10), fontsize=12, grid=True)
2023-06-27 14:05
相关性分析:特征列与目标相关性==corr和X.corrwith(hdma.loan_status).plot.bar(figsize=(20, 10), fontsize=12, grid=True)
相关性分析:列与列的相关性 corr
2023-06-27 14:07
不符合正太分布的可以做分箱
hist(figsize=(15,15))
2023-06-27 14:08
查看obj字段:hdma_meta=pd.DataFrame(hdma.dtypes)
hdma_meta[hdma_meta[0]==‘object’]
2023-06-27 14:10
对obj字段处理:做看缺失值
删除、删除唯一值
2023-06-27 14:11
get_dummies是pandas中One-hot的方法
采用pandas的get_dummies方法对保留的离散特征做编码
2023-06-27 14:14
因为这里并未有距离计算,也可尝试采用Labelencoder而非One-hot编码
2023-06-27 14:15
距离计算:欧式、曼哈顿,如knn算法
2023-06-27 14:26
基础
列表【】 insert upper lower
字典{:} keys values
集合{} if x in xx,remove,
list和tuple集合。import copy
li=[0,1]
while len(li)<15:
li.append(li[-1]+li[-2])
2023-06-27 14:30
new_data=df[df[“date”]==“2020/3/19”]
按用户ID浏量生成数据集data_new2
new_data2=new_data.groupby([“id”,“flow”,“app”]).sum()
plt.bar(data=new_data2[new_data2[“id”]==5],x=“app”,height=“flow”)
plt.pie(data=new_data2[new_data2[“id”]==10][“app”],x=new_data2[new_data2[“id”]==10][“flow”],labels=[“b”,“a”],autopct=‘%1.1f%%’,explode=(0.2,0))
2023-06-27 14:34
条形图:sns.barplot(x,y,data,hue)
2023-06-27 14:41
分箱后,使用sns.countplot(y=“”,data=)
2023-06-27 14:42
散点图常用到的两种方法:1. df.loc[df[xx]==1][yy] 2. df[df[xx]==1,yy]
2023-06-27 14:44
将df转str:df.astype(str),df.apply(encoder.fit-transfor)
2023-06-27 14:47
分类模块:
sklearn.datasets import make_blobs;
x,y=make_blobs(y_pre,n_feature=2)
scatter(x[:,0],x[:,1])
2023-06-27 14:53
属性转化:df[“target”]=pd.DataFrame(1 if i==“>50” else 0 for i in df[“target”].str.strip())
2023-06-27 14:57
删除异常值方法:获取索引,然后drop
df[df[item]<q1-1.5*iqr | ccc].indx
df.drop(index)
2023-06-27 15:01
查看过采样比列:from collections import Counter
Count(x_train_res)
2023-06-27 15:04
填充方法:
- df.fillna
- imput imort SimpleImputer
2023-06-27 15:05
直方图:plt.hist([xx,xx1],data) df.plot(kind) sns.distplot
2023-06-27 15:08
斐波那契额:考虑输入0 1,2的时候的值,0 是 0 ,1是 0 ,2是【0,1】文章来源:https://www.toymoban.com/news/detail-513427.html
2023年6月27日15:29:15
总体思路:文章来源地址https://www.toymoban.com/news/detail-513427.html
- 读取数据
- 预处理:缺失值处理、时间数据处理、离散型数据处理、连续值转换
- 探索分析
- 建模:训练、评估、优化
- 获取最有模型
到了这里,关于数据挖掘-FINAL笔记的文章就介绍完了。如果您还想了解更多内容,请在右上角搜索TOY模板网以前的文章或继续浏览下面的相关文章,希望大家以后多多支持TOY模板网!


