本文介绍如何生成和发送包含图表和表格的邮件,涉及echarts图表转换为图片、图片内嵌到html邮件内容中、html邮件内容生成、邮件发送方法等
一、图表处理
因为html格式的邮件不支持echarts,也不支持js执行,所以图表需要转换为图片内嵌在邮件内容中
因为平台首页相关统计都是使用echarts渲染展示,为了减少后端接口兼容的工作量,我们使用pyecharts替代,这样就可以使用同样的数据结构和后端接口
pyecharts是python版本的echarts,配置项与echarts基本一致,具体使用方法可以参考官网 https://pyecharts.org/#/zh-cn/chart_api
我们实现的具体代码如下:
返回是图片的本地绝对路径
需要注意的是,pyecharts render之后生成的是html文件,是通过make_snapshot函数将html转换为图片
1、需要安装库:pyecharts + snapshot_selenium或者snapshot_phantomjs
2、make_snapshot第一个参数是转换引擎,可以使用snapshot_selenium 或者 snapshot_phantomjs
(1)如果使用snapshot_phantomjs,则需要使用npm安装phantomjs(linux环境同理)
(2)如果使用snapshot_selenium,则需要将浏览器驱动放到python路径下,比如我使用google浏览器,则下载对应版本的驱动chromedriver.exe,放在python.exe所在目录下(linux环境同理)
二、邮件内容生成
邮件内容最终是html格式,需要将图片和表格等数据全部填充好之后再发送
1、创建模板,需要根据数据实时填充的使用{{xxx}}标识
比如我的周报模板:
<html lang="en">
<head>
    <meta charset="UTF-8">
    <title>专项检测周报</title>
</head>
<body>
<h2 style="font_size:30">【{{busi_plat}}】风险总数为:{{risk_total}}</h2>
<hr style="border: none; border-top: 1px solid #ccc; height: 1px; margin: 20px 0;">
<div>
<table style="cellpadding:0;border: 0px solid #ccc;width:100%">
  <tr>
    <td align="center" valign="top">
      <a href="{{risk_level_pic_href}}">
        <img src="cid:{{risk_level_pic}}" width="720" height="400" alt="Image 1">
      </a>
    </td>
    <td align="center" valign="top">
      <a href="{{risk_status_pic_href}}">
        <img src="cid:{{risk_status_pic}}" width="720" height="400" alt="Image 2">
      </a>
    </td>

  </tr>
  <tr>
    <td align="center" valign="top">
      <a href="{{risk_busi_asc_pic_href}}">
        <img src="cid:{{risk_busi_asc_pic}}" width="720" height="400" alt="Image 1">
      </a>
    </td>
    <td align="center" valign="top">
      <a href="{{risk_check_tool_pic_href}}">
        <img src="cid:{{risk_check_tool_pic}}" width="720" height="400" alt="Image 2">
      </a>
    </td>
  </tr>
</table>
</div>
<div>
<hr style="border: none; border-top: 1px solid #ccc; height: 1px; margin: 10px 0;">
<h3 style="font_size:20">【风险类型汇总 TOP 10】</h3>
<table  width="100%" border="1" cellspacing="0" cellpadding="4">
<tr>
<th>序号</th>
<th>风险类型</th>
<th>发现工具</th>
<th>风险数量</th>
</tr>
{{risk_top_data}}
</table>
</div>
<div>

<hr style="border: none; border-top: 1px solid #ccc; height: 1px; margin: 10px 0;">
<h3 style="font_size:20">【军规汇总 TOP 10】</h3>
<table  width="100%" border="1" cellspacing="0" cellpadding="4">
<tr>
<th>序号</th>
<th>军规</th>
<th>发现工具</th>
<th>风险数量</th>
</tr>
{{army_top_data}}
</table>
</div>
<hr style="border: none; border-top: 1px solid #ccc; height: 1px; margin: 10px 0;">
<h3 style="font_size:20">【本周新增明细】</h3>
<a href="{{detail_href}}">按照风险等级排序,最多展示15条,更多详情和记录 点这里>>>></a>
<table  width="100%" border="1" cellspacing="0" cellpadding="4">
<tr>
<th>序号</th>
<th>业务方向</th>
<th>业务模块</th>
<th>发现工具</th>
<th>风险类型</th>
<th>风险明细</th>
<th>风险等级</th>
<th>状态</th>
<th>操作</th>
</tr>
{{detail_list_data}}
</table>
</body>
</html>
2、获取到统计数据之后,使用replace做替换,生成最终的html格式的邮件内容 文章来源:https://www.toymoban.com/news/detail-513686.html
三、发送邮件
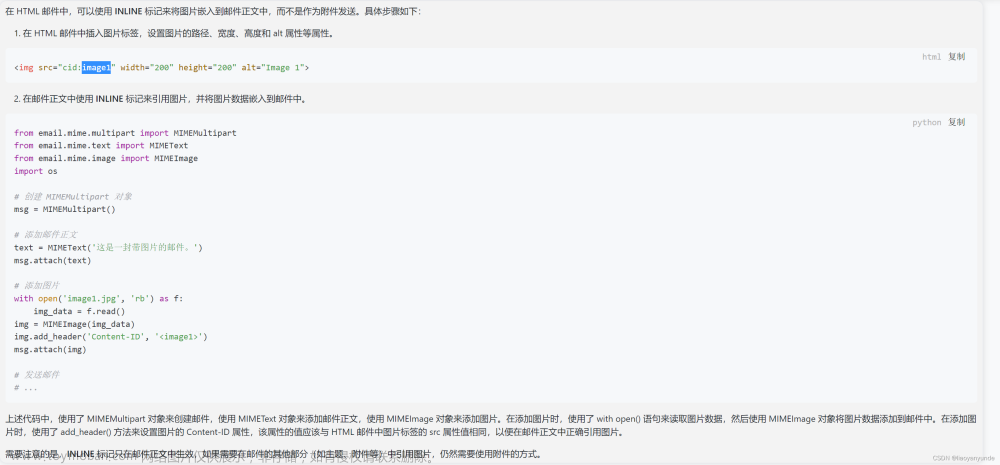
在邮件内容中使用的图片需要作为附件一起发送,才能够在邮件中正常显示。
设置方法参考下图 文章来源地址https://www.toymoban.com/news/detail-513686.html
到了这里,关于发送图文并茂的html格式的邮件的文章就介绍完了。如果您还想了解更多内容,请在右上角搜索TOY模板网以前的文章或继续浏览下面的相关文章,希望大家以后多多支持TOY模板网!


