目录
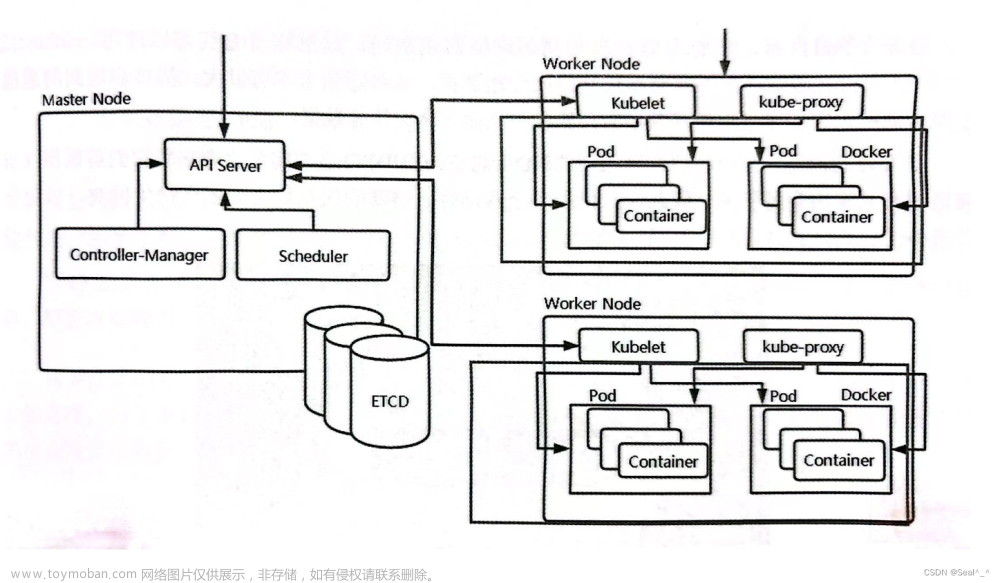
1、kubernete集群环境以及prometheus基础环境
2、kubernetes监控集群内部的spring-boot程序
2.1、application.yml系统配置,endpoints相关设置
2.2、引入监控的相关依赖文件 pom.xml ,主要是spring-boot-starter-actuator和micrometer-registry-prometheus
2.3、Dockerfile构建基础镜像
2.4、k8s环境部署spring-boot-.app.yaml
2.5、k8s部署spring-boot-app的servicemonitor
2.6、kubesphere上未安装grafana,手动部署
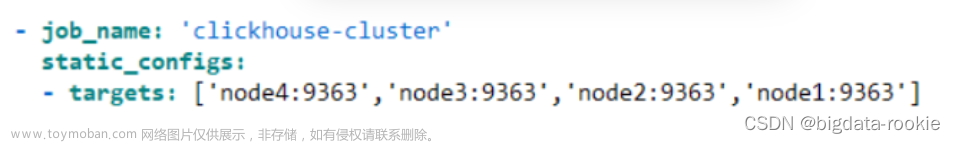
3、kubernetes监控集群外部的程序
3.1、准备部署文件
1、kubernete集群环境以及prometheus基础环境

2、kubernetes监控集群内部的spring-boot程序
效果图
使用Spring Boot2.1监控系统的相关信息,grafana进行数据展示。

Prmetheus获取/actuator/prometheus接口的数据,target进行展示
 k8s部署spring-boot成功,通过swagger3进行测试访问
 pod容器进行端口的映射

进入容器内部,访问/actuator/prometheus地址 
2.1、application.yml系统配置,endpoints相关设置
server:
port: 8080
tomcat:
max-http-form-post-size: 200MB
springfox:
documentation:
swagger-ui:
enabled: true
spring:
redis:
host: redis.apisix.svc.cluster.local
port: 6379
database: 0
lettuce:
pool:
max-active: 8
max-wait: -1ms
max-idle: 8
min-idle: 0
time-between-eviction-runs: 6s
shutdown-timeout: 1000ms
management:
endpoints:
web:
exposure:
include: '*'
#include:
#- 'prometheus'
#- 'health'
#- 'info'
jmx:
exposure:
include: '*'
enabled-by-default: true
endpoint:
metrics:
enabled: true
beans:
cache:
time-to-live: 10s
shutdown:
enabled: true
metrics:
export:
prometheus:
enabled: true
tags:
application: spring-boot-app
health:
jms:
enabled: true
server:
base-path: /
port: 9091
2.2、引入监控的相关依赖文件 pom.xml ,主要是spring-boot-starter-actuator和micrometer-registry-prometheus
<?xml version="1.0" encoding="UTF-8"?>
<project xmlns="http://maven.apache.org/POM/4.0.0" xmlns:xsi="http://www.w3.org/2001/XMLSchema-instance"
xsi:schemaLocation="http://maven.apache.org/POM/4.0.0 http://maven.apache.org/xsd/maven-4.0.0.xsd">
<modelVersion>4.0.0</modelVersion>
<parent>
<groupId>org.springframework.boot</groupId>
<artifactId>spring-boot-starter-parent</artifactId>
<version>2.4.5</version>
<relativePath/>
</parent>
<artifactId>spring-boot-app</artifactId>
<name>spring-boot-app</name>
<properties>
<java.version>1.8</java.version>
</properties>
<dependencies>
<dependency>
<groupId>org.springframework.boot</groupId>
<artifactId>spring-boot-starter-actuator</artifactId>
</dependency>
<dependency>
<groupId>io.micrometer</groupId>
<artifactId>micrometer-registry-prometheus</artifactId>
</dependency>
</dependencies>
</project>
2.3、Dockerfile构建基础镜像
运行命令docker build -t zhxl1989/spring-boot-app:latest .
删除none镜像
docker images | grep none | awk '{print $3}' | xargs docker rmi -fFROM centos:7
ENV MYPATH /root
WORKDIR $MYPATH
RUN yum -y install vim git wget
RUN mv /etc/yum.repos.d/CentOS-Base.repo /etc/yum.repos.d/CentOS-Base.repo_bak
RUN wget -O /etc/yum.repos.d/CentOS-Base.repo http://mirrors.aliyun.com/repo/Centos-7.repo
RUN yum clean all && yum makecache && yum update -y && yum -y install gcc gcc-c++ kernel-devel yum-utils device-mapper-persistent-data lvm2 tcpdump
RUN yum -y install net-tools
RUN yum update -y && yum install -y java-1.8.0-openjdk
RUN /bin/cp /usr/share/zoneinfo/Asia/Shanghai /etc/localtime
RUN echo "Asia/Shanghai" > /etc/timezone
RUN yum install libpcap libpcap-devel -y
RUN yum -y install gcc gcc-c++ automake make pam-devel openldap-devel cyrus-sasl-devel openssl-devel wget telnet net-tools
VOLUME /tmp
WORKDIR /home/spring-boot-app/
COPY /target/lib /home/spring-boot-app/lib
COPY /target/config /home/spring-boot-app/config
COPY /target/spring-boot-app.jar /home/spring-boot-app/spring-boot-app.jar
RUN ln -sf /usr/share/zoneinfo/Asia/Shanghai /etc/localtime
RUN echo 'Asia/Shanghai' >/etc/timezone
EXPOSE 8080
EXPOSE 9091
...省略
2.4、k8s环境部署spring-boot-.app.yaml
apiVersion: apps/v1
kind: Deployment
metadata:
name: spring-boot-app
namespace: apisix
spec:
replicas: 1
selector:
matchLabels:
app: spring-boot-app
strategy:
type: RollingUpdate
rollingUpdate:
maxUnavailable: 25%
maxSurge: 25%
revisionHistoryLimit: 10
progressDeadlineSeconds: 600
template:
metadata:
labels:
app: spring-boot-app
release: default
spec:
restartPolicy: Always
containers:
- name: spring-boot-app
image: zhxl1989/spring-boot-app:latest
imagePullPolicy: IfNotPresent
ports:
- name: http
containerPort: 8080
- name: actuator
containerPort: 9091
- name: debug
containerPort: 5555
volumeMounts:
- mountPath: /etc/localtime
name: volume-localtime
volumes:
- hostPath:
path: /etc/localtime
type: ''
name: volume-localtime---
apiVersion: v1
kind: Service
metadata:
name: spring-boot-app
namespace: apisix
labels:
app: spring-boot-app
spec:
#type: ClusterIP
type: NodePort
ports:
- name: http
port: 8080
protocol: TCP
targetPort: 8080
nodePort: 30153
- name: actuator
port: 9091
protocol: TCP
targetPort: 9091
nodePort: 30152
- name: debug
port: 5555
protocol: TCP
targetPort: 5555
nodePort: 30151
selector:
app: spring-boot-app
2.5、k8s部署spring-boot-app的servicemonitor
apiVersion: monitoring.coreos.com/v1
kind: ServiceMonitor
metadata:
name: spring-boot-app
namespace: demo
#service和ServiceMonitor开始配置后,的Service Discovery有数据,但是状态UP一直为0
#target一直找不到数据
#label下写成k8s-app,Service Discovery有数据,Target无数据,不知道为什么
#改成app出现正常了
#ServiceMonitor使用的namespace一定要存在,和service的namespace可以不一样
labels:
app: spring-boot-app
spec:
endpoints:
- interval: 15s
scheme: http
path: /actuator/prometheus
port: actuator
honorLabels: true
jobLabel: app
namespaceSelector:
matchNames:
- apisix
selector:
matchLabels:
app: spring-boot-app
2.6、kubesphere上未安装grafana,手动部署
apiVersion: v1
kind: PersistentVolumeClaim
metadata:
name: grafana-pvc
namespace: apisix
spec:
storageClassName: nfs-client
accessModes:
- ReadWriteOnce
resources:
requests:
storage: 10Gi
---
apiVersion: apps/v1
kind: Deployment
metadata:
labels:
app: grafana
name: grafana
namespace: apisix
spec:
selector:
matchLabels:
app: grafana
template:
metadata:
labels:
app: grafana
spec:
securityContext:
fsGroup: 472
supplementalGroups:
- 0
containers:
- name: grafana
image: grafana/grafana:9.1.0
imagePullPolicy: IfNotPresent
ports:
- containerPort: 3000
name: http-grafana
protocol: TCP
readinessProbe:
failureThreshold: 3
httpGet:
path: /robots.txt
port: 3000
scheme: HTTP
initialDelaySeconds: 10
periodSeconds: 30
successThreshold: 1
timeoutSeconds: 2
livenessProbe:
failureThreshold: 3
initialDelaySeconds: 30
periodSeconds: 10
successThreshold: 1
tcpSocket:
port: 3000
timeoutSeconds: 1
resources:
requests:
cpu: 250m
memory: 750Mi
volumeMounts:
- mountPath: /var/lib/grafana
name: grafana-pv
volumes:
- name: grafana-pv
persistentVolumeClaim:
claimName: grafana-pvc
---
apiVersion: v1
kind: Service
metadata:
name: grafana
namespace: apisix
spec:
ports:
- port: 3000
protocol: TCP
targetPort: http-grafana
selector:
app: grafana
sessionAffinity: None
type: LoadBalancer
3、kubernetes监控集群外部的程序
3.1、准备部署文件
k8s-gitlab-ci-demo-deplyment.yaml
apiVersion: apps/v1
kind: Deployment
metadata:
name: k8s-gitlab-ci-demo
namespace: demo
spec:
replicas: 1
selector:
matchLabels:
app: k8s-gitlab-ci-demo
strategy:
type: RollingUpdate
rollingUpdate:
maxUnavailable: 25%
maxSurge: 25%
revisionHistoryLimit: 10
progressDeadlineSeconds: 600
template:
metadata:
labels:
app: k8s-gitlab-ci-demo
release: default
spec:
restartPolicy: Always
containers:
- name: k8s-gitlab-ci-demo
image: zhxl1989/k8s-gitlab-ci-demo:latest
imagePullPolicy: IfNotPresent
ports:
- containerPort: 8089
name: http
resources:
limits:
cpu: '1'
memory: 2Gi
requests:
cpu: 500m
memory: 1Gi
volumeMounts:
- mountPath: /etc/localtime
name: volume-localtime
volumes:
- hostPath:
path: /etc/localtime
type: ''
name: volume-localtime
k8s-gitlab-ci-deno-service.yaml ,service中添加kind: Endpoints,指定宿主机的ip端口信息,在k8s集群外面再启动一个java进程
apiVersion: v1
kind: Service
metadata:
labels:
app: k8s-gitlab-ci-demo
name: k8s-gitlab-ci-demo
namespace: demo
spec:
type: ClusterIP
ports:
- name: http
port: 8089
protocol: TCP
targetPort: 8089
---
apiVersion: v1
kind: Endpoints
metadata:
labels:
app: k8s-gitlab-ci-demo
name: k8s-gitlab-ci-demo
namespace: demo
subsets:
- addresses:
- ip: 10.10.10.99
ports:
- name: http
port: 8089
protocol: TCP
在10.10.10.99上通过java -jar启动程序
 文章来源:https://www.toymoban.com/news/detail-524290.html
 文章来源地址https://www.toymoban.com/news/detail-524290.html
到了这里,关于kubernete部署prometheus监控sring-boot程序的文章就介绍完了。如果您还想了解更多内容,请在右上角搜索TOY模板网以前的文章或继续浏览下面的相关文章,希望大家以后多多支持TOY模板网!