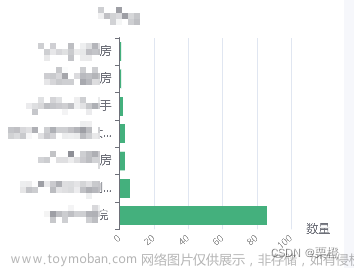
坐标轴数据太多,只能滚动显示,滚动的时候,不想缩放,单纯平移就好。

文章来源地址https://www.toymoban.com/news/detail-532314.html文章来源:https://www.toymoban.com/news/detail-532314.html

option = {
          title: {
            // text: 'World Population',
          },
          tooltip: {
            trigger: 'axis',
            axisPointer: {
              type: 'shadow',
            },
          },
          legend: {},
          grid: {
            left: '3%',
            right: '4%',
            bottom: '3%',
            containLabel: true,
          },
          axisLine: {
            show: false,
          },

          xAxis: {
            type: 'value',
            min:0,
            max:25, //指定一个x轴的最大值,才会再滚动到第二屏的时候柱形长度不变长
          },
          dataZoom: [
            {
              type: 'inside', // 支持内部鼠标滚动平移
              start: 25,
              end: 100,
              yAxisIndex: 0,
              zoomOnMouseWheel: false, // 关闭滚轮缩放
              moveOnMouseWheel: true, // 开启滚轮平移
              moveOnMouseMove: false, // 鼠标移动能触发数据窗口平移
            },
          ],
          yAxis: {
            type: 'category',
            axisTick: {
              show: false,
            },
            minInterval: 1,
            axisLine: {
              show: false,
            },
            // min: 1, // 设置 y 轴显示的最小值
            // max: 50, // 设置 y 轴显示的最大值
            data: ["A", "B", "C", "D", "E", "F", "G", "H", "I", "J", "K","L", "M", "N", "O", "P"],
          },

          series: [
            {
              // name: '2011',
              type: 'bar',
              data: [2, 1,1, 1, 1,1, 1, 1, 1, 1, 1, 1, 1, 1, 1, 25],
              boundaryGap: false, // 关闭坐标轴两端的空白
              // min: , // 设置 y 轴显示的最小值
              // max: 11, // 设置 y 轴显示的最大值
              barWidth: 10, // 柱条的宽度,不设时自适应
              itemStyle: {
                color: 'rgba(147,98,246,1)',
              },
              label: {
                show: true,
                position: 'right',
                color: 'rgba(147,98,246,1)',
                fontSize: 14,
              },
            },
          ],
        }
到了这里,关于echarts 柱形图 Y轴数据多,鼠标滚动显示数据,不缩放的文章就介绍完了。如果您还想了解更多内容,请在右上角搜索TOY模板网以前的文章或继续浏览下面的相关文章,希望大家以后多多支持TOY模板网!

