下边代码会画出一个y=cos(x)的图像:
import numpy as np
import matplotlib.pyplot as plt

x = np.linspace(-2,2,100)
y=np.cos(np.pi*x)

plt.plot(x,y,'go')
plt.title(r"$y=\cos(\pi | time x$")
plt.show()
在Jupyter lab运行的时候,发现报错如下:
ModuleNotFoundError: No module named 'matplotlib'

conda install matplotlib -c https://mirrors.bfsu.edu.cn/anaconda/pkgs/main/ -n jupyterlabuse从清华python源里边安装matplotlib。
完成之后显示:
Preparing transaction: done
Verifying transaction: done
Executing transaction: done

Note: you may need to restart the kernel to use updated packages.
 文章来源:https://www.toymoban.com/news/detail-532434.html
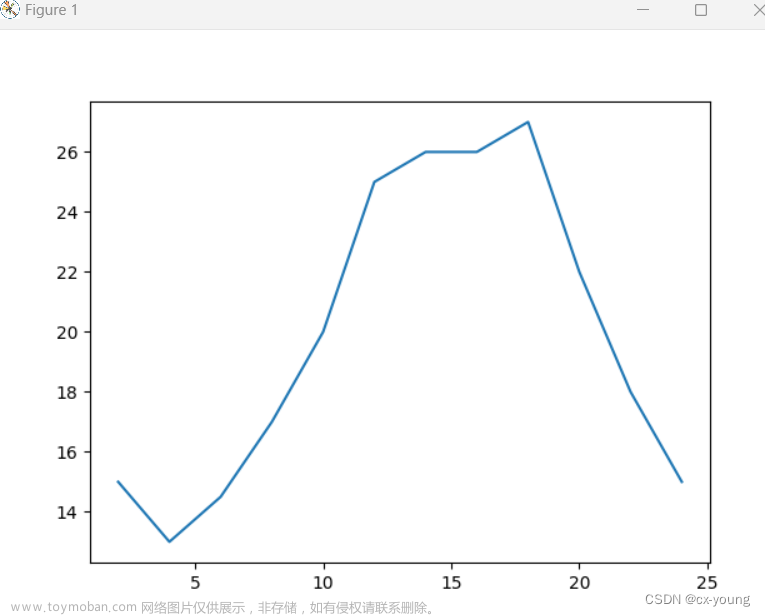
运行结果如下图: 文章来源地址https://www.toymoban.com/news/detail-532434.html
到了这里,关于学习matplotlib第一步的文章就介绍完了。如果您还想了解更多内容,请在右上角搜索TOY模板网以前的文章或继续浏览下面的相关文章,希望大家以后多多支持TOY模板网!