一、下载prometheus
https://github.com/prometheus/prometheus/releases/download/v2.45.0/prometheus-2.45.0.linux-amd64.tar.gz
二、解压prometheus
tar -zxvf prometheus-2.45.0.linux-amd64.tar.gz -C /data/src
重命名目录
mv prometheus-2.45.0.linux-amd64/ prometheus
三、查看prometheus目录
 ls
console_libraries  consoles  LICENSE  NOTICE  prometheus  prometheus.yml  promtool
四、查看prometheus版本
 ./prometheus --version
prometheus, version 2.45.0 (branch: HEAD, revision: 8ef767e396bf8445f009f945b0162fd71827f445)
  build user:       root@920118f645b7
  build date:       20230623-15:09:49
  go version:       go1.20.5
  platform:         linux/amd64
  tags:             netgo,builtinassets,stringlabels
五、查看prometheus的配置文件
cat prometheus.yml
# my global config
global:
  scrape_interval: 15s # Set the scrape interval to every 15 seconds. Default is every 1 minute.
  evaluation_interval: 15s # Evaluate rules every 15 seconds. The default is every 1 minute.
  # scrape_timeout is set to the global default (10s).

# Alertmanager configuration
alerting:
  alertmanagers:
    - static_configs:
        - targets:
          # - alertmanager:9093

# Load rules once and periodically evaluate them according to the global 'evaluation_interval'.
rule_files:
  # - "first_rules.yml"
  # - "second_rules.yml"

# A scrape configuration containing exactly one endpoint to scrape:
# Here it's Prometheus itself.
scrape_configs:
  # The job name is added as a label `job=<job_name>` to any timeseries scraped from this config.
  - job_name: "prometheus"

    # metrics_path defaults to '/metrics'
    # scheme defaults to 'http'.

    static_configs:
      - targets: ["localhost:9090"]
六、启动prometheus
./prometheus --config.file=prometheus.yml
ts=2023-07-10T14:18:25.894Z caller=main.go:534 level=info msg="No time or size retention was set so using the default time retention" duration=15d
ts=2023-07-10T14:18:25.894Z caller=main.go:578 level=info msg="Starting Prometheus Server" mode=server version="(version=2.45.0, branch=HEAD, revision=8ef767e396bf8445f009f945b0162fd71827f445)"
ts=2023-07-10T14:18:25.894Z caller=main.go:583 level=info build_context="(go=go1.20.5, platform=linux/amd64, user=root@920118f645b7, date=20230623-15:09:49, tags=netgo,builtinassets,stringlabels)"
ts=2023-07-10T14:18:25.894Z caller=main.go:584 level=info host_details="(Linux 3.10.0-1160.11.1.el7.x86_64 #1 SMP Fri Dec 18 16:34:56 UTC 2020 x86_64 t-qcbj5-hadoop-database-003.test-qcloud-dd-insight.net mynextev.net)"
ts=2023-07-10T14:18:25.894Z caller=main.go:585 level=info fd_limits="(soft=100002, hard=100002)"
ts=2023-07-10T14:18:25.894Z caller=main.go:586 level=info vm_limits="(soft=unlimited, hard=unlimited)"
ts=2023-07-10T14:18:25.896Z caller=web.go:562 level=info component=web msg="Start listening for connections" address=0.0.0.0:9090
ts=2023-07-10T14:18:25.897Z caller=main.go:1019 level=info msg="Starting TSDB ..."
ts=2023-07-10T14:18:25.898Z caller=tls_config.go:274 level=info component=web msg="Listening on" address=[::]:9090
ts=2023-07-10T14:18:25.898Z caller=tls_config.go:277 level=info component=web msg="TLS is disabled." http2=false address=[::]:9090
ts=2023-07-10T14:18:25.901Z caller=head.go:595 level=info component=tsdb msg="Replaying on-disk memory mappable chunks if any"
ts=2023-07-10T14:18:25.901Z caller=head.go:676 level=info component=tsdb msg="On-disk memory mappable chunks replay completed" duration=5.464µs
ts=2023-07-10T14:18:25.901Z caller=head.go:684 level=info component=tsdb msg="Replaying WAL, this may take a while"
ts=2023-07-10T14:18:25.902Z caller=head.go:755 level=info component=tsdb msg="WAL segment loaded" segment=0 maxSegment=0
ts=2023-07-10T14:18:25.902Z caller=head.go:792 level=info component=tsdb msg="WAL replay completed" checkpoint_replay_duration=30.401µs wal_replay_duration=440.59µs wbl_replay_duration=175ns total_replay_duration=497.133µs
ts=2023-07-10T14:18:25.903Z caller=main.go:1040 level=info fs_type=XFS_SUPER_MAGIC
ts=2023-07-10T14:18:25.903Z caller=main.go:1043 level=info msg="TSDB started"
ts=2023-07-10T14:18:25.903Z caller=main.go:1224 level=info msg="Loading configuration file" filename=prometheus.yml
ts=2023-07-10T14:18:25.908Z caller=main.go:1261 level=info msg="Completed loading of configuration file" filename=prometheus.yml totalDuration=4.283491ms db_storage=2.843µs remote_storage=4.02µs web_handler=359ns query_engine=2.046µs scrape=3.883248ms scrape_sd=29.859µs notify=36.267µs notify_sd=10.1µs rules=2.501µs tracing=22.132µs
ts=2023-07-10T14:18:25.908Z caller=main.go:1004 level=info msg="Server is ready to receive web requests."
ts=2023-07-10T14:18:25.908Z caller=manager.go:995 level=info component="rule manager" msg="Starting rule manager..."
七、登陆prometheus
http://ip:9090

八、查看prometheus jmx
http://ip:9090/metrics
九、下载grafana
wget https://mirrors.tuna.tsinghua.edu.cn/grafana/yum/rpm/Packages/grafana-10.0.1-1.x86_64.rpm
十、安装grafana
yum install grafana-10.0.1-1.x86_64.rpm
十一、启动grafana
启动grafana
systemctl start grafana-server.service
查看grafana状态
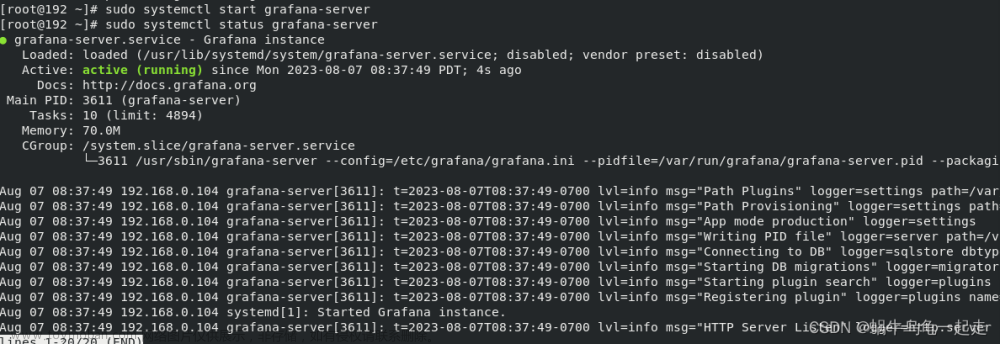
systemctl status grafana-server.service
● grafana-server.service - Grafana instance
   Loaded: loaded (/usr/lib/systemd/system/grafana-server.service; disabled; vendor preset: disabled)
   Active: active (running) since Mon 2023-07-10 22:33:52 CST; 2s ago
     Docs: http://docs.grafana.org
 Main PID: 14630 (grafana)
   CGroup: /system.slice/grafana-server.service
           └─14630 /usr/share/grafana/bin/grafana server --config=/etc/grafana/grafana.ini --pidfile=/var/run/grafana/grafana-server.pid --...

Jul 10 22:33:52 t-qcbj5-hadoop-database-003.test-qcloud-dd-insight.net grafana[14630]: logger=modules t=2023-07-10T22:33:52.929664759+08....."
Jul 10 22:33:52 t-qcbj5-hadoop-database-003.test-qcloud-dd-insight.net grafana[14630]: logger=ngalert.state.manager t=2023-07-10T22:33:5...up"
Jul 10 22:33:52 t-qcbj5-hadoop-database-003.test-qcloud-dd-insight.net systemd[1]: Started Grafana instance.
Jul 10 22:33:52 t-qcbj5-hadoop-database-003.test-qcloud-dd-insight.net grafana[14630]: logger=ngalert.state.manager t=2023-07-10T22:33:5…067µs
Jul 10 22:33:52 t-qcbj5-hadoop-database-003.test-qcloud-dd-insight.net grafana[14630]: logger=ticker t=2023-07-10T22:33:52.930088471+08:...:00
Jul 10 22:33:52 t-qcbj5-hadoop-database-003.test-qcloud-dd-insight.net grafana[14630]: logger=ngalert.multiorg.alertmanager t=2023-07-10...er"
Jul 10 22:33:52 t-qcbj5-hadoop-database-003.test-qcloud-dd-insight.net grafana[14630]: logger=grafanaStorageLogger t=2023-07-10T22:33:52...ng"
Jul 10 22:33:52 t-qcbj5-hadoop-database-003.test-qcloud-dd-insight.net grafana[14630]: logger=http.server t=2023-07-10T22:33:52.93363107...et=
Jul 10 22:33:53 t-qcbj5-hadoop-database-003.test-qcloud-dd-insight.net grafana[14630]: logger=plugins.update.checker t=2023-07-10T22:33:...7ms
Jul 10 22:33:53 t-qcbj5-hadoop-database-003.test-qcloud-dd-insight.net grafana[14630]: logger=grafana.update.checker t=2023-07-10T22:33:...1ms
Hint: Some lines were ellipsized, use -l to show in full.
十二、登陆grafana
账号和密码都是:admin
十三、添加prometheus数据源
 prometheus的URL是http://ip:9090
添加成功后保存数据源,成功如下所示
十四、prometheus收集服务jmx信息
修改配置文件prometheus.yml
- job_name: 'debezium-prod-jmx'
  static_configs:
    - targets: ['10.170.116.170:7081', '10.170.77.194:7081']  # 多个JMX端口的地址和端口
重启prometheus
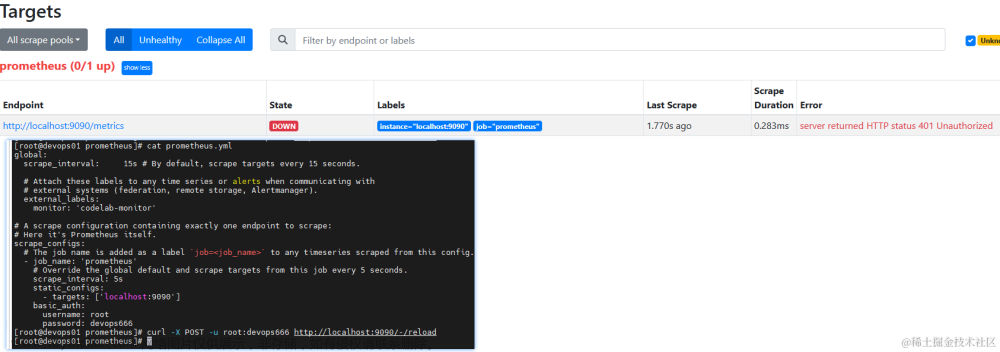
十五、查看prometheus的status
发现成功采集debezium服务的jmx数据
十六、grafana为prometheus添加dashboard
grafana官网搜索你想监控的服务的dashboard:
- https://grafana.com/grafana/dashboards/
两种方法:
- grafana官网搜索UID
- 复制服务json
唯一标识符 (UID)
仪表板的唯一标识符 (UID) 可用于唯一标识多个 Grafana 安装之间的仪表板。 UID 允许使用一致的 URL 来访问仪表板,因此更改仪表板的标题不会破坏任何指向该仪表板的书签链接。

查看添加的dashboard:文章来源:https://www.toymoban.com/news/detail-561907.html
 文章来源地址https://www.toymoban.com/news/detail-561907.html
到了这里,关于prometheus采集服务的jmx数据,grafana通过dashboard展示jmx数据的文章就介绍完了。如果您还想了解更多内容,请在右上角搜索TOY模板网以前的文章或继续浏览下面的相关文章,希望大家以后多多支持TOY模板网!