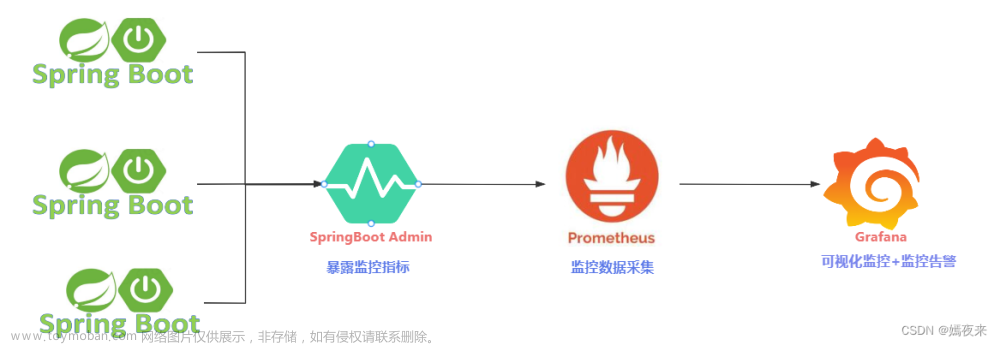
SpringBoot+Prometheus+Grafana 监控面板
提示:本文使用SpringBoot 简单样例,介绍基础配置和使用方法
包含内容:Docker、SpringBoot、Maven、 Prometheus、Grafana等
提示:本文包含官网内容介绍,具体更项目的学习,请参照各官网文档,谢谢
前言
Prometheus
官网:https://prometheus.io/文档地址:https://prometheus.io/docs/introduction/overview/
使用领先的开源监控解决方案为您的指标和警报提供支持。
Prometheus是一个开源系统监控和警报工具包,最初是在 SoundCloud构建的。自2012年推出以来,许多公司和组织都采用了Prometheus,该项目拥有非常活跃的开发者和用户社区。它现在是一个独立的开源项目,独立于任何公司进行维护。为了强调这一点,并明确项目的治理结构,Prometheus 于 2016 年加入 云原生计算基金会,成为继Kubernetes之后的第二个托管项目。
Prometheus 将其指标收集并存储为时间序列数据,即指标信息与记录时的时间戳一起存储,以及称为标签的可选键值对。
grafana
官网地址:https://grafana.com/文档地址:https://grafana.com/docs/grafana/latest/
grafana是一个非常酷的数据可视化平台,常常应用于显示监控数据,底层数据源可以支持influxDb、graphite、elasticSeach
一、创建SpringBoot项目
创建普通SpringBoot项目
Maven配置
<?xml version="1.0" encoding="UTF-8"?>
<project xmlns="http://maven.apache.org/POM/4.0.0"
         xmlns:xsi="http://www.w3.org/2001/XMLSchema-instance"
         xsi:schemaLocation="http://maven.apache.org/POM/4.0.0 http://maven.apache.org/xsd/maven-4.0.0.xsd">
    <modelVersion>4.0.0</modelVersion>

    <parent>
        <groupId>org.springframework.boot</groupId>
        <artifactId>spring-boot-starter-parent</artifactId>
        <version>2.1.6.RELEASE</version>
    </parent>

    <groupId>org.example</groupId>
    <artifactId>moni</artifactId>
    <version>1.0-SNAPSHOT</version>

    <properties>
        <maven.compiler.source>8</maven.compiler.source>
        <maven.compiler.target>8</maven.compiler.target>
        <project.build.sourceEncoding>UTF-8</project.build.sourceEncoding>
    </properties>

    <dependencies>
        <!-- 引入springboot依赖 -->
        <dependency>
            <groupId>org.springframework.boot</groupId>
            <artifactId>spring-boot-starter-web</artifactId>
        </dependency>
        <dependency>
            <groupId>org.springframework.boot</groupId>
            <artifactId>spring-boot-starter-test</artifactId>
            <scope>test</scope>
        </dependency>

        <dependency>
            <groupId>junit</groupId>
            <artifactId>junit</artifactId>
            <version>4.11</version>
            <scope>test</scope>
        </dependency>

        <dependency>
            <groupId>org.springframework.boot</groupId>
            <artifactId>spring-boot-autoconfigure</artifactId>
        </dependency>

        <dependency>
            <groupId>org.springframework.boot</groupId>
            <artifactId>spring-boot-starter-web</artifactId>
        </dependency>
        <dependency>
            <groupId>org.springframework.boot</groupId>
            <artifactId>spring-boot-starter-actuator</artifactId>
        </dependency>
        <dependency>
            <groupId>io.micrometer</groupId>
            <artifactId>micrometer-registry-prometheus</artifactId>
        </dependency>

        <!-- 监控所有 API 请求次数 -->
        <dependency>
            <groupId>org.aspectj</groupId>
            <artifactId>aspectjrt</artifactId>
            <version>1.9.4</version>
        </dependency>
        <dependency>
            <groupId>org.aspectj</groupId>
            <artifactId>aspectjweaver</artifactId>
            <version>1.9.4</version>
        </dependency>
        <dependency>
            <groupId>cglib</groupId>
            <artifactId>cglib</artifactId>
            <version>3.2.12</version>
        </dependency>
    </dependencies>

    <build>
        <plugins>
            <plugin>
                <groupId>org.springframework.boot</groupId>
                <artifactId>spring-boot-maven-plugin</artifactId>
                <executions>
                    <execution>
                        <goals>
                            <goal>repackage</goal>
                        </goals>
                    </execution>
                </executions>
            </plugin>
        </plugins>
    </build>

</project>
二、安装Docker(Centos)
1.引入库
代码如下(示例):
import numpy as np
import pandas as pd
import matplotlib.pyplot as plt
import seaborn as sns
import warnings
warnings.filterwarnings('ignore')
import  ssl
ssl._create_default_https_context = ssl._create_unverified_context
application.yml
server:
  port: 8088

spring:
  application:
    name: demo

management:
  endpoints:
    web:
      exposure:
        include:  '*'
#        include:  prometheus
#      base-path: /

  metrics:
    tags:
      application: ${spring.application.name}
AspectAop.java
package org.example.aop;

import io.micrometer.core.instrument.Counter;
import io.micrometer.core.instrument.MeterRegistry;
import org.aspectj.lang.JoinPoint;
import org.aspectj.lang.annotation.AfterReturning;
import org.aspectj.lang.annotation.Aspect;
import org.aspectj.lang.annotation.Before;
import org.aspectj.lang.annotation.Pointcut;
import org.springframework.beans.factory.annotation.Autowired;
import org.springframework.stereotype.Component;

import javax.annotation.PostConstruct;

@Component
@Aspect
public class AspectAop {

    @Autowired
    MeterRegistry registry;

    private Counter counter_total;

    ThreadLocal<Long> startTime = new ThreadLocal<>();

    @Pointcut("execution(public * controller.*.*(..))")
    private void pointCut(){}

    @PostConstruct
    public void init(){
        counter_total = registry.counter("app_requests_count", "v1", "core");
    }

    @Before("pointCut()")
    public void doBefore(JoinPoint joinPoint)throws Throwable {
        startTime.set(System.currentTimeMillis());
        counter_total.increment();
    }

    @AfterReturning(returning = "returnVal", pointcut = "pointCut()")
    public void doAftereReturning(Object returnVal){
        System.out.println("请求执行时间:" + (System.currentTimeMillis() - startTime.get()));
    }
}
接口控制器
GreetingController.java
package org.example.controller;

import org.springframework.web.bind.annotation.RequestMapping;
import org.springframework.web.bind.annotation.RequestParam;
import org.springframework.web.bind.annotation.RestController;

@RestController
public class GreetingController {

    @RequestMapping("/greeting")
    public String test(@RequestParam(value="name", defaultValue="test") String name) {
        return name;
    }
}
接口请求类
IndexController.java
package org.example.controller;

import io.micrometer.core.instrument.Counter;
import io.micrometer.core.instrument.MeterRegistry;
import org.springframework.beans.factory.annotation.Autowired;
import org.springframework.web.bind.annotation.RequestMapping;
import org.springframework.web.bind.annotation.RestController;

import javax.annotation.PostConstruct;
import java.util.Random;
import java.util.concurrent.atomic.AtomicInteger;

@RestController
@RequestMapping("/v1")
public class IndexController {

    @Autowired
    MeterRegistry registry;

    private Counter counter_core;
    private Counter counter_index;
    private AtomicInteger app_online_count;

    @PostConstruct
    private void init(){
        counter_core = registry.counter("app_requests_method_count", "method", "IndexController.core");
        counter_index = registry.counter("app_requests_method_count", "method", "IndexController.index");
        app_online_count = registry.gauge("app_online_count", new AtomicInteger(0));
    }

    @RequestMapping(value = "/index")
    public Object index(){
        try{
            counter_index.increment();
        } catch (Exception e) {
            return e;
        }
        return counter_index.count() + " index of springboot2-prometheus.";
    }

    @RequestMapping(value = "/core")
    public Object coreUrl(){
        try{
            counter_core.increment();
        } catch (Exception e) {
            return e;
        }
        return counter_core.count() + " coreUrl Monitor by Prometheus.";
    }

    @RequestMapping(value = "/online")
    public Object onlineCount(){
        int people = 0;
        try {
            people = new Random().nextInt(2000);
            app_online_count.set(people);
        } catch (Exception e){
            return e;
        }
        return "current online people: " + people;
    }
}
主方法
Main.java
package org.example;

import io.micrometer.core.instrument.MeterRegistry;
import org.springframework.beans.factory.annotation.Value;
import org.springframework.boot.SpringApplication;
import org.springframework.boot.actuate.autoconfigure.metrics.MeterRegistryCustomizer;
import org.springframework.boot.autoconfigure.SpringBootApplication;
import org.springframework.context.annotation.Bean;

@SpringBootApplication
public class Main {

    public static void main(String[] args) {
        System.out.println("Hello world!");
        SpringApplication.run(Main.class, args);
        System.out.println("start successFully");
    }

    @Bean
    MeterRegistryCustomizer<MeterRegistry> configurer(@Value("${spring.application.name}") String applicationName){
        return registry -> registry.config().commonTags("application", applicationName);
    }

}
项目结构
本地启动SpringBoot项目,请求接口,检查是否成功
http://103.228.171.244:8088/actuator/prometheus
返回示例
# HELP jvm_threads_peak_threads The peak live thread count since the Java virtual machine started or peak was reset
# TYPE jvm_threads_peak_threads gauge
jvm_threads_peak_threads{application="demo",} 20.0
# HELP tomcat_sessions_expired_sessions_total
# TYPE tomcat_sessions_expired_sessions_total counter
tomcat_sessions_expired_sessions_total{application="demo",} 0.0
# HELP tomcat_sessions_active_max_sessions
# TYPE tomcat_sessions_active_max_sessions gauge
tomcat_sessions_active_max_sessions{application="demo",} 0.0
# HELP jvm_gc_memory_allocated_bytes_total Incremented for an increase in the size of the young generation memory pool after one GC to before the next
# TYPE jvm_gc_memory_allocated_bytes_total counter
jvm_gc_memory_allocated_bytes_total{application="demo",} 1.8939856E8
# HELP jvm_buffer_count_buffers An estimate of the number of buffers in the pool
# TYPE jvm_buffer_count_buffers gauge
jvm_buffer_count_buffers{application="demo",id="direct",} 10.0
jvm_buffer_count_buffers{application="demo",id="mapped",} 0.0
# HELP process_cpu_usage The "recent cpu usage" for the Java Virtual Machine process
# TYPE process_cpu_usage gauge
process_cpu_usage{application="demo",} 0.01620745542949757
# HELP jvm_memory_used_bytes The amount of used memory
# TYPE jvm_memory_used_bytes gauge
jvm_memory_used_bytes{application="demo",area="nonheap",id="Metaspace",} 4.2330784E7
jvm_memory_used_bytes{application="demo",area="nonheap",id="Compressed Class Space",} 5480992.0
jvm_memory_used_bytes{application="demo",area="heap",id="Survivor Space",} 669424.0
jvm_memory_used_bytes{application="demo",area="heap",id="Eden Space",} 9130064.0
jvm_memory_used_bytes{application="demo",area="heap",id="Tenured Gen",} 1.977756E7
jvm_memory_used_bytes{application="demo",area="nonheap",id="Code Cache",} 1.2467008E7
# HELP http_server_requests_seconds
# TYPE http_server_requests_seconds summary
http_server_requests_seconds_count{application="demo",exception="None",method="GET",outcome="SUCCESS",status="200",uri="/actuator/prometheus",} 13.0
http_server_requests_seconds_sum{application="demo",exception="None",method="GET",outcome="SUCCESS",status="200",uri="/actuator/prometheus",} 4.145497126
http_server_requests_seconds_count{application="demo",exception="None",method="GET",outcome="SUCCESS",status="200",uri="/**/favicon.ico",} 1.0
http_server_requests_seconds_sum{application="demo",exception="None",method="GET",outcome="SUCCESS",status="200",uri="/**/favicon.ico",} 0.351303217
# HELP http_server_requests_seconds_max
# TYPE http_server_requests_seconds_max gauge
http_server_requests_seconds_max{application="demo",exception="None",method="GET",outcome="SUCCESS",status="200",uri="/actuator/prometheus",} 2.782958311
http_server_requests_seconds_max{application="demo",exception="None",method="GET",outcome="SUCCESS",status="200",uri="/**/favicon.ico",} 0.351303217
# HELP jvm_threads_live_threads The current number of live threads including both daemon and non-daemon threads
# TYPE jvm_threads_live_threads gauge
jvm_threads_live_threads{application="demo",} 20.0
# HELP jvm_buffer_memory_used_bytes An estimate of the memory that the Java virtual machine is using for this buffer pool
# TYPE jvm_buffer_memory_used_bytes gauge
jvm_buffer_memory_used_bytes{application="demo",id="direct",} 81920.0
jvm_buffer_memory_used_bytes{application="demo",id="mapped",} 0.0
# HELP jvm_buffer_total_capacity_bytes An estimate of the total capacity of the buffers in this pool
# TYPE jvm_buffer_total_capacity_bytes gauge
jvm_buffer_total_capacity_bytes{application="demo",id="direct",} 81920.0
jvm_buffer_total_capacity_bytes{application="demo",id="mapped",} 0.0
# HELP jvm_classes_unloaded_classes_total The total number of classes unloaded since the Java virtual machine has started execution
# TYPE jvm_classes_unloaded_classes_total counter
jvm_classes_unloaded_classes_total{application="demo",} 1.0
# HELP process_uptime_seconds The uptime of the Java virtual machine
# TYPE process_uptime_seconds gauge
process_uptime_seconds{application="demo",} 242.236
# HELP tomcat_threads_config_max_threads
# TYPE tomcat_threads_config_max_threads gauge
tomcat_threads_config_max_threads{application="demo",name="http-nio-8088",} 200.0
# HELP process_files_open_files The open file descriptor count
# TYPE process_files_open_files gauge
process_files_open_files{application="demo",} 28.0
# HELP tomcat_threads_current_threads
# TYPE tomcat_threads_current_threads gauge
tomcat_threads_current_threads{application="demo",name="http-nio-8088",} 10.0
# HELP jvm_memory_committed_bytes The amount of memory in bytes that is committed for the Java virtual machine to use
# TYPE jvm_memory_committed_bytes gauge
jvm_memory_committed_bytes{application="demo",area="nonheap",id="Metaspace",} 4.5006848E7
jvm_memory_committed_bytes{application="demo",area="nonheap",id="Compressed Class Space",} 5947392.0
jvm_memory_committed_bytes{application="demo",area="heap",id="Survivor Space",} 1310720.0
jvm_memory_committed_bytes{application="demo",area="heap",id="Eden Space",} 1.0747904E7
jvm_memory_committed_bytes{application="demo",area="heap",id="Tenured Gen",} 2.6673152E7
jvm_memory_committed_bytes{application="demo",area="nonheap",id="Code Cache",} 1.2648448E7
# HELP tomcat_sessions_alive_max_seconds
# TYPE tomcat_sessions_alive_max_seconds gauge
tomcat_sessions_alive_max_seconds{application="demo",} 0.0
# HELP tomcat_global_received_bytes_total
# TYPE tomcat_global_received_bytes_total counter
tomcat_global_received_bytes_total{application="demo",name="http-nio-8088",} 0.0
# HELP jvm_gc_pause_seconds Time spent in GC pause
# TYPE jvm_gc_pause_seconds summary
jvm_gc_pause_seconds_count{action="end of minor GC",application="demo",cause="Allocation Failure",} 20.0
jvm_gc_pause_seconds_sum{action="end of minor GC",application="demo",cause="Allocation Failure",} 0.832
jvm_gc_pause_seconds_count{action="end of major GC",application="demo",cause="Allocation Failure",} 1.0
jvm_gc_pause_seconds_sum{action="end of major GC",application="demo",cause="Allocation Failure",} 0.869
# HELP jvm_gc_pause_seconds_max Time spent in GC pause
# TYPE jvm_gc_pause_seconds_max gauge
jvm_gc_pause_seconds_max{action="end of minor GC",application="demo",cause="Allocation Failure",} 0.0
jvm_gc_pause_seconds_max{action="end of major GC",application="demo",cause="Allocation Failure",} 0.0
# HELP tomcat_global_error_total
# TYPE tomcat_global_error_total counter
tomcat_global_error_total{application="demo",name="http-nio-8088",} 0.0
# HELP jvm_gc_live_data_size_bytes Size of old generation memory pool after a full GC
# TYPE jvm_gc_live_data_size_bytes gauge
jvm_gc_live_data_size_bytes{application="demo",} 1.6003064E7
# HELP process_start_time_seconds Start time of the process since unix epoch.
# TYPE process_start_time_seconds gauge
process_start_time_seconds{application="demo",} 1.688966915679E9
# HELP jvm_gc_memory_promoted_bytes_total Count of positive increases in the size of the old generation memory pool before GC to after GC
# TYPE jvm_gc_memory_promoted_bytes_total counter
jvm_gc_memory_promoted_bytes_total{application="demo",} 4885840.0
# HELP jvm_threads_states_threads The current number of threads having NEW state
# TYPE jvm_threads_states_threads gauge
jvm_threads_states_threads{application="demo",state="waiting",} 12.0
jvm_threads_states_threads{application="demo",state="blocked",} 0.0
jvm_threads_states_threads{application="demo",state="timed-waiting",} 2.0
jvm_threads_states_threads{application="demo",state="runnable",} 6.0
jvm_threads_states_threads{application="demo",state="new",} 0.0
jvm_threads_states_threads{application="demo",state="terminated",} 0.0
# HELP app_requests_method_count_total
# TYPE app_requests_method_count_total counter
app_requests_method_count_total{application="demo",method="IndexController.index",} 0.0
app_requests_method_count_total{application="demo",method="IndexController.core",} 0.0
# HELP app_online_count
# TYPE app_online_count gauge
app_online_count{application="demo",} 0.0
# HELP jvm_threads_daemon_threads The current number of live daemon threads
# TYPE jvm_threads_daemon_threads gauge
jvm_threads_daemon_threads{application="demo",} 16.0
# HELP system_cpu_count The number of processors available to the Java virtual machine
# TYPE system_cpu_count gauge
system_cpu_count{application="demo",} 1.0
# HELP tomcat_global_sent_bytes_total
# TYPE tomcat_global_sent_bytes_total counter
tomcat_global_sent_bytes_total{application="demo",name="http-nio-8088",} 152151.0
# HELP tomcat_global_request_max_seconds
# TYPE tomcat_global_request_max_seconds gauge
tomcat_global_request_max_seconds{application="demo",name="http-nio-8088",} 5.025
# HELP tomcat_sessions_rejected_sessions_total
# TYPE tomcat_sessions_rejected_sessions_total counter
tomcat_sessions_rejected_sessions_total{application="demo",} 0.0
# HELP jvm_gc_max_data_size_bytes Max size of old generation memory pool
# TYPE jvm_gc_max_data_size_bytes gauge
jvm_gc_max_data_size_bytes{application="demo",} 1.4123008E8
# HELP tomcat_sessions_created_sessions_total
# TYPE tomcat_sessions_created_sessions_total counter
tomcat_sessions_created_sessions_total{application="demo",} 0.0
# HELP logback_events_total Number of error level events that made it to the logs
# TYPE logback_events_total counter
logback_events_total{application="demo",level="debug",} 0.0
logback_events_total{application="demo",level="error",} 0.0
logback_events_total{application="demo",level="trace",} 0.0
logback_events_total{application="demo",level="warn",} 0.0
logback_events_total{application="demo",level="info",} 7.0
# HELP system_load_average_1m The sum of the number of runnable entities queued to available processors and the number of runnable entities running on the available processors averaged over a period of time
# TYPE system_load_average_1m gauge
system_load_average_1m{application="demo",} 4.04
# HELP app_requests_count_total
# TYPE app_requests_count_total counter
app_requests_count_total{application="demo",v1="core",} 0.0
# HELP tomcat_threads_busy_threads
# TYPE tomcat_threads_busy_threads gauge
tomcat_threads_busy_threads{application="demo",name="http-nio-8088",} 1.0
# HELP process_files_max_files The maximum file descriptor count
# TYPE process_files_max_files gauge
process_files_max_files{application="demo",} 1048576.0
# HELP tomcat_global_request_seconds
# TYPE tomcat_global_request_seconds summary
tomcat_global_request_seconds_count{application="demo",name="http-nio-8088",} 14.0
tomcat_global_request_seconds_sum{application="demo",name="http-nio-8088",} 6.911
# HELP jvm_classes_loaded_classes The number of classes that are currently loaded in the Java virtual machine
# TYPE jvm_classes_loaded_classes gauge
jvm_classes_loaded_classes{application="demo",} 8095.0
# HELP tomcat_sessions_active_current_sessions
# TYPE tomcat_sessions_active_current_sessions gauge
tomcat_sessions_active_current_sessions{application="demo",} 0.0
# HELP system_cpu_usage The "recent cpu usage" for the whole system
# TYPE system_cpu_usage gauge
system_cpu_usage{application="demo",} 0.5430894308943089
# HELP jvm_memory_max_bytes The maximum amount of memory in bytes that can be used for memory management
# TYPE jvm_memory_max_bytes gauge
jvm_memory_max_bytes{application="demo",area="nonheap",id="Metaspace",} -1.0
jvm_memory_max_bytes{application="demo",area="nonheap",id="Compressed Class Space",} 1.073741824E9
jvm_memory_max_bytes{application="demo",area="heap",id="Survivor Space",} 7012352.0
jvm_memory_max_bytes{application="demo",area="heap",id="Eden Space",} 5.6557568E7
jvm_memory_max_bytes{application="demo",area="heap",id="Tenured Gen",} 1.4123008E8
jvm_memory_max_bytes{application="demo",area="nonheap",id="Code Cache",} 2.5165824E8
验证成功后,将文件进行打包,并发布,如果在本地安装,则后续配置的项目地址为本地
三、安装Docker
Centos8.2
安装
yum install docker -y
启动
systemctl start docker
开机启动
systemctl enable docker
检查是否安装成功
docker --version
检查返回示例
Emulate Docker CLI using podman. Create /etc/containers/nodocker to quiet msg.
podman version 4.5.1
四、安装Prometheus(Docker)
编写配置文件
prometheus.yml
scrape_configs:
  # 指定当前任务的名称
  - job_name: 'spring'
    # 采集数据间隔时间
    scrape_interval: 15s
    # 采集超时时间
    scrape_timeout: 180s
    # 采集接口路径
    metrics_path: '/actuator/prometheus'
    # 采集服务的地址,SpringBoot项目的地址
    static_configs:
      - targets: ['103.228.171.244:8088', '156.224.25.128:8088']
拉镜像,根据指定的外部配置文件,创建容器并启动
docker run -d -p 9090:9090 -v /buss/prometheus.yml:/etc/prometheus/prometheus.yml --name prometheus prom/prometheus:latest --log.level=debug --storage.tsdb.retention.time=3d --config.file=/etc/prometheus/prometheus.yml
这里拉取时,可能存在多个镜像源地址,当前博主选择的是官网的源地址
如果容器启动,则请求地址
http://103.228.171.244:9090/
请求返回页面示例
五、安装Grafana(Docker)
拉取Grafana镜像
docker pull grafana/grafana
创建容器并启动容器
docker run -d -p 3000:3000 grafana/grafana
如果启动成功,访问页面
http://103.228.171.244:3000/
默认用户名密码
admin
admin
页面示例
如果不成功,查看日志
tail logs -f 容器ID
如果存在问题,可以先删除容器,重新创建并启动
docker rm 容器ID
六、配置和运行测试
点击面板

使用模板引入
输入模板编号4701引入,然后保存模板地址:https://grafana.com/grafana/dashboards/
然后点击标签,回到面板出,点击对应保存的模板
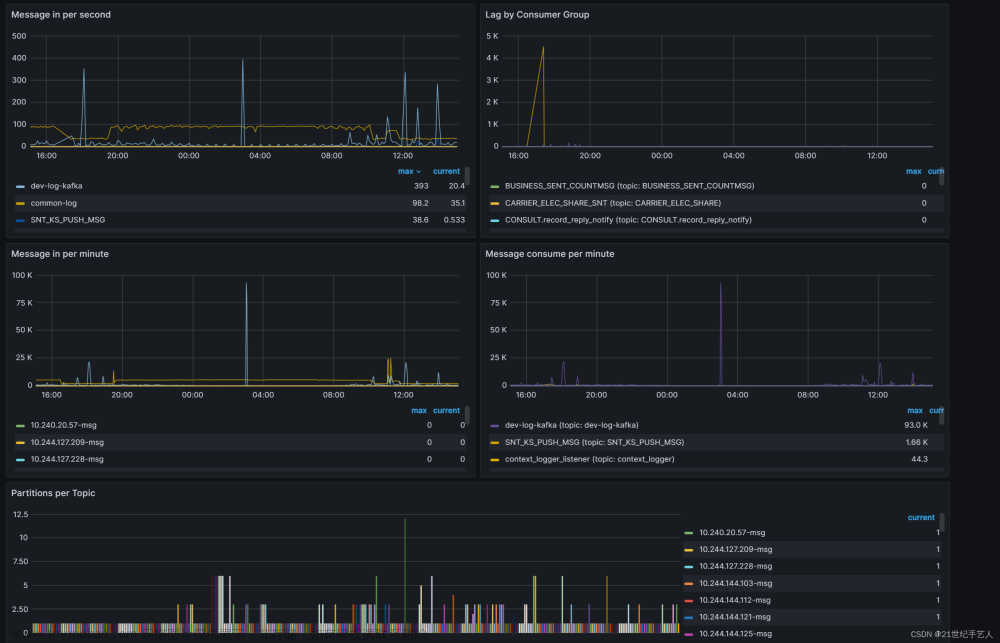
查看效果示例 文章来源:https://www.toymoban.com/news/detail-563178.html
总结
编程是一场永无止境的挑战,每一次成功都是对智慧和毅力的最好证明。文章来源地址https://www.toymoban.com/news/detail-563178.html
到了这里,关于SpringBoot+Prometheus+Grafana 监控面板(项目配置方式【入侵】)的文章就介绍完了。如果您还想了解更多内容,请在右上角搜索TOY模板网以前的文章或继续浏览下面的相关文章,希望大家以后多多支持TOY模板网!