package io.util;
import org.jfree.chart.*;
import org.jfree.chart.axis.*;
import org.jfree.chart.block.BlockBorder;
import org.jfree.chart.labels.StandardCategoryItemLabelGenerator;
import org.jfree.chart.labels.StandardPieSectionLabelGenerator;
import org.jfree.chart.labels.StandardXYItemLabelGenerator;
import org.jfree.chart.plot.*;
import org.jfree.chart.renderer.category.*;
import org.jfree.chart.renderer.xy.CandlestickRenderer;
import org.jfree.chart.renderer.xy.XYBarRenderer;
import org.jfree.chart.renderer.xy.XYItemRenderer;
import org.jfree.chart.renderer.xy.XYSplineRenderer;
import org.jfree.chart.title.LegendTitle;
import org.jfree.chart.title.TextTitle;
import org.jfree.data.category.DefaultCategoryDataset;
import org.jfree.data.category.IntervalCategoryDataset;
import org.jfree.data.gantt.Task;
import org.jfree.data.gantt.TaskSeries;
import org.jfree.data.gantt.TaskSeriesCollection;
import org.jfree.data.general.DefaultPieDataset;
import org.jfree.data.general.SeriesException;
import org.jfree.data.time.Day;
import org.jfree.data.time.Second;
import org.jfree.data.time.TimeSeries;
import org.jfree.data.time.TimeSeriesCollection;
import org.jfree.data.time.ohlc.OHLCSeries;
import org.jfree.data.time.ohlc.OHLCSeriesCollection;
import org.jfree.data.xy.*;
import org.jfree.ui.RectangleEdge;
import java.awt.*;
import java.io.File;
import java.io.IOException;
import java.text.SimpleDateFormat;
import java.util.*;
/**
* @Author: xiaoxin
* @Date: 2022/11/24 11:06
*/
public class JfreeChartUtils {
/**
* 生成的图片存放地址
*/
public static String imagePath = "D://888888888888888888//jfree";
public static void main(String[] args) throws Exception {
// 生成饼图
testPie();
// 生成折线图
testLine();
// 生成柱状图
testBar();
// 生成折线图 多条
testCreateManyLineChart();
// 生成3D柱状图
bar3D();
// 生成气泡图
bubble();
// 生成时序图
sequenceDiagram();
// 生成曲线图
curve();
// 生成环形图
annular();
// 生成区域图
areaChart();
// 生成气泡图2
bubble2();
// 生成分布图
chartPanel();
// 生成联合分类图 折线、柱状图
chartPanel1();
// 生成双轴图
biaxial();
// 生成甘特图
createGanttChart();
// 生成K线图
kImage();
// 生成柱状图-横向
bar3DHx();
}
public static void testPie() {
//如 果不使用Font,中文将显示不出来
Font font = new Font("新宋体", Font.BOLD, 15);
String name[] = {"录播主机", "编码器", "摄像机", "流转码服务器", "腾讯服务器"};
double value[] = {1000, 700, 600, 400, 150};
// 创建数据:饼状图就是名称和值(比例)
Map<String, Double> map = new HashMap<String, Double>();
for (int i = 0; i < name.length; i++) {
map.put(name[i], value[i]);
}
// 创建JFreeChart
JFreeChart chart = createPieChart("故障设备类型比例", map, font);
//在D盘目录下生成图片
File p = new File(imagePath);
if (!p.exists()) {
p.mkdirs();
}
String imageName = System.currentTimeMillis() + "_饼图" + ".jpeg";
File file = new File(p.getPath() + "/" + imageName);
try {
if (file.exists()) {
file.delete();
}
ChartUtilities.saveChartAsJPEG(file, chart, 800, 600);
} catch (IOException e) {
e.printStackTrace();
}
}
public static void testLine() {
//如 果不使用Font,中文将显示不出来
Font font = new Font("新宋体", Font.BOLD, 15);
// 创建数据
Map<String, Map<String, Double>> datas = new HashMap<String, Map<String, Double>>();
String monthArray[] = {"一月", "二月", "三月", "四月", "五月", "六月", "七月", "八月"};
double value[] = {20, 30, 25, 50, 40, 25, 50, 40};
for (int i = 0; i < monthArray.length; i++) {
Map<String, Double> map = new HashMap<String, Double>();
map.put("故障数量", value[i]);
datas.put(monthArray[i], map);
}
JFreeChart chart = createLineChart("故障数量-时间曲线", datas, "月份", "故障次数(次)", font);
//在D盘目录下生成图片
File p = new File(imagePath);
if (!p.exists()) {
p.mkdirs();
}
String imageName = System.currentTimeMillis() + "_折线图" + ".jpeg";
File file = new File(p.getPath() + "/" + imageName);
try {
if (file.exists()) {
file.delete();
}
ChartUtilities.saveChartAsJPEG(file, chart, 800, 600);
} catch (IOException e) {
e.printStackTrace();
}
}
public static void testBar() {
//如 果不使用Font,中文将显示不出来
Font font = new Font("新宋体", Font.BOLD, 15);
// 创建数据
Map<String, Map<String, Double>> datas = new HashMap<String, Map<String, Double>>();
String name[] = {"设备网络掉线", "CPU利用率高", "磁盘占用高", "掉线频率", "内存使用率", "访问量"};
double value[] = {1000, 1300, 1200, 1524, 1247, 6587};
for (int i = 0; i < name.length; i++) {
Map<String, Double> map = new HashMap<String, Double>();
map.put("故障数", value[i]);
datas.put(name[i], map);
}
JFreeChart chart = createBarChart("故障类型比例", datas, "故障类型", "数量单位(个)", font);
//在D盘目录下生成图片
File p = new File(imagePath);
if (!p.exists()) {
p.mkdirs();
}
String imageName = System.currentTimeMillis() + "_柱状图" + ".jpeg";
File file = new File(p.getPath() + "/" + imageName);
try {
if (file.exists()) {
file.delete();
}
ChartUtilities.saveChartAsJPEG(file, chart, 800, 600);
} catch (IOException e) {
e.printStackTrace();
}
}
public static void testCreateManyLineChart() {
String[] title = {"成功量", "失败量", "异常"};
String[] xValue = {"2021-01", "2021-02", "2021-03", "2021-04", "2021-05"};
// 绘图数据集
DefaultCategoryDataset dataSet = new DefaultCategoryDataset();
Random r = new Random();
for (int i = 0; i < title.length; i++) {
for (int j = 0; j < 5; j++) {
// 生成[0,10]区间的整数
int value = r.nextInt(10) * 2;
dataSet.setValue(value, title[i], xValue[j]);
}
}
JFreeChart chart = createManyLineChart(dataSet);
//在D盘目录下生成图片
File p = new File(imagePath);
if (!p.exists()) {
p.mkdirs();
}
String imageName = System.currentTimeMillis() + "_多条折线图" + ".jpeg";
File file = new File(p.getPath() + "/" + imageName);
try {
if (file.exists()) {
file.delete();
}
ChartUtilities.saveChartAsJPEG(file, chart, 800, 600);
} catch (IOException e) {
e.printStackTrace();
}
}
static void sortMap(Map<String, Map<String, Double>> param) {
TreeMap<String, Map<String, Double>> paramTreeMap = new TreeMap<>(param);
System.out.println(paramTreeMap);
}
/**
* 生成饼图
*
* @param title
* @param data
* @param font
* @return
*/
public static JFreeChart createPieChart(String title, Map<String, Double> data, Font font) {
try {
Set<Map.Entry<String, Double>> set = data.entrySet();
DefaultPieDataset pds = new DefaultPieDataset();
Iterator iterator = set.iterator();
Map.Entry entry;
while (iterator.hasNext()) {
entry = (Map.Entry) iterator.next();
pds.setValue(entry.getKey().toString(), Double.parseDouble(entry.getValue().toString()));
}
// 生成一个饼图的图表:显示图表的标题、组装的数据、是否显示图例、是否生成贴士以及是否生成URL链接
JFreeChart chart = ChartFactory.createPieChart(title, pds, true, false, true);
// 设置图片标题的字体
chart.getTitle().setFont(font);
// 得到图块,准备设置标签的字体
PiePlot plot = (PiePlot) chart.getPlot();
//设置分裂效果,需要指定分裂出去的key
// plot.setExplodePercent("摄像机", 0.1); 分裂效果,可选
// 设置标签字体
plot.setLabelFont(font);
// 设置图例项目字体
chart.getLegend().setItemFont(font);
// 设置开始角度
// plot.setStartAngle(new Float(3.14f / 2f)); 开始角度,意义不大
//设置plot的前景色透明度
plot.setForegroundAlpha(0.7f);
//设置plot的背景色透明度
plot.setBackgroundAlpha(0.0f);
//设置标签生成器(默认{0})
//{0}:key {1}:value {2}:百分比 {3}:sum
plot.setLabelGenerator(new StandardPieSectionLabelGenerator("{0}({1})/{2}")); // 一般在{1}后面加单位,如:{0}({1}次)/{2}
//将内存中的图片写到本地硬盘
//ChartUtilities.saveChartAsJPEG(new File("H:/a.png"), chart, 600, 300);
// 标注位于上侧
// chart.getLegend().setPosition(RectangleEdge.TOP);
// 设置标注无边框
chart.getLegend().setFrame(new BlockBorder(Color.WHITE));
return chart;
} catch (Exception e) {
e.printStackTrace();
return null;
}
}
/**
* 生成折线图
*
* @param title
* @param data
* @param type
* @param unit
* @param font
* @return
*/
public static JFreeChart createLineChart(String title, Map<String, Map<String, Double>> data, String type, String unit, Font font) {
try {
DefaultCategoryDataset ds = new DefaultCategoryDataset();
Set<Map.Entry<String, Map<String, Double>>> set1 = data.entrySet();
Iterator iterator1 = set1.iterator();
Iterator iterator2;
HashMap<String, Double> map;
Set<Map.Entry<String, Double>> set2;
Map.Entry entry1;
Map.Entry entry2;
while (iterator1.hasNext()) {
entry1 = (Map.Entry) iterator1.next();
map = (HashMap<String, Double>) entry1.getValue();
set2 = map.entrySet();
iterator2 = set2.iterator();
while (iterator2.hasNext()) {
entry2 = (Map.Entry) iterator2.next();
ds.setValue(Double.parseDouble(entry2.getValue().toString()), entry2.getKey().toString(), entry1.getKey().toString());
}
}
//创建折线图,折线图分水平显示和垂直显示两种
// //2D折线图
JFreeChart chart = ChartFactory.createLineChart(title, type, unit, ds, PlotOrientation.VERTICAL, true, true, true);
//3D折线图,
JFreeChart chart2 = ChartFactory.createLineChart3D(title, type, unit, ds, PlotOrientation.VERTICAL, true, true, false);
//设置整个图片的标题字体
chart.getTitle().setFont(font);
//设置提示条字体
font = new Font("宋体", Font.BOLD, 15);
chart.getLegend().setItemFont(font);
//得到绘图区
CategoryPlot plot = (CategoryPlot) chart.getPlot();
//得到绘图区的域轴(横轴),设置标签的字体
plot.getDomainAxis().setLabelFont(font);
// 设置背景透明度
plot.setBackgroundAlpha(0.1f);
// 设置网格横线颜色
plot.setRangeGridlinePaint(Color.gray);
// 设置网格横线大小
plot.setDomainGridlineStroke(new BasicStroke(0.2F));
plot.setRangeGridlineStroke(new BasicStroke(0.2F));
//设置横轴标签项字体
plot.getDomainAxis().setTickLabelFont(font);
// 生成折线图上的数字
//绘图区域(红色矩形框的部分)
LineAndShapeRenderer lineAndShapeRenderer = (LineAndShapeRenderer) plot.getRenderer();
lineAndShapeRenderer.setBaseItemLabelGenerator(new StandardCategoryItemLabelGenerator());
//设置图表上的数字可见
lineAndShapeRenderer.setBaseItemLabelsVisible(true);
//设置图表上的数字字体
lineAndShapeRenderer.setBaseItemLabelFont(new Font("宋体", Font.BOLD, 15));
//设置折线图拐角上的正方形
//创建一个正方形
Rectangle shape = new Rectangle(4, 4);
lineAndShapeRenderer.setSeriesShape(0, shape);
//设置拐角上图形可见
lineAndShapeRenderer.setSeriesShapesVisible(0, true);
/*// 获取显示线条的对象
LineAndShapeRenderer lasp = (LineAndShapeRenderer) plot.getRenderer();
// 设置拐点是否可见/是否显示拐点
lasp.setBaseShapesVisible(true);
// 设置拐点不同用不同的形状
lasp.setDrawOutlines(true);
// 设置线条是否被显示填充颜色
lasp.setUseFillPaint(true);
// 设置拐点颜色
lasp.setBaseFillPaint(Color.blue);//蓝色*/
//设置范围轴(纵轴)字体
font = new Font("宋体", Font.BOLD, 18);
plot.getRangeAxis().setLabelFont(font);
// plot.setForegroundAlpha(1.0f);
return chart;
} catch (Exception e) {
e.printStackTrace();
return null;
}
}
/**
* 生成折线图 多条
*
* @return
*/
public static JFreeChart createManyLineChart(DefaultCategoryDataset dataSet) {
//如果把createLineChart改为createLineChart3D就变为了3D效果的折线图
JFreeChart chart = ChartFactory.createLineChart("图表标题", "X轴标题", "Y轴标题", dataSet,
PlotOrientation.VERTICAL, // 绘制方向
true, // 显示图例
true, // 采用标准生成器
false // 是否生成超链接
);
//如 果不使用Font,中文将显示不出来
Font font = new Font("新宋体", Font.BOLD, 15);
chart.getTitle().setFont(font); // 设置标题字体
chart.getLegend().setItemFont(font);// 设置图例类别字体
// chart.setBackgroundPaint();// 设置背景色
//获取绘图区对象
CategoryPlot plot = chart.getCategoryPlot();
plot.setBackgroundPaint(Color.LIGHT_GRAY); // 设置绘图区背景色
plot.setRangeGridlinePaint(Color.gray); // 设置水平方向背景线颜色
// 设置背景透明度
plot.setBackgroundAlpha(0.1f);
// 设置网格横线颜色
plot.setRangeGridlinePaint(Color.gray);
// 设置网格横线大小
plot.setDomainGridlineStroke(new BasicStroke(0.2F));
plot.setRangeGridlineStroke(new BasicStroke(0.2F));
plot.setRangeGridlinesVisible(true);// 设置是否显示水平方向背景线,默认值为true
plot.setDomainGridlinePaint(Color.WHITE); // 设置垂直方向背景线颜色
plot.setDomainGridlinesVisible(true); // 设置是否显示垂直方向背景线,默认值为false
CategoryAxis domainAxis = plot.getDomainAxis();
domainAxis.setLabelFont(font); // 设置横轴字体
domainAxis.setTickLabelFont(font);// 设置坐标轴标尺值字体
domainAxis.setLowerMargin(0.01);// 左边距 边框距离
domainAxis.setUpperMargin(0.06);// 右边距 边框距离,防止最后边的一个数据靠近了坐标轴。
domainAxis.setMaximumCategoryLabelLines(2);
ValueAxis rangeAxis = plot.getRangeAxis();
rangeAxis.setLabelFont(font);
rangeAxis.setStandardTickUnits(NumberAxis.createIntegerTickUnits());//Y轴显示整数
rangeAxis.setAutoRangeMinimumSize(1); //最小跨度
rangeAxis.setUpperMargin(0.18);//上边距,防止最大的一个数据靠近了坐标轴。
rangeAxis.setLowerBound(0); //最小值显示0
rangeAxis.setAutoRange(false); //不自动分配Y轴数据
rangeAxis.setTickMarkStroke(new BasicStroke(1.6f)); // 设置坐标标记大小
rangeAxis.setTickMarkPaint(Color.BLACK); // 设置坐标标记颜色
// 获取折线对象
LineAndShapeRenderer renderer = (LineAndShapeRenderer) plot.getRenderer();
BasicStroke realLine = new BasicStroke(1.8f); // 设置实线
// 设置虚线
float dashes[] = {5.0f};
BasicStroke brokenLine = new BasicStroke(2.2f, // 线条粗细
BasicStroke.CAP_ROUND, // 端点风格
BasicStroke.JOIN_ROUND, // 折点风格
8f, dashes, 0.6f);
for (int i = 0; i < dataSet.getRowCount(); i++) {
if (i % 2 == 0) {
renderer.setSeriesStroke(i, realLine); // 利用实线绘制
} else {
renderer.setSeriesStroke(i, brokenLine); // 利用虚线绘制
}
// 生成折线图上的数字
//绘图区域(红色矩形框的部分)
renderer.setBaseItemLabelGenerator(new StandardCategoryItemLabelGenerator());
//设置图表上的数字可见
renderer.setBaseItemLabelsVisible(true);
//设置图表上的数字字体
renderer.setBaseItemLabelFont(new Font("宋体", Font.BOLD, 15));
//设置折线图拐角上的正方形
//创建一个正方形
Rectangle shape = new Rectangle(4, 4);
renderer.setSeriesShape(0, shape);
//设置拐角上图形可见
renderer.setSeriesShapesVisible(0, true);
}
plot.setNoDataMessage("无对应的数据,请重新查询。");
plot.setNoDataMessageFont(font);//字体的大小
plot.setNoDataMessagePaint(Color.RED);//字体颜色
return chart;
}
/**
* 生成柱状图
*
* @param title
* @param data
* @param type
* @param danwei
* @param font
* @return
*/
public static JFreeChart createBarChart(String title, Map<String, Map<String, Double>> data, String type, String danwei, Font font) {
try {
//种类数据集
DefaultCategoryDataset ds = new DefaultCategoryDataset();
//获取迭代器:
Set<Map.Entry<String, Map<String, Double>>> set1 = data.entrySet();
Iterator iterator1 = set1.iterator();
Iterator iterator2;
HashMap<String, Double> map;
Set<Map.Entry<String, Double>> set2;
Map.Entry entry1;
Map.Entry entry2;
while (iterator1.hasNext()) {
entry1 = (Map.Entry) iterator1.next();
map = (HashMap<String, Double>) entry1.getValue();
set2 = map.entrySet();
iterator2 = set2.iterator();
while (iterator2.hasNext()) {
entry2 = (Map.Entry) iterator2.next();
ds.setValue(Double.parseDouble(entry2.getValue().toString()), entry2.getKey().toString(), entry1.getKey().toString());
}
}
//创建柱状图,柱状图分水平显示和垂直显示两种
JFreeChart chart = ChartFactory.createBarChart(title, type, danwei, ds, PlotOrientation.VERTICAL, true, true, true);
//设置整个图片的标题字体
chart.getTitle().setFont(font);
//设置提示条字体
font = new Font("宋体", Font.BOLD, 15);
chart.getLegend().setItemFont(font);
//得到绘图区
CategoryPlot plot = (CategoryPlot) chart.getPlot();
//得到绘图区的域轴(横轴),设置标签的字体
plot.getDomainAxis().setLabelFont(font);
//获取X轴的对象
// CategoryAxis categoryAxis = plot.getDomainAxis();
// 设置X轴文本倾斜45度
// categoryAxis.setCategoryLabelPositions(CategoryLabelPositions.UP_45);
// 设置背景透明度
plot.setBackgroundAlpha(0.1f);
// 设置网格横线颜色
plot.setRangeGridlinePaint(Color.gray);
// 设置网格横线大小
plot.setDomainGridlineStroke(new BasicStroke(0.2F));
plot.setRangeGridlineStroke(new BasicStroke(0.2F));
//设置横轴标签项字体
plot.getDomainAxis().setTickLabelFont(font);
// 设置柱状图柱子相关
CategoryPlot categoryPlot = chart.getCategoryPlot();
BarRenderer rendererBar = (BarRenderer) categoryPlot.getRenderer();
// 柱子宽度
rendererBar.setMaximumBarWidth(0.05);
// 柱状图颜色
rendererBar.setSeriesPaint(0, Color.decode("#005AB5"));
// 设置柱子上显示值
rendererBar.setBaseItemLabelsVisible(true);
rendererBar.setSeriesItemLabelFont(0, font);
//设置范围轴(纵轴)字体
plot.getRangeAxis().setLabelFont(font);
plot.setForegroundAlpha(1.0f);
return chart;
} catch (Exception e) {
e.printStackTrace();
return null;
}
}
/**
* 生成3D柱状图
*/
public static void bar3D() {
/* final String fait = "菲亚特";
final String audi = "奥迪";
final String ford = "福特";
final String speed = "速度";
final String popular = "喜欢程度";
final String mailage = "邮寄";
final String userrating = "用户评价";
final String safty = "安全性";
final DefaultCategoryDataset dataset = new DefaultCategoryDataset( );
dataset.addValue( 1.0 , fait , speed );
dataset.addValue( 4.0 , fait , popular );
dataset.addValue( 3.0 , fait , userrating );
dataset.addValue( 5.0 , fait , mailage );
dataset.addValue( 5.0 , fait , safty );
dataset.addValue( 5.0 , audi , speed );
dataset.addValue( 7.0 , audi , popular );
dataset.addValue( 6.0 , audi , userrating );
dataset.addValue( 10.0 , audi , mailage );
dataset.addValue( 4.0 , audi , safty );
dataset.addValue( 4.0 , ford , speed );
dataset.addValue( 3.0 , ford , popular );
dataset.addValue( 2.0 , ford , userrating );
dataset.addValue( 3.0 , ford , mailage );
dataset.addValue( 6.0 , ford , safty );*/
// 行关键字
String seriesArray[] = {"菲亚特", "奥迪", "福特"};
// 列关键字
String categoryArray[] = {"速度", "喜欢程度", "邮寄", "用户评价", "安全性", "使用性"};
// 对应的值
int value[] = {310, 489, 512, 589, 359, 402, 501, 200, 308, 580, 418, 315, 480, 381, 264, 185, 209, 302};
// 创建分类数据集
DefaultCategoryDataset dataset = new DefaultCategoryDataset();
int data = 0;
for (int i = 0; i < 3; i++) {
for (int j = 0; j < 6; j++) {
dataset.addValue(value[data], seriesArray[i], categoryArray[j]);
data++;
}
}
// 设置字体,去除中文乱码
StandardChartTheme sct = new StandardChartTheme("CN");
sct.setExtraLargeFont(new Font("宋体", Font.LAYOUT_LEFT_TO_RIGHT, 15));
sct.setRegularFont(new Font("宋体", Font.LAYOUT_LEFT_TO_RIGHT, 15));
sct.setLargeFont(new Font("宋体", Font.LAYOUT_LEFT_TO_RIGHT, 15));
ChartFactory.setChartTheme(sct);
JFreeChart chart = ChartFactory.createBarChart3D(
"汽车使用统计",
"",// 类别
"", // 值
dataset,
PlotOrientation.VERTICAL,
true, true, false);
//得到绘图区
CategoryPlot plot = (CategoryPlot) chart.getPlot();
/*//获取X轴的对象
// CategoryAxis categoryAxis = plot.getDomainAxis();
// 设置X轴文本倾斜45度
// categoryAxis.setCategoryLabelPositions(CategoryLabelPositions.UP_45);
// 设置背景透明度
plot.setBackgroundAlpha(0.1f);
// 设置网格横线颜色
plot.setRangeGridlinePaint(Color.gray);*/ // 注释的代码放开就是背景透明
/* // 注释的是设置显示数值
BarRenderer renderer = new BarRenderer();
renderer.setBarPainter(new StandardBarPainter());// 取消渐变效果
renderer.setShadowVisible(false);// 关闭倒影
renderer.setDrawBarOutline(false); // 设置柱子边框可见
renderer.setItemMargin(0.03); // 组内柱子间隔为组宽的10%
renderer.setMaximumBarWidth(0.03);// 设置条形柱最大宽度
renderer.setMinimumBarLength(0.03);// 设置条形柱最小宽度
renderer.setBaseItemLabelGenerator(new StandardCategoryItemLabelGenerator());// 数据标签格式
renderer.setBaseItemLabelsVisible(true);// 是否显示数据标签
renderer.setSeriesPaint(0, Color.BLUE);
plot.setRenderer(renderer);*/
int width = 640;
int height = 480;
// 标注位于上侧
chart.getLegend().setPosition(RectangleEdge.TOP);
// 设置标注无边框
chart.getLegend().setFrame(new BlockBorder(Color.WHITE));
//在D盘目录下生成图片
File p = new File(imagePath);
if (!p.exists()) {
p.mkdirs();
}
String imageName = System.currentTimeMillis() + "_3D柱状图" + ".jpeg";
File file = new File(p.getPath() + "/" + imageName);
try {
if (file.exists()) {
file.delete();
}
ChartUtilities.saveChartAsJPEG(file, chart, width, height);
} catch (IOException e) {
e.printStackTrace();
}
}
/**
* 生成气泡图
*/
public static void bubble() {
DefaultXYZDataset defaultxyzdataset = new DefaultXYZDataset();
double ad[] = {30, 40, 50, 60, 70, 80};
double ad1[] = {10, 20, 30, 40, 50, 60};
double ad2[] = {4, 5, 10, 8, 9, 6};
double ad3[][] = {ad, ad1, ad2};
defaultxyzdataset.addSeries("系统1", ad3);
JFreeChart jfreechart = ChartFactory.createBubbleChart(
"年龄、体重和工作",
"重量",
"年龄",
defaultxyzdataset,
PlotOrientation.HORIZONTAL,
true, true, false);
XYPlot xyplot = (XYPlot) jfreechart.getPlot();
xyplot.setForegroundAlpha(0.65F);
XYItemRenderer xyitemrenderer = xyplot.getRenderer();
xyitemrenderer.setSeriesPaint(0, Color.blue);
NumberAxis numberaxis = (NumberAxis) xyplot.getDomainAxis();
numberaxis.setLowerMargin(0.2);
numberaxis.setUpperMargin(0.5);
NumberAxis numberAxis = (NumberAxis) xyplot.getRangeAxis();
numberAxis.setLowerMargin(0.8);
numberAxis.setUpperMargin(0.9);
/*// 设置背景透明度
xyplot.setBackgroundAlpha(0.1f);
// 设置网格横线颜色
xyplot.setRangeGridlinePaint(Color.gray);*/ // 注释的代码是设置背景透明度
int width = 560;
int height = 370;
//在D盘目录下生成图片
File p = new File(imagePath);
if (!p.exists()) {
p.mkdirs();
}
String imageName = System.currentTimeMillis() + "_气泡图" + ".jpeg";
File file = new File(p.getPath() + "/" + imageName);
try {
if (file.exists()) {
file.delete();
}
ChartUtilities.saveChartAsJPEG(file, jfreechart, width, height);
} catch (IOException e) {
e.printStackTrace();
}
}
/**
* 生成时序图
*/
public static void sequenceDiagram() {
final TimeSeries series = new TimeSeries("Random Data");
Second current = new Second();
double value = 100.0;
for (int i = 0; i < 4000; i++) {
try {
value = value + Math.random() - 0.5;
series.add(current, new Double(value));
current = (Second) current.next();
} catch (SeriesException e) {
System.err.println("Error adding to series");
}
}
final XYDataset dataset = (XYDataset) new TimeSeriesCollection(series);
JFreeChart timeChart = ChartFactory.createTimeSeriesChart(
"计算测试",
"秒数",
"值",
dataset,
false,
false,
false);
/*XYPlot xyplot = ( XYPlot )timeChart.getPlot( );
// 设置背景透明度
xyplot.setBackgroundAlpha(0.1f);
// 设置网格横线颜色
xyplot.setRangeGridlinePaint(Color.gray);*/ // 注释的代码是设置背景透明度
int width = 560;
int height = 370;
//在D盘目录下生成图片
File p = new File(imagePath);
if (!p.exists()) {
p.mkdirs();
}
String imageName = System.currentTimeMillis() + "_时序图" + ".jpeg";
File file = new File(p.getPath() + "/" + imageName);
try {
if (file.exists()) {
file.delete();
}
ChartUtilities.saveChartAsJPEG(file, timeChart, width, height);
} catch (IOException e) {
e.printStackTrace();
}
}
/**
* 生成曲线图
*/
public static void curve() {
//如 果不使用Font,中文将显示不出来
Font font = new Font("宋体", Font.BOLD, 25);
// 数据
XYSeries series = new XYSeries("2020年");
series.add(01, 3542);
series.add(02, 3692);
series.add(03, 8542);
series.add(04, 5742);
XYSeries series1 = new XYSeries("2021年");
series1.add(01, 1242);
series1.add(02, 2612);
series1.add(03, 1942);
series1.add(04, 4612);
XYSeriesCollection xySeriesCollection = new XYSeriesCollection();
xySeriesCollection.addSeries(series);
xySeriesCollection.addSeries(series1);
StandardChartTheme standardChartTheme = new StandardChartTheme("CN"); // 创建主题样式
standardChartTheme.setExtraLargeFont(font); // 设置标题字体
standardChartTheme.setRegularFont(font); // 设置图例的字体
standardChartTheme.setLargeFont(font); // 设置轴向的字体
standardChartTheme.setChartBackgroundPaint(Color.WHITE);// 设置主题背景色
ChartFactory.setChartTheme(standardChartTheme);// 应用主题样式
// 定义图表对象 图表的标题-饼形图的数据集对象-是否显示图列-是否显示提示文-是否生成超链接
JFreeChart chart = ChartFactory.createXYLineChart("年度绩效", "季度", "销售额", xySeriesCollection,
PlotOrientation.VERTICAL, true, true, false);
// chart.setTitle(new TextTitle(title[0], new Font("宋书", Font.BOLD, 64)));// 重新设置标题
// chart.removeLegend();// 是否移除图例
XYPlot plot = (XYPlot) chart.getPlot(); // 获得图表显示对象
plot.setOutlineVisible(false);// 是否显示外边框
plot.setOutlinePaint(Color.WHITE);// 外边框颜色
// plot.setOutlineStroke(new BasicStroke(2.f));// 外边框框线粗细
plot.setBackgroundPaint(Color.WHITE);// 白色背景
plot.setNoDataMessage("无图表数据");// 无数据提示
plot.setNoDataMessageFont(font);// 提示字体
plot.setNoDataMessagePaint(Color.RED);// 提示字体颜色
// 图例
LegendTitle legend = chart.getLegend();// 图例对象
legend.setPosition(RectangleEdge.BOTTOM);// 图例位置 上、下、左、右
legend.setVisible(true);// 是否显示图例
legend.setBorder(BlockBorder.NONE);// 图例无边框
legend.setItemFont(font);// 图例大小
// 网格线
plot.setDomainGridlinePaint(Color.BLUE);
plot.setDomainGridlinesVisible(true);// 竖线
plot.setRangeGridlinePaint(Color.BLACK);
plot.setRangeGridlinesVisible(true);// 横线
// 横坐标
NumberAxis xAxis = (NumberAxis) plot.getDomainAxis();// 获得横坐标
xAxis.setTickLabelFont(font);// 设置X轴字体
xAxis.setLabelFont(font);// 轴标签值字体
xAxis.setTickLabelFont(font);// 轴标签字体
xAxis.setAxisLineStroke(new BasicStroke(2f)); // 设置轴线粗细
xAxis.setAxisLinePaint(Color.BLACK);// 轴线颜色
xAxis.setLowerMargin(0.03D);// 左侧边距
xAxis.setUpperMargin(0.03D);// 右侧边距
xAxis.setTickUnit(new NumberTickUnit(1D));// 间距1D
// 纵坐标
ValueAxis yAxis = plot.getRangeAxis();
yAxis.setTickLabelFont(font);// 设置y轴字体
yAxis.setLabelFont(font);// 设置X轴标签字体
yAxis.setAxisLineStroke(new BasicStroke(1f)); // 设置y轴线粗细
yAxis.setAxisLinePaint(Color.BLACK);// 轴线颜色
yAxis.setUpperMargin(0.18D);// 上边距
yAxis.setLowerMargin(0.1D);// 下边距
// 标签
XYSplineRenderer renderer = new XYSplineRenderer();
renderer.setItemLabelGenerator(new StandardXYItemLabelGenerator());
renderer.setBaseItemLabelsVisible(true); // 基本项标签显示
renderer.setBaseShapesVisible(true);
renderer.setShapesFilled(Boolean.TRUE); // 在数据点显示实心的小图标
renderer.setShapesVisible(true); // 设置显示小图标
renderer.setItemLabelFont(font);// 设置数字的字体大小
renderer.setStroke(new BasicStroke(4f));
plot.setRenderer(renderer);
//在D盘目录下生成图片
int width = 1800;
int height = 800;
File p = new File(imagePath);
if (!p.exists()) {
p.mkdirs();
}
String imageName = System.currentTimeMillis() + "_曲线图" + ".jpeg";
File file = new File(p.getPath() + "/" + imageName);
try {
if (file.exists()) {
file.delete();
}
ChartUtilities.saveChartAsJPEG(file, chart, width, height);
} catch (IOException e) {
e.printStackTrace();
}
}
/**
* 生成环形图
*/
public static void annular() {
DefaultPieDataset dataSet = new DefaultPieDataset();
int i, j;
String[] key = {"私募股权", "房地产", "基金", "现金宝宝", "股票"};
int[] value = {150, 20, 325, 78, 105};
for (i = 0, j = 0; i < key.length && j < value.length; i++, j++) {
dataSet.setValue(key[i], value[j]);
}
JFreeChart chart = ChartFactory.createRingChart("2021年收入", dataSet, true, false, false);
// 设置显示标注
chart.getLegend().setVisible(true);
Font font = new Font("宋体", Font.BOLD, 15);
chart.getLegend().setItemFont(font);
// 标注位于上侧
// chart.getLegend().setPosition(RectangleEdge.TOP);
// 设置标注无边框
chart.getLegend().setFrame(new BlockBorder(Color.WHITE));
// 环形图
RingPlot ringplot = (RingPlot) chart.getPlot();
ringplot.setOutlineVisible(false);
//{2}表示显示百分比 //{0}:key {1}:value {2}:百分比 {3}:sum
ringplot.setLabelGenerator(new StandardPieSectionLabelGenerator("{0}:{1}"));
ringplot.setBackgroundPaint(new Color(253, 253, 253));
ringplot.setOutlineVisible(false);
/*//设置标签样式
ringplot.setLabelFont(new Font("宋体", Font.BOLD, 15));
ringplot.setSimpleLabels(true);
ringplot.setLabelLinkPaint(Color.WHITE);
ringplot.setLabelOutlinePaint(Color.WHITE);
ringplot.setLabelLinksVisible(false);
ringplot.setLabelShadowPaint(null);
ringplot.setLabelOutlinePaint(new Color(0,true));
ringplot.setLabelBackgroundPaint(new Color(0,true));
ringplot.setLabelPaint(Color.WHITE);*/
ringplot.setSectionOutlinePaint(Color.WHITE);
ringplot.setSeparatorsVisible(true);
ringplot.setSeparatorPaint(Color.WHITE);
ringplot.setShadowPaint(new Color(253, 253, 253));
// 设置深度,即带颜⾊圆环的宽度
ringplot.setSectionDepth(0.4);
ringplot.setStartAngle(90);
// 指定颜色
ringplot.setDrawingSupplier(new DefaultDrawingSupplier(
new Paint[]{
new Color(134, 212, 222),
new Color(174, 145, 195),
new Color(255, 162, 195),
new Color(249, 163, 86),
new Color(119, 173, 195)
},
DefaultDrawingSupplier.DEFAULT_OUTLINE_PAINT_SEQUENCE,
DefaultDrawingSupplier.DEFAULT_STROKE_SEQUENCE,
DefaultDrawingSupplier.DEFAULT_OUTLINE_STROKE_SEQUENCE,
DefaultDrawingSupplier.DEFAULT_SHAPE_SEQUENCE));
//在D盘目录下生成图片
int width = 800;
int height = 600;
File p = new File(imagePath);
if (!p.exists()) {
p.mkdirs();
}
String imageName = System.currentTimeMillis() + "_环形图" + ".jpeg";
File file = new File(p.getPath() + "/" + imageName);
try {
if (file.exists()) {
file.delete();
}
ChartUtilities.saveChartAsJPEG(file, chart, width, height);
} catch (IOException e) {
e.printStackTrace();
}
}
/**
* 生成区域图
*/
public static void areaChart() {
// 行关键字
String seriesArray[] = {"JAVA图书", "Android图书", "PHP图书"};
// 列关键字
String categoryArray[] = {"1月", "2月", "3月", "4月", "5月", "6月"};
// 对应的值
int value[] = {310, 489, 512, 589, 359, 402, 501, 200, 308, 580, 418, 315, 480, 381, 264, 185, 209, 302};
// 创建分类数据集
DefaultCategoryDataset dataset = new DefaultCategoryDataset();
int data = 0;
for (int i = 0; i < 3; i++) {
for (int j = 0; j < 6; j++) {
dataset.addValue(value[data], seriesArray[i], categoryArray[j]);
data++;
}
}
// 创建区域图对象
JFreeChart chart = ChartFactory.createAreaChart(
"2018年上半年销售量",// 图表标题
"月份", // X轴标签
"销售量(单位:本)",// Y轴标签
dataset, // 数据集
PlotOrientation.VERTICAL,// 图表方向为垂直方向
true, // 是否显示图例
false, // 是否生成工具
false // 是否生成URL链接
);
Font font = new Font("宋体", Font.BOLD, 15);
// 标题
TextTitle textTitle = chart.getTitle();
textTitle.setFont(new Font("宋体", Font.PLAIN, 20));
// 图例
LegendTitle legendTitle = chart.getLegend();
legendTitle.setItemFont(new Font("宋体", Font.PLAIN, 14));
CategoryPlot categoryPlot = chart.getCategoryPlot();
// 图表
CategoryAxis categoryAxis = categoryPlot.getDomainAxis();
categoryAxis.setTickLabelFont(font); // X轴字体
categoryAxis.setLabelFont(font); // X轴标签字体
ValueAxis valueAxis = categoryPlot.getRangeAxis(); // Y轴对象
valueAxis.setTickLabelFont(font); // Y轴字体
valueAxis.setLabelFont(font); // Y轴标签字体
categoryPlot.setForegroundAlpha(0.5f);
//得到绘图区
CategoryPlot plot = (CategoryPlot) chart.getPlot();
//得到绘图区的域轴(横轴),设置标签的字体
plot.getDomainAxis().setLabelFont(font);
// 设置背景透明度
plot.setBackgroundAlpha(0.1f);
// 设置网格横线颜色
plot.setRangeGridlinePaint(Color.gray);
// 设置网格横线大小
plot.setDomainGridlineStroke(new BasicStroke(0.2F));
plot.setRangeGridlineStroke(new BasicStroke(0.2F));
chart.getLegend().setItemFont(font);
// 标注位于上侧
// chart.getLegend().setPosition(RectangleEdge.TOP);
// 设置标注无边框
chart.getLegend().setFrame(new BlockBorder(Color.WHITE));
//在D盘目录下生成图片
int width = 800;
int height = 600;
File p = new File(imagePath);
if (!p.exists()) {
p.mkdirs();
}
String imageName = System.currentTimeMillis() + "_区域图" + ".jpeg";
File file = new File(p.getPath() + "/" + imageName);
try {
if (file.exists()) {
file.delete();
}
ChartUtilities.saveChartAsJPEG(file, chart, width, height);
} catch (IOException e) {
e.printStackTrace();
}
}
/**
* 生成气泡图2
*/
public static void bubble2() {
// 系列关键字
String seriesArray[] = {"JAVA图书", "Android图书", "PHP图书"};
// 创建分类数据集
DefaultXYZDataset dataset = new DefaultXYZDataset();
double data1[][] = new double[][]{{600}, {10}, {600 / (10 * 10)}};
double data2[][] = new double[][]{{650}, {10}, {650 / (10 * 10)}};
double data3[][] = new double[][]{{800}, {16}, {800 / (16 * 10)}};
for (int i = 0; i < seriesArray.length; i++) {
dataset.addSeries(seriesArray[i], i == 0 ? data1 : i == 1 ? data2 : data3);
}
JFreeChart chart = ChartFactory.createBubbleChart(
"2018年上半年销售量", // 图表标题
"页数", // X轴标签
"章数", // Y轴标签
dataset, // 数据集
PlotOrientation.VERTICAL,// 图表方向为垂直方向
true, // 是否显示图例
false, // 是否生成工具
false // 是否生成URL链接
);
Font font = new Font("宋体", Font.BOLD, 15);
// 标题
TextTitle textTitle = chart.getTitle();
textTitle.setFont(new Font("宋体", Font.PLAIN, 20));
LegendTitle legendTitle = chart.getLegend();
// 图例
legendTitle.setItemFont(new Font("宋体", Font.PLAIN, 14));
XYPlot plot = chart.getXYPlot();
// 获取气泡图区域对象
NumberAxis domainAxis = (NumberAxis) plot.getDomainAxis();
// X轴对象
domainAxis.setLabelFont(new Font("宋体", Font.PLAIN, 14));
NumberAxis rangeAxis = (NumberAxis) plot.getRangeAxis();
// Y轴对象
rangeAxis.setLabelFont(new Font("宋体", Font.PLAIN, 14));
plot.setForegroundAlpha(0.4f);
// 设置背景透明度
plot.setBackgroundAlpha(0.1f);
// 设置网格横线颜色
plot.setRangeGridlinePaint(Color.gray); // 注释的代码是设置背景透明度
chart.getLegend().setItemFont(font);
// 标注位于上侧
// chart.getLegend().setPosition(RectangleEdge.TOP);
// 设置标注无边框
chart.getLegend().setFrame(new BlockBorder(Color.WHITE));
//在D盘目录下生成图片
int width = 800;
int height = 600;
File p = new File(imagePath);
if (!p.exists()) {
p.mkdirs();
}
String imageName = System.currentTimeMillis() + "_气泡图2" + ".jpeg";
File file = new File(p.getPath() + "/" + imageName);
try {
if (file.exists()) {
file.delete();
}
ChartUtilities.saveChartAsJPEG(file, chart, width, height);
} catch (IOException e) {
e.printStackTrace();
}
}
/**
* 生成分布图
*/
public static void chartPanel() {
// 行关键字
String seriesArray[] = {"JAVA图书", "Android图书", "PHP图书"};
// 列关键字
String categoryArray[] = {"1月", "2月", "3月", "4月", "5月", "6月"};
// 对应的值
int value[] = {310, 489, 512, 589, 359, 402, 501, 200, 308, 580, 418, 315, 480, 381, 264, 185, 209, 302};
// 创建分类数据集
DefaultCategoryDataset dataset = new DefaultCategoryDataset();
int data = 0;
for (int i = 0; i < 3; i++) {
for (int j = 0; j < 6; j++) {
dataset.addValue(value[data], seriesArray[i], categoryArray[j]);
data++;
}
}
CategoryItemRenderer renderer = new CategoryStepRenderer(true); // 分布图渲染对象
renderer.setSeriesStroke(0, new BasicStroke(5)); // 将第一行数据线条加粗
CategoryAxis domainAxis = new CategoryAxis("月份"); // 创建X轴
domainAxis.setTickLabelFont(new Font("宋体", Font.PLAIN, 14)); // X轴字体
domainAxis.setLabelFont(new Font("宋体", Font.PLAIN, 14)); // X轴标签字体
ValueAxis rangeAxis = new NumberAxis("销售量(单位:本)"); // 创建Y轴
rangeAxis.setTickLabelFont(new Font("宋体", Font.PLAIN, 14)); // Y轴字体
rangeAxis.setLabelFont(new Font("宋体", Font.PLAIN, 14)); // Y轴标签字
// 创建区域对象
CategoryPlot plot = new CategoryPlot(dataset, domainAxis, rangeAxis, renderer);
JFreeChart chart = new JFreeChart("2018年上半年销售量", plot); // 生成图表
TextTitle textTitle = chart.getTitle(); // 标题
textTitle.setFont(new Font("宋体", Font.PLAIN, 20));
LegendTitle legendTitle = chart.getLegend(); // 图例
legendTitle.setItemFont(new Font("宋体", Font.PLAIN, 14));
Font font = new Font("宋体", Font.BOLD, 15);
//得到绘图区的域轴(横轴),设置标签的字体
plot.getDomainAxis().setLabelFont(font);
// 设置背景透明度
plot.setBackgroundAlpha(0.1f);
// 设置网格横线颜色
plot.setRangeGridlinePaint(Color.gray);
// 设置网格横线大小
plot.setDomainGridlineStroke(new BasicStroke(0.2F));
plot.setRangeGridlineStroke(new BasicStroke(0.2F));
chart.getLegend().setItemFont(font);
// 标注位于上侧
// chart.getLegend().setPosition(RectangleEdge.TOP);
// 设置标注无边框
chart.getLegend().setFrame(new BlockBorder(Color.WHITE));
//在D盘目录下生成图片
int width = 800;
int height = 600;
File p = new File(imagePath);
if (!p.exists()) {
p.mkdirs();
}
String imageName = System.currentTimeMillis() + "_分布图" + ".jpeg";
File file = new File(p.getPath() + "/" + imageName);
try {
if (file.exists()) {
file.delete();
}
ChartUtilities.saveChartAsJPEG(file, chart, width, height);
} catch (IOException e) {
e.printStackTrace();
}
}
/**
* 联合分类图 折线、柱状
*/
public static void chartPanel1() {
// 行关键字
String seriesArray[] = {"JAVA图书", "Android图书", "PHP图书"};
// 列关键字
String categoryArray[] = {"1月", "2月", "3月", "4月", "5月", "6月"};
// 对应的值
int value[] = {310, 489, 512, 589, 359, 402, 501, 200, 308, 580, 418, 315, 480, 381, 264, 185, 209, 302};
// 创建分类数据集
DefaultCategoryDataset dataset = new DefaultCategoryDataset();
int data = 0;
for (int i = 0; i < 3; i++) {
for (int j = 0; j < 6; j++) {
dataset.addValue(value[data], seriesArray[i], categoryArray[j]);
data++;
}
}
LineAndShapeRenderer renderer1 = new LineAndShapeRenderer(); // 生成线形图渲染
BarRenderer renderer2 = new BarRenderer(); // 生成柱形图渲染
// 区域图渲染
AreaRenderer renderer3 = new AreaRenderer();
CategoryAxis domainAxis = new CategoryAxis("月份"); // 设置X轴
NumberAxis rangeAxis = new NumberAxis("销售量(单位:本)"); // 设置Y轴
//设置Y轴 字体和颜色
rangeAxis.setLabelFont(new Font("黑体", Font.PLAIN, 12));
rangeAxis.setLabelPaint(Color.BLUE); // 字体颜色
rangeAxis.setTickLabelFont(new Font("黑体", Font.PLAIN, 12));
// 使用同样的数据,创建不同图表区域对象
CategoryPlot plot1 = new CategoryPlot(dataset, domainAxis, rangeAxis, renderer1);
CategoryPlot plot2 = new CategoryPlot(dataset, domainAxis, rangeAxis, renderer2);
CategoryPlot plot3 = new CategoryPlot(dataset, domainAxis, rangeAxis, renderer3);
// 生成折线图上的数字
//绘图区域(红色矩形框的部分)
/*LineAndShapeRenderer lineAndShapeRenderer=(LineAndShapeRenderer)plot1.getRenderer();
lineAndShapeRenderer.setBaseItemLabelGenerator(new StandardCategoryItemLabelGenerator());
//设置图表上的数字可见
lineAndShapeRenderer.setBaseItemLabelsVisible(true);
//设置图表上的数字字体
lineAndShapeRenderer.setBaseItemLabelFont(new Font("宋体",Font.BOLD,15));*/
// 设置联合分类图表
CombinedDomainCategoryPlot plot = new CombinedDomainCategoryPlot(domainAxis);
plot.add(plot1); // 添加图表区域对象
plot.add(plot2);
// plot.add(plot3);
JFreeChart chart = new JFreeChart("2018年上半年销售量", plot); // 创建图表
TextTitle textTitle = chart.getTitle(); // 标题
textTitle.setFont(new Font("宋体", Font.PLAIN, 20));
// 图例
LegendTitle legendTitle = chart.getLegend();
legendTitle.setItemFont(new Font("宋体", Font.PLAIN, 14));
// 图表区域
CategoryPlot categoryPlot = chart.getCategoryPlot();
// X轴
CategoryAxis categoryAxis = categoryPlot.getDomainAxis();
// X轴字体
categoryAxis.setTickLabelFont(new Font("宋体", Font.PLAIN, 14));
// X轴标签字体
categoryAxis.setLabelFont(new Font("宋体", Font.PLAIN, 14));
// 标注位于上侧
// chart.getLegend().setPosition(RectangleEdge.TOP);
// 设置标注无边框
chart.getLegend().setFrame(new BlockBorder(Color.WHITE));
//在D盘目录下生成图片
int width = 800;
int height = 600;
File p = new File(imagePath);
if (!p.exists()) {
p.mkdirs();
}
String imageName = System.currentTimeMillis() + "_联合分类图" + ".jpeg";
File file = new File(p.getPath() + "/" + imageName);
try {
if (file.exists()) {
file.delete();
}
ChartUtilities.saveChartAsJPEG(file, chart, width, height);
} catch (IOException e) {
e.printStackTrace();
}
}
/**
* 双轴图
*/
public static void biaxial() {
// 行关键字
String seriesArray[] = {"JAVA图书", "Android图书", "PHP图书"};
// 列关键字
String categoryArray[] = {"1月", "2月", "3月", "4月", "5月", "6月"};
// 对应的值
int value[] = {310, 489, 512, 589, 359, 402, 501, 200, 308, 580, 418, 315, 480, 381, 264, 185, 209, 302};
String lineArray[] = {"C++图书", "C#图书", "GO图书"};
// 创建分类数据集-柱状图数据
DefaultCategoryDataset columnarDataset = new DefaultCategoryDataset();
int data = 0;
for (int i = 0; i < seriesArray.length; i++) {
for (int j = 0; j < 6; j++) {
columnarDataset.addValue(value[data], seriesArray[i], categoryArray[j]);
data++;
}
}
// 创建分类数据集-折线图
DefaultCategoryDataset lineDataset = new DefaultCategoryDataset();
data = 0;
for (int i = 0; i < lineArray.length; i++) {
for (int k = 0; k < 6; k++) {
lineDataset.addValue(value[data], lineArray[i], categoryArray[k]);
data++;
}
}
// 创建柱状图对象
JFreeChart chart = ChartFactory.createBarChart(
"2018年上半年销售量", // 图表标题
"月份", // x轴标签
"销售量(单位:本)", // y轴标签
columnarDataset, // 数据集
PlotOrientation.VERTICAL, // 图表方向为垂直方向
true, // 是否显示图例
false, // 是否生成工具
false // 是否生成URL链接
);
// 标题
TextTitle textTitle = chart.getTitle();
textTitle.setFont(new Font("宋体", Font.PLAIN, 20));
// 图例
LegendTitle legendTitle = chart.getLegend();
legendTitle.setItemFont(new Font("宋体", Font.PLAIN, 14));
// 图表区域对象
CategoryPlot categoryPlot = chart.getCategoryPlot();
// X轴对象
CategoryAxis categoryAxis = categoryPlot.getDomainAxis();
// X轴字体
categoryAxis.setTickLabelFont(new Font("宋体", Font.PLAIN, 14));
// X轴标签字体
categoryAxis.setLabelFont(new Font("宋体", Font.PLAIN, 14));
// y轴
ValueAxis valueAxis = categoryPlot.getRangeAxis();
// y轴字体
valueAxis.setTickLabelFont(new Font("宋体", Font.PLAIN, 14));
// y轴标签字体
valueAxis.setLabelFont(new Font("宋体", Font.PLAIN, 14));
// 读取图表数据2
categoryPlot.setDataset(1, lineDataset);
// 获取线性渲染对象
LineAndShapeRenderer renderer2 = new LineAndShapeRenderer();
// 设置线形图
categoryPlot.setRenderer(1, renderer2);
// 设置双Y轴
ValueAxis axis2 = new NumberAxis("网购销售量");
// 设置Y轴最大值
axis2.setUpperBound(200);
categoryPlot.setRangeAxis(1, axis2);
// 标注位于上侧
// chart.getLegend().setPosition(RectangleEdge.TOP);
// 设置标注无边框
chart.getLegend().setFrame(new BlockBorder(Color.WHITE));
// 设置背景透明度
categoryPlot.setBackgroundAlpha(0.1f);
// 设置网格横线颜色
categoryPlot.setRangeGridlinePaint(Color.gray);
// 设置网格横线大小
categoryPlot.setDomainGridlineStroke(new BasicStroke(0.2F));
categoryPlot.setRangeGridlineStroke(new BasicStroke(0.2F));
//在D盘目录下生成图片
int width = 800;
int height = 600;
File p = new File(imagePath);
if (!p.exists()) {
p.mkdirs();
}
String imageName = System.currentTimeMillis() + "_双轴图" + ".jpeg";
File file = new File(p.getPath() + "/" + imageName);
try {
if (file.exists()) {
file.delete();
}
ChartUtilities.saveChartAsJPEG(file, chart, width, height);
} catch (IOException e) {
e.printStackTrace();
}
}
/**
* 生成甘特图
*/
public static void createGanttChart() {
IntervalCategoryDataset dataset = createSampleDataset();
JFreeChart chart = ChartFactory.createGanttChart("任务管理系统",
"任务各阶段详细实施计划",
"任务周期",
dataset,
true,
false,
false);
CategoryPlot plot = chart.getCategoryPlot();
chart.getTitle().setFont(new Font("宋体", Font.BOLD, 20));
CategoryAxis domainAxis = plot.getDomainAxis();
//水平底部列表
domainAxis.setLabelFont(new Font("宋体", Font.BOLD, 15));
//水平底部标题
domainAxis.setTickLabelFont(new Font("宋体", Font.BOLD, 15));
//垂直标题
ValueAxis rangeAxis = plot.getRangeAxis();
rangeAxis.setLabelFont(new Font("宋体", Font.BOLD, 16));
//用来控制时间轴的显示,防止乱码
DateAxis da = (DateAxis) plot.getRangeAxis(0);
da.setDateFormatOverride(new SimpleDateFormat("yyyy-MM-dd"));
//设置提示条字体
/*Font font = new Font("宋体", Font.BOLD, 15);
chart.getLegend().setItemFont(font);
// 标注位于上侧
// chart.getLegend().setPosition(RectangleEdge.TOP);*/
// 设置标注无边框
chart.getLegend().setFrame(new BlockBorder(Color.WHITE));
Font font = new Font("宋体", Font.BOLD, 15);
//得到绘图区的域轴(横轴),设置标签的字体
// plot.getDomainAxis().setLabelFont(font);
// 设置背景透明度
plot.setBackgroundAlpha(0.1f);
// 设置网格横线颜色
plot.setRangeGridlinePaint(Color.gray);
// 设置网格横线大小
plot.setDomainGridlineStroke(new BasicStroke(0.2F));
plot.setRangeGridlineStroke(new BasicStroke(0.2F));
//在D盘目录下生成图片
int width = 800;
int height = 600;
File p = new File(imagePath);
if (!p.exists()) {
p.mkdirs();
}
String imageName = System.currentTimeMillis() + "_甘特图" + ".jpeg";
File file = new File(p.getPath() + "/" + imageName);
try {
if (file.exists()) {
file.delete();
}
ChartUtilities.saveChartAsJPEG(file, chart, width, height, null);
} catch (IOException e) {
e.printStackTrace();
}
}
/**
* 生成K线图
*/
public static void kImage() {
SimpleDateFormat dateFormat = new SimpleDateFormat("yyyy-MM-dd");// 设置日期格式
double highValue = Double.MIN_VALUE;// 设置K线数据当中的最大值
double minValue = Double.MAX_VALUE;// 设置K线数据当中的最小值
double high2Value = Double.MIN_VALUE;// 设置成交量的最大值
double min2Value = Double.MAX_VALUE;// 设置成交量的最低值
OHLCSeries series = new OHLCSeries("");// 高开低收数据序列,股票K线图的四个数据,依次是开,高,低,收
series.add(new Day(28, 9, 2007), 9.2, 9.58, 9.16, 9.34);
series.add(new Day(27, 9, 2007), 8.9, 9.06, 8.83, 8.96);
series.add(new Day(26, 9, 2007), 9.0, 9.1, 8.82, 9.04);
series.add(new Day(25, 9, 2007), 9.25, 9.33, 8.88, 9.00);
series.add(new Day(24, 9, 2007), 9.05, 9.50, 8.91, 9.25);
series.add(new Day(21, 9, 2007), 8.68, 9.05, 8.40, 9.00);
series.add(new Day(20, 9, 2007), 8.68, 8.95, 8.50, 8.69);
series.add(new Day(19, 9, 2007), 8.80, 8.94, 8.50, 8.66);
series.add(new Day(18, 9, 2007), 8.88, 9.17, 8.69, 8.80);
series.add(new Day(17, 9, 2007), 8.26, 8.98, 8.15, 8.89);
series.add(new Day(14, 9, 2007), 8.44, 8.45, 8.13, 8.33);
series.add(new Day(13, 9, 2007), 8.13, 8.46, 7.97, 8.42);
series.add(new Day(12, 9, 2007), 8.2, 8.4, 7.81, 8.13);
series.add(new Day(11, 9, 2007), 9.0, 9.0, 8.1, 8.24);
series.add(new Day(10, 9, 2007), 8.6, 9.03, 8.40, 8.95);
series.add(new Day(7, 9, 2007), 8.89, 9.04, 8.70, 8.73);
series.add(new Day(6, 9, 2007), 8.4, 9.08, 8.33, 8.88);
series.add(new Day(5, 9, 2007), 8.2, 8.74, 8.17, 8.36);
series.add(new Day(4, 9, 2007), 7.7, 8.46, 7.67, 8.27);
series.add(new Day(3, 9, 2007), 7.5, 7.8, 7.48, 7.69);
series.add(new Day(31, 8, 2007), 7.4, 7.6, 7.28, 7.43);
series.add(new Day(30, 8, 2007), 7.42, 7.56, 7.31, 7.40);
series.add(new Day(29, 8, 2007), 7.42, 7.66, 7.22, 7.33);
series.add(new Day(28, 8, 2007), 7.31, 7.70, 7.15, 7.56);
series.add(new Day(27, 8, 2007), 7.05, 7.46, 7.02, 7.41);
series.add(new Day(24, 8, 2007), 7.05, 7.09, 6.90, 6.99);
series.add(new Day(23, 8, 2007), 7.12, 7.16, 7.00, 7.03);
series.add(new Day(22, 8, 2007), 6.96, 7.15, 6.93, 7.11);
series.add(new Day(21, 8, 2007), 7.10, 7.15, 7.02, 7.07);
series.add(new Day(20, 8, 2007), 7.02, 7.19, 6.94, 7.14);
final OHLCSeriesCollection seriesCollection = new OHLCSeriesCollection();// 保留K线数据的数据集,必须申明为final,后面要在匿名内部类里面用到
seriesCollection.addSeries(series);
TimeSeries series2 = new TimeSeries("");// 对应时间成交量数据
series2.add(new Day(28, 9, 2007), 260659400 / 100);
series2.add(new Day(27, 9, 2007), 119701900 / 100);
series2.add(new Day(26, 9, 2007), 109719000 / 100);
series2.add(new Day(25, 9, 2007), 178492400 / 100);
series2.add(new Day(24, 9, 2007), 269978500 / 100);
series2.add(new Day(21, 9, 2007), 361042300 / 100);
series2.add(new Day(20, 9, 2007), 173912600 / 100);
series2.add(new Day(19, 9, 2007), 154622600 / 100);
series2.add(new Day(18, 9, 2007), 200661600 / 100);
series2.add(new Day(17, 9, 2007), 312799600 / 100);
series2.add(new Day(14, 9, 2007), 141652900 / 100);
series2.add(new Day(13, 9, 2007), 221260400 / 100);
series2.add(new Day(12, 9, 2007), 274795400 / 100);
series2.add(new Day(11, 9, 2007), 289287300 / 100);
series2.add(new Day(10, 9, 2007), 289063600 / 100);
series2.add(new Day(7, 9, 2007), 351575300 / 100);
series2.add(new Day(6, 9, 2007), 451357300 / 100);
series2.add(new Day(5, 9, 2007), 442421200 / 100);
series2.add(new Day(4, 9, 2007), 671942600 / 100);
series2.add(new Day(3, 9, 2007), 349647800 / 100);
series2.add(new Day(31, 8, 2007), 225339300 / 100);
series2.add(new Day(30, 8, 2007), 160048200 / 100);
series2.add(new Day(29, 8, 2007), 247341700 / 100);
series2.add(new Day(28, 8, 2007), 394975400 / 100);
series2.add(new Day(27, 8, 2007), 475797500 / 100);
series2.add(new Day(24, 8, 2007), 297679500 / 100);
series2.add(new Day(23, 8, 2007), 191760600 / 100);
series2.add(new Day(22, 8, 2007), 232570200 / 100);
series2.add(new Day(21, 8, 2007), 215693200 / 100);
series2.add(new Day(20, 8, 2007), 200287500 / 100);
TimeSeriesCollection timeSeriesCollection = new TimeSeriesCollection();// 保留成交量数据的集合
timeSeriesCollection.addSeries(series2);
// 获取K线数据的最高值和最低值
int seriesCount = seriesCollection.getSeriesCount();// 一共有多少个序列,目前为一个
for (int i = 0; i < seriesCount; i++) {
int itemCount = seriesCollection.getItemCount(i);// 每一个序列有多少个数据项
for (int j = 0; j < itemCount; j++) {
if (highValue < seriesCollection.getHighValue(i, j)) {// 取第i个序列中的第j个数据项的最大值
highValue = seriesCollection.getHighValue(i, j);
}
if (minValue > seriesCollection.getLowValue(i, j)) {// 取第i个序列中的第j个数据项的最小值
minValue = seriesCollection.getLowValue(i, j);
}
}
}
// 获取最高值和最低值
int seriesCount2 = timeSeriesCollection.getSeriesCount();// 一共有多少个序列,目前为一个
for (int i = 0; i < seriesCount2; i++) {
int itemCount = timeSeriesCollection.getItemCount(i);// 每一个序列有多少个数据项
for (int j = 0; j < itemCount; j++) {
if (high2Value < timeSeriesCollection.getYValue(i, j)) {// 取第i个序列中的第j个数据项的值
high2Value = timeSeriesCollection.getYValue(i, j);
}
if (min2Value > timeSeriesCollection.getYValue(i, j)) {// 取第i个序列中的第j个数据项的值
min2Value = timeSeriesCollection.getYValue(i, j);
}
}
}
final CandlestickRenderer candlestickRender = new CandlestickRenderer();// 设置K线图的画图器,必须申明为final,后面要在匿名内部类里面用到
candlestickRender.setUseOutlinePaint(true); // 设置是否使用自定义的边框线,程序自带的边框线的颜色不符合中国股票市场的习惯
candlestickRender.setAutoWidthMethod(CandlestickRenderer.WIDTHMETHOD_AVERAGE);// 设置如何对K线图的宽度进行设定
candlestickRender.setAutoWidthGap(0.001);// 设置各个K线图之间的间隔
candlestickRender.setUpPaint(Color.RED);// 设置股票上涨的K线图颜色
candlestickRender.setDownPaint(Color.GREEN);// 设置股票下跌的K线图颜色
DateAxis x1Axis = new DateAxis();// 设置x轴,也就是时间轴
x1Axis.setAutoRange(false);// 设置不采用自动设置时间范围
try {
x1Axis.setRange(dateFormat.parse("2007-08-20"), dateFormat.parse("2007-09-29"));// 设置时间范围,注意时间的最大值要比已有的时间最大值要多一天
} catch (Exception e) {
e.printStackTrace();
}
x1Axis.setTimeline(SegmentedTimeline.newMondayThroughFridayTimeline());// 设置时间线显示的规则,用这个方法就摒除掉了周六和周日这些没有交易的日期(很多人都不知道有此方法),使图形看上去连续
x1Axis.setAutoTickUnitSelection(false);// 设置不采用自动选择刻度值
x1Axis.setTickMarkPosition(DateTickMarkPosition.MIDDLE);// 设置标记的位置
x1Axis.setStandardTickUnits(DateAxis.createStandardDateTickUnits());// 设置标准的时间刻度单位
x1Axis.setTickUnit(new DateTickUnit(DateTickUnit.DAY, 7));// 设置时间刻度的间隔,一般以周为单位
x1Axis.setDateFormatOverride(new SimpleDateFormat("yyyy-MM-dd"));// 设置显示时间的格式
NumberAxis y1Axis = new NumberAxis();// 设定y轴,就是数字轴
y1Axis.setAutoRange(false);// 不不使用自动设定范围
y1Axis.setRange(minValue * 0.9, highValue * 1.1);// 设定y轴值的范围,比最低值要低一些,比最大值要大一些,这样图形看起来会美观些
y1Axis.setTickUnit(new NumberTickUnit((highValue * 1.1 - minValue * 0.9) / 10));// 设置刻度显示的密度
XYPlot plot1 = new XYPlot(seriesCollection, x1Axis, y1Axis, candlestickRender);// 设置画图区域对象
XYBarRenderer xyBarRender = new XYBarRenderer() {
private static final long serialVersionUID = 1L;// 为了避免出现警告消息,特设定此值
public Paint getItemPaint(int i, int j) {// 匿名内部类用来处理当日的成交量柱形图的颜色与K线图的颜色保持一致
if (seriesCollection.getCloseValue(i, j) > seriesCollection.getOpenValue(i, j)) {// 收盘价高于开盘价,股票上涨,选用股票上涨的颜色
return candlestickRender.getUpPaint();
} else {
return candlestickRender.getDownPaint();
}
}
};
xyBarRender.setMargin(0.1);// 设置柱形图之间的间隔
NumberAxis y2Axis = new NumberAxis();// 设置Y轴,为数值,后面的设置,参考上面的y轴设置
y2Axis.setAutoRange(false);
y2Axis.setRange(min2Value * 0.9, high2Value * 1.1);
y2Axis.setTickUnit(new NumberTickUnit((high2Value * 1.1 - min2Value * 0.9) / 4));
XYPlot plot2 = new XYPlot(timeSeriesCollection, null, y2Axis, xyBarRender);// 建立第二个画图区域对象,主要此时的x轴设为了null值,因为要与第一个画图区域对象共享x轴
CombinedDomainXYPlot combineddomainxyplot = new CombinedDomainXYPlot(x1Axis);// 建立一个恰当的联合图形区域对象,以x轴为共享轴
combineddomainxyplot.add(plot1, 2);// 添加图形区域对象,后面的数字是计算这个区域对象应该占据多大的区域2/3
combineddomainxyplot.add(plot2, 1);// 添加图形区域对象,后面的数字是计算这个区域对象应该占据多大的区域1/3
combineddomainxyplot.setGap(10);// 设置两个图形区域对象之间的间隔空间
JFreeChart chart = new JFreeChart("中国联通", JFreeChart.DEFAULT_TITLE_FONT, combineddomainxyplot, false);
//在D盘目录下生成图片
int width = 800;
int height = 600;
File p = new File(imagePath);
if (!p.exists()) {
p.mkdirs();
}
String imageName = System.currentTimeMillis() + "_k线图" + ".jpeg";
File file = new File(p.getPath() + "/" + imageName);
try {
if (file.exists()) {
file.delete();
}
ChartUtilities.saveChartAsJPEG(file, chart, width, height);
} catch (IOException e) {
e.printStackTrace();
}
//为了能够保证K线图的上影线和下影线能够和K线图本身的颜色保持一致,找了很多的方法设置都不成功,可以说目前暂不提供单独绘制K线边框颜色的方法,所以,经过本人的实验,对其中的源代码进行了下修改,
//具体修改的地方是在下载回来的文件目中source\org\jfree\chart\renderer\xy\CandlestickRenderer.java文件,将
//Paint p = getItemPaint(series, item);
// Paint outlinePaint = null;
// outlinePaint = getItemOutlinePaint(series, item);
//}
//
//修改为如下的代码,这样就会保证K线图的上影线和下影线能够和K线图本身的颜色保持一致,符合中国股票市场K线图形颜色的习惯:
//Paint p = getItemPaint(series, item);
// Paint outlinePaint = null;
// if (this.useOutlinePaint) {
// if(yClose>yOpen){
// if (this.upPaint != null) {
// outlinePaint=this.upPaint;
// }
// else {
// outlinePaint=p;
// }
// }else{
// if (this.downPaint != null) {
// outlinePaint=this.downPaint;
// }
// else {
// outlinePaint=p;
// }
// }
}
/**
* 生成柱状图-横向
*/
public static void bar3DHx() {
// 行关键字
String seriesArray[] = {"菲亚特", "奥迪", "福特"};
// 列关键字
String categoryArray[] = {"速度", "喜欢程度", "邮寄", "用户评价", "安全性", "使用性"};
// 对应的值
int value[] = {310, 489, 512, 589, 359, 402, 501, 200, 308, 580, 418, 315, 480, 381, 264, 185, 209, 302};
// 创建分类数据集
DefaultCategoryDataset dataset = new DefaultCategoryDataset();
int data = 0;
for (int i = 0; i < 3; i++) {
for (int j = 0; j < 6; j++) {
dataset.addValue(value[data], seriesArray[i], categoryArray[j]);
data++;
}
}
// 设置字体,去除中文乱码
StandardChartTheme sct = new StandardChartTheme("CN");
sct.setExtraLargeFont(new Font("宋体", Font.LAYOUT_LEFT_TO_RIGHT, 15));
sct.setRegularFont(new Font("宋体", Font.LAYOUT_LEFT_TO_RIGHT, 15));
sct.setLargeFont(new Font("宋体", Font.LAYOUT_LEFT_TO_RIGHT, 15));
ChartFactory.setChartTheme(sct);
JFreeChart chart = ChartFactory.createBarChart3D(
"汽车使用统计",
"",// 类别
"", // 值
dataset,
PlotOrientation.HORIZONTAL,
true, true, false);
//得到绘图区
CategoryPlot plot = (CategoryPlot) chart.getPlot();
/*//获取X轴的对象
// CategoryAxis categoryAxis = plot.getDomainAxis();
// 设置X轴文本倾斜45度
// categoryAxis.setCategoryLabelPositions(CategoryLabelPositions.UP_45);
// 设置背景透明度
plot.setBackgroundAlpha(0.1f);
// 设置网格横线颜色
plot.setRangeGridlinePaint(Color.gray);*/ // 注释的代码放开就是背景透明
/* // 注释的是设置显示数值
BarRenderer renderer = new BarRenderer();
renderer.setBarPainter(new StandardBarPainter());// 取消渐变效果
renderer.setShadowVisible(false);// 关闭倒影
renderer.setDrawBarOutline(false); // 设置柱子边框可见
renderer.setItemMargin(0.03); // 组内柱子间隔为组宽的10%
renderer.setMaximumBarWidth(0.03);// 设置条形柱最大宽度
renderer.setMinimumBarLength(0.03);// 设置条形柱最小宽度
renderer.setBaseItemLabelGenerator(new StandardCategoryItemLabelGenerator());// 数据标签格式
renderer.setBaseItemLabelsVisible(true);// 是否显示数据标签
renderer.setSeriesPaint(0, Color.BLUE);
plot.setRenderer(renderer);*/
// 取得纵轴
NumberAxis numberAxis = (NumberAxis) plot.getRangeAxis();
int width = 640;
int height = 480;
// 标注位于上侧
chart.getLegend().setPosition(RectangleEdge.TOP);
// 设置标注无边框
chart.getLegend().setFrame(new BlockBorder(Color.WHITE));
//在D盘目录下生成图片
File p = new File(imagePath);
if (!p.exists()) {
p.mkdirs();
}
String imageName = System.currentTimeMillis() + "_3D柱状图_横向" + ".jpeg";
File file = new File(p.getPath() + "/" + imageName);
try {
if (file.exists()) {
file.delete();
}
ChartUtilities.saveChartAsJPEG(file, chart, width, height);
} catch (IOException e) {
e.printStackTrace();
}
}
private static Date date(final int day, final int month, final int year) {
final Calendar calendar = Calendar.getInstance();
calendar.set(year, month, day);
final Date result = calendar.getTime();
return result;
}
private static IntervalCategoryDataset createSampleDataset() {
final TaskSeries s1 = new TaskSeries("时间表");
final Task t1 = new Task("任务1", date(1, Calendar.JANUARY, 2001), date(5, Calendar.APRIL, 2001));
t1.setPercentComplete(0.8);
s1.add(t1);
// 创建一个任务并插入两个子任务
final Task t3 = new Task("任务2", date(10, Calendar.APRIL, 2001), date(5, Calendar.MAY, 2001));
final Task st31 = new Task("需求1", date(10, Calendar.APRIL, 2001), date(25, Calendar.APRIL, 2001));
st31.setPercentComplete(0.50);
final Task st32 = new Task("需求2", date(1, Calendar.MAY, 2001), date(5, Calendar.MAY, 2001));
st32.setPercentComplete(1.0);
t3.addSubtask(st31);
t3.addSubtask(st32);
s1.add(t3);
final Task t5 = new Task("任务3", date(2, Calendar.JUNE, 2001), date(2, Calendar.JUNE, 2001));
s1.add(t5);
final Task t6 = new Task("任务4", date(3, Calendar.MARCH, 2001), date(31, Calendar.JULY, 2001));
t6.setPercentComplete(0.60);
s1.add(t6);
final Task t8 = new Task("任务结束", date(10, Calendar.AUGUST, 2001), date(10, Calendar.AUGUST, 2001));
t8.setPercentComplete(0.0);
s1.add(t8);
final Task t9 = new Task("任务试用", date(12, Calendar.AUGUST, 2001), date(12, Calendar.SEPTEMBER, 2001));
t9.setPercentComplete(0.0);
s1.add(t9);
final Task t10 = new Task("任务测试", date(13, Calendar.SEPTEMBER, 2001), date(31, Calendar.OCTOBER, 2001));
t10.setPercentComplete(0.2);
s1.add(t10);
final Task t12 = new Task("全部结束", date(28, Calendar.NOVEMBER, 2001), date(30, Calendar.NOVEMBER, 2001));
t12.setPercentComplete(0.0);
s1.add(t12);
final TaskSeriesCollection collection = new TaskSeriesCollection();
collection.add(s1);
return collection;
}
}
依赖:
<!-- https://mvnrepository.com/artifact/jfree/jcommon -->
<dependency>
<groupId>jfree</groupId>
<artifactId>jcommon</artifactId>
<version>1.0.16</version>
</dependency>
<!-- https://mvnrepository.com/artifact/jfree/jfreechart -->
<dependency>
<groupId>jfree</groupId>
<artifactId>jfreechart</artifactId>
<version>1.0.13</version>
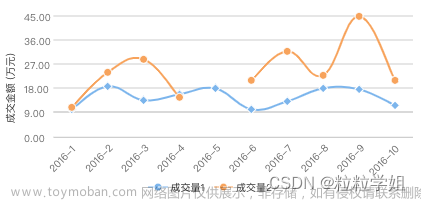
</dependency>以下是生成的图形案例:
 文章来源:https://www.toymoban.com/news/detail-565899.html
以下是生成图片、表格数据、然后导出word文档的代码文章来源地址https://www.toymoban.com/news/detail-565899.html
 @PostMapping("/word")
    public void export(@RequestBody WordExportRequestDto wordExportDto, HttpServletResponse response) throws Exception {

        //根据项目id获取数据,也就是页面上获取的数据,转成entity
        Map<String, Object> hashMap = new HashMap();
        hashMap.put("projectId",wordExportDto.getProjectId());
        Map<String, Object> stringObjectMap = projectOverviewService.defectTopData(hashMap);
        String json = GsonUtils.GsonString(stringObjectMap);
        WordDataDto wordDataDto = GsonUtils.GsonToBean(json, WordDataDto.class);

        //查询出项目名称数据
        ProjectBaseinfoDto projectInfo = projectInfoDao.selectByIdProjectInfo(wordExportDto.getProjectId());

        String fileName = projectInfo.getName() + "项目概览-缺陷详情";
        response.setCharacterEncoding("UTF-8");
        response.setHeader("content-Type", "application/msword");
        response.setHeader("Content-Disposition", "attachment;filename=" + URLEncoder.encode(fileName+".docx", StandardCharsets.UTF_8.name()));

        List<DefectStatusSpreadDto> defectStatusSpread = defectInfoService.getDefectStatusSpread(hashMap);

        //根据项目id获取缺陷列表
        List<String> list = new ArrayList<>();
        List<DefectInfoDto> defectByProjectIdList;
        list.add(wordExportDto.getProjectId().toString());
        if (projectInfo.getType() == ProjectConstant.PROJECT_SUBPROJECT_TASK && projectInfo.getParentId() == null){
            defectByProjectIdList = defectInfoService.getDefectByProjectIdListCopy(new ArrayList<>(),list);
        }else {
            defectByProjectIdList = defectInfoService.getDefectByProjectIdListCopy(list,new ArrayList<>());
        }

        Map<String, Object> map = new HashMap();
        map.put("defectSurveyPic",wordExportDto.getDefectSurveyPic());

        //添加大标题、小标题等信息
        putBaseInfo(map,projectInfo);
        //添加顶部图片信息,
        putImg(map,wordExportDto);

        //添加环形数据  缺陷等级分布图
        putBar(map,wordDataDto);

        //缺陷状态分布图
        putDefectStatusBar(map,defectStatusSpread);

        //添加缺陷等级分布列表数据
        putList(map,wordDataDto);

        //缺陷状态分布列表数据
        putDefectStatusList(map,defectStatusSpread);

        //缺陷列表数据,最下面的一张图
        putGetDefectList(map,defectByProjectIdList);

        //将流转换成word对象
        InputStream inputStream = ResourceUtil.getStream("classpath:template/export.docx");
        MyXWPFDocument doc = new MyXWPFDocument(inputStream);

        //导出word并指定word导出模板
        WordExportUtil.exportWord07(doc, map);
        //设置编码格式
        response.setCharacterEncoding(StandardCharsets.UTF_8.name());
        //设置内容类型
        response.setContentType("application/octet-stream");

        //设置头及文件命名。
        response.setHeader("Content-Disposition", "attachment;filename=" + URLEncoder.encode("测试.docx", StandardCharsets.UTF_8.name()));

        //写入
        doc.write(response.getOutputStream());
    }


    private void putBaseInfo(Map<String, Object> map,ProjectBaseinfoDto projectBaseinfoDto) {
        map.put("theme", projectBaseinfoDto.getName());
        map.put("nowDate",new SimpleDateFormat("yyyyMMdd").format(new Date()));
        map.put("person", "1、\t缺陷概览");
        map.put("title1", "2、\t缺陷等级分布");
        map.put("title2", "1)\t缺陷等级分布图");
        map.put("title3", "2)\t缺陷等级分布列表");
        map.put("title4", "3、\t缺陷状态分布");
        map.put("title5", "1)\t缺陷状态分布图");
        map.put("title6", "2)\t缺陷状态分布列表");
        map.put("title7", "4、\t缺陷列表");
    }

    /***
     * 部分图像数据负责的,由前端传base64过来直接转图片
     * @param map
     */
    private void putImg(Map<String, Object> map,WordExportRequestDto wordExportDto) throws IOException {

        //顶部图
        if (Objects.nonNull(wordExportDto.getDefectSurveyPic())){
            BufferedImage imageInfo = ImageUtil.getImageInfo(wordExportDto.getDefectSurveyPic());
            ImageEntity image = getImage(wordExportDto.getDefectSurveyPic(),imageInfo.getHeight() / 3,imageInfo.getWidth() / 3);
            map.put("img1", image);
        }
    }


    /***
     * 根据大小、百分比获取百分比后的数据
     * @param size
     * @param rate
     * @return
     */
    public int bigDecimal(String size,String rate){
        BigDecimal strA = new BigDecimal(size);
        BigDecimal strB = new BigDecimal(rate);
        BigDecimal multiply = strA.multiply(strB);
        return multiply.intValue();
    }


    /***
     *  添加缺陷等级分布列表数据
     * @param map
     * @param wordDataDto
     */
    private void putList(Map<String, Object> map,WordDataDto wordDataDto) {
        List<Map<String, String>> list = new ArrayList();
        WordDefectLevelDto defectLevel = wordDataDto.getDefectLevel();
        if (Objects.nonNull(defectLevel)){
            List<WordTableDataDto> tableData = defectLevel.getTableData();
            if (!tableData.isEmpty()){
                for (WordTableDataDto dto : tableData){
                    Map<String, String> map1 = new HashMap<>();
                    map1.put("level", dto.getDefectLevel());
                    map1.put("defectCount", dto.getDefectCount());
                    map1.put("suspend", dto.getSuspend());
                    map1.put("moreThreeDaysRepair", dto.getThreeDaysRepair());
                    map1.put("repair", dto.getRepair());
                    map1.put("newTodays", dto.getNewTodays());
                    map1.put("rate", dto.getRate());
                    map1.put("twoDaysRepair", dto.getTwoDaysRepair());
                    map1.put("threeDaysRepair", dto.getThreeDaysRepair());
                    map1.put("closed", dto.getClosed());
                    map1.put("toVerified", dto.getToVerified());
                    list.add(map1);
                }
            }
        }

        map.put("list", list);
    }


    /***
     * 	缺陷状态分布列表数据
     * @param map
     * @param defectStatusSpread
     */
    private void putDefectStatusList(Map<String, Object> map,List<DefectStatusSpreadDto> defectStatusSpread) {

        //计算出总和
        IntSummaryStatistics repairTotal = defectStatusSpread.stream().mapToInt((x) -> Math.toIntExact(x.getCount())).summaryStatistics();

        List<Map<String, String>> list = new ArrayList<>();
            if (!defectStatusSpread.isEmpty()){
                for (DefectStatusSpreadDto dto : defectStatusSpread){
                    Map<String, String> map1 = new HashMap<>();
                    map1.put("statusName", dto.getStatusName());
                    map1.put("count", dto.getCount().toString());

                    //转换百分比
                    BigDecimal a = new BigDecimal(dto.getCount());
                    BigDecimal b = new BigDecimal(repairTotal.getSum());
                    int rate = NumberUtil.div(a, b,2).multiply(BigDecimal.valueOf(100)).intValue();
                    map1.put("rate", rate+"%");
                    list.add(map1);
                }
            }
        map.put("list2", list);
        }


    /***
     * 获取缺陷列表数据,最下面的表格
     * @param map
     * @param defectByProjectIdList
     */
    private void putGetDefectList(Map<String, Object> map,List<DefectInfoDto> defectByProjectIdList) {
        List<Map<String, String>> list = new ArrayList<>();

            if (!defectByProjectIdList.isEmpty()){
                int num = 0;
                for (int i = 0;i < defectByProjectIdList.size();i++){
                    num++;
                    Map<String, String> map1 = new HashMap<>();
                    map1.put("id", num+"");
                    map1.put("number", defectByProjectIdList.get(i).getDefectCode());
                    map1.put("defectName", defectByProjectIdList.get(i).getName());
                    if (Objects.nonNull(defectByProjectIdList.get(i).getDefectEnv())){
                        map1.put("dev", initializationEnv(defectByProjectIdList.get(i).getDefectEnv()));
                    }
                    if (Objects.nonNull(defectByProjectIdList.get(i).getDefectLevel())){
                        map1.put("level", initializationDefectLevel(defectByProjectIdList.get(i).getDefectLevel()));
                    }
                    if (Objects.nonNull(defectByProjectIdList.get(i).getDefectType())){
                        map1.put("type", initializationDefectType(defectByProjectIdList.get(i).getDefectType()));
                    }
                    map1.put("createator",defectByProjectIdList.get(i).getCreatorName());
                    map1.put("date", new SimpleDateFormat("yyyy-MM-dd").format(defectByProjectIdList.get(i).getCreateDate()));
                    list.add(map1);
                }

            }

        map.put("list3", list);
    }

    /***
     * 环形图数据 缺陷等级分布图
     * @param map
     * @throws IOException
     */
    private void putBar(Map<String, Object> map,WordDataDto wordDataDto) throws IOException {
        File file2 = File.createTempFile("temp", "jpg");
        DefaultPieDataset pds = new DefaultPieDataset();
        WordDefectLevelDto defectLevel = wordDataDto.getDefectLevel();
        if (Objects.nonNull(defectLevel)){
            List<WordPieDataDto> pieData = defectLevel.getPieData();
            if (!pieData.isEmpty()){
                for (WordPieDataDto dto : pieData){
                    pds.setValue(dto.getName(), dto.getValue());
                }
            }
        }
        JfreeChartToFileUtil.createCircularChart(pds, file2, "1)缺陷等级分布图");
        ImageEntity image = new ImageEntity();
        image.setHeight(350);
        image.setWidth(550);
        image.setUrl(file2.getAbsolutePath());
        image.setType(ImageEntity.URL);
        map.put("img2", image);
    }


    /***
     * 环形图数据 缺陷状态分布图
     * @param map
     * @throws IOException
     */
    private void putDefectStatusBar(Map<String, Object> map,List<DefectStatusSpreadDto> defectStatusSpread) throws IOException {
        File file2 = File.createTempFile("temp", "jpg");
        DefaultPieDataset pds = new DefaultPieDataset();
        for (DefectStatusSpreadDto dto : defectStatusSpread){
            pds.setValue(dto.getStatusName(), dto.getCount());
        }

        JfreeChartToFileUtil.createCircularChart(pds, file2, "1)缺陷状态分布图");
        ImageEntity image = new ImageEntity();
        image.setHeight(350);
        image.setWidth(550);
        image.setUrl(file2.getAbsolutePath());
        image.setType(ImageEntity.URL);
        map.put("img3", image);
    }


    /***
     * 将base64封装成ImageEntity对象
     * @param base64CodeStr
     * @return
     */
    private ImageEntity getImage(String base64CodeStr,int height,int width){

        if (StringUtils.isBlank(base64CodeStr)){
            return null;
        }
        ImageEntity image = new ImageEntity();
        image.setHeight(height);
        image.setWidth(width);
        base64CodeStr = base64CodeStr.replaceAll("data:image/png;base64,","");
        try {
            BASE64Decoder decode = new BASE64Decoder();
            byte[] b = decode.decodeBuffer(base64CodeStr.trim());
            image.setData(b);
        } catch (IOException e) {
            e.printStackTrace();
        }
        image.setType(ImageEntity.Data);
        return image;
    }

    /***
     * 处理环境数据  1测试环境、 2生产环境、 3开发环境、 4灰度环境
     * @param a
     * @return
     */
    public String initializationEnv(int a){
        StringBuffer sb = new StringBuffer();
        switch (a){
            case 1:
                sb.append("测试环境");
                break;
            case 2:
                sb.append("生产环境");
                break;
            case 3:
                sb.append("开发环境");
                break;
            case 4:
                sb.append("灰度环境");
                break;
        }
        return sb.toString();
    }

    /***
     * 处理缺陷类型数据
     *  (1 功能问题、2 归档报错、3 计费准确性问题、4 接口规范问题、5
     *  网络侧问题、6 需求差异、7 配置问题、8 性能问题、9 兼容性问题、10 易用性问题;)
     * @param a
     * @return
     */
    public String initializationDefectType(int a){
        StringBuffer sb = new StringBuffer();
        switch (a){
            case 1:
                sb.append("功能问题");
                break;
            case 2:
                sb.append("归档报错");
                break;
            case 3:
                sb.append("计费准确性问题");
                break;
            case 4:
                sb.append("接口规范问题");
                break;
            case 5:
                sb.append("网络侧问题");
                break;
            case 6:
                sb.append("需求差异");
                break;
            case 7:
                sb.append("配置问题");
                break;
            case 8:
                sb.append("性能问题");
                break;
            case 9:
                sb.append("兼容性问题");
                break;
            case 10:
                sb.append("易用性问题");
                break;
        }
        return sb.toString();
    }

    /***
     * 处理缺陷级别问题   1致命、2严重、3一般、4轻微、5建议
     * @param a
     * @return
     */
    public String initializationDefectLevel(int a){
        StringBuffer sb = new StringBuffer();
        switch (a){
            case 1:
                sb.append("致命");
                break;
            case 2:
                sb.append("严重");
                break;
            case 3:
                sb.append("一般");
                break;
            case 4:
                sb.append("轻微");
                break;
            case 5:
                sb.append("建议");
                break;
        }
        return sb.toString();
    }
package io.ctc.util.word;
import org.jfree.chart.*;
import org.jfree.chart.block.BlockBorder;
import org.jfree.chart.labels.StandardPieSectionLabelGenerator;
import org.jfree.chart.plot.*;
import org.jfree.data.general.DefaultPieDataset;
import java.awt.*;
import java.io.File;
import java.io.IOException;
/**
* @Author xiaoxin
* @Date 2022/10/22 22:22
* @Version 1.0
*/
public class JfreeChartToFileUtil {
/***
* 生成空心圆
* @param pds
* @param file
* @param title
*/
public static void createCircularChart(DefaultPieDataset pds, File file,String title) {
StandardChartTheme mChartTheme = new StandardChartTheme("CN");
// Y柱标签字体(浓度(单位:ppm))
mChartTheme.setLargeFont(new Font("黑体", Font.BOLD, 14));
//标题 (二氧化碳浓度趋势分析图)
mChartTheme.setExtraLargeFont(new Font("宋体", Font.PLAIN, 20));
//应用主题样式
ChartFactory.setChartTheme(mChartTheme);
JFreeChart chart = ChartFactory.createRingChart("", pds, true, false, false);
// 设置显示标注,就是底部显示的文字对应颜色标注
chart.getLegend().setVisible(false);
Font font = new Font("宋体", Font.BOLD, 15);
chart.getLegend().setItemFont(font);
// 设置标注无边框
chart.getLegend().setFrame(new BlockBorder(Color.WHITE));
// 环形图
RingPlot ringplot = (RingPlot) chart.getPlot();
ringplot.setOutlineVisible(false);
//{2}表示显示百分比 //{0}:key {1}:value {2}:百分比 {3}:sum
ringplot.setLabelGenerator(new StandardPieSectionLabelGenerator("{0}:{1}"));
ringplot.setBackgroundPaint(new Color(253, 253, 253));
ringplot.setOutlineVisible(false);
ringplot.setLabelFont(new Font("宋体", Font.BOLD, 15));
ringplot.setSeparatorsVisible(false);
ringplot.setSeparatorPaint(Color.WHITE);
ringplot.setShadowPaint(new Color(253, 253, 253));
// 设置深度,即带颜⾊圆环的宽度
ringplot.setSectionDepth(0.4);
ringplot.setStartAngle(90);
// 指定颜色
ringplot.setDrawingSupplier(new DefaultDrawingSupplier(
new Paint[] {
new Color(46, 199, 201),
new Color(182, 162, 222),
new Color(90, 177, 239),
new Color(255, 185, 128),
new Color(226, 117, 123)
},
DefaultDrawingSupplier.DEFAULT_OUTLINE_PAINT_SEQUENCE,
DefaultDrawingSupplier.DEFAULT_STROKE_SEQUENCE,
DefaultDrawingSupplier.DEFAULT_OUTLINE_STROKE_SEQUENCE,
DefaultDrawingSupplier.DEFAULT_SHAPE_SEQUENCE));
try {
ChartUtils.saveChartAsJPEG(file, chart, 550, 350);
} catch (IOException e) {
e.printStackTrace();
}
}
}
    <dependency>
            <groupId>org.jfree</groupId>
            <artifactId>jfreechart</artifactId>
            <version>1.5.3</version>
        </dependency>
到了这里,关于JfreeChart生成饼图、环形图、柱状图、折线图最强工具,自己使用的文章就介绍完了。如果您还想了解更多内容,请在右上角搜索TOY模板网以前的文章或继续浏览下面的相关文章,希望大家以后多多支持TOY模板网!