1、前言
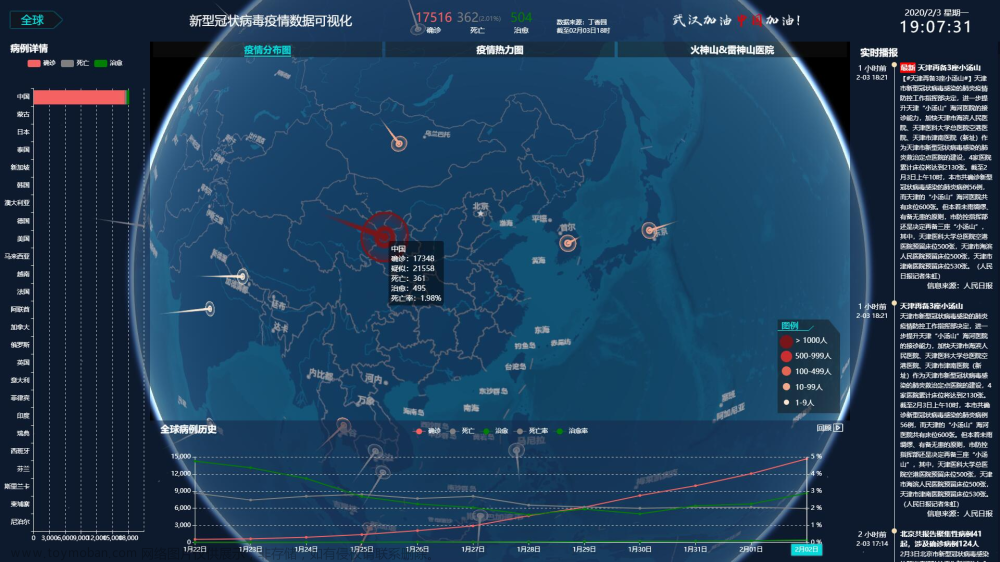
本项目是基于flask+echarts搭建的全国疫情追踪的可视化大屏,主要涉及到的技术有csv处理,flask框架,echarts图表。
最终效果如下:

2、实现
2.1 搭建flask应用
我们先搭建一个基础的flask应用
from flask import Flask,render_template

app = Flask(__name__)
app.config['JSON_AS_ASCII'] = False

@app.route('/')
def index():
    return render_template('index.html')

if __name__ == '__main__':
    app.run(debug=True)
2.2 编写html及其对应css代码
接着,需要编写index.html页面和css样式代码(这里我就直接放最终的代码)
<!DOCTYPE html>
<html lang="en">

<head>
    <!-- 指定网页字符编码 -->
    <meta charset="UTF-8">
    <!-- 适配移动端 -->
    <meta name="viewport" content="width=device-width, initial-scale=1.0">
    <title>疫情数据可视化大屏</title>
    <link rel="stylesheet" href="/static/css/index.css">
</head>

<body>
<div id="title">疫情数据可视化大屏</div>
<div id="left1">
</div>
<div id="left2">
</div>
<div id="center1">
    <div class="item">
        <div class="number" id="confirm"></div>
        <div class="text">累计确诊</div>
    </div>
    <div class="item">
        <div class="number" id="heal"></div>
        <div class="text">累计治愈</div>
    </div>
    <div class="item">
        <div class="number" id="dead"></div>
        <div class="text">累计死亡</div>
    </div>
    <div class="item">
        <div class="number" id="nowConfirm"></div>
        <div class="text">现有确诊</div>
    </div>
    <div class="item">
        <div class="number" id="noInfect"></div>
        <div class="text">无症状感染者</div>
    </div>
    <div class="item">
        <div class="number" id="importedCase"></div>
        <div class="text">境外输入</div>
    </div>
</div>
<div id="center2">
</div>
<div id="right1"></div>
<div id="right2"></div>
<script src="/static/js/left1.js"></script>
<script src="/static/js/left2.js"></script>
<script src="/static/js/center1.js"></script>
<script src="/static/js/center2.js"></script>
<script src="/static/js/right1.js"></script>
<script src="/static/js/right2.js"></script>
<script src="/static/js/echarts.min.js"></script>
<script src="/static/js/china.js"></script>
<script>
    // 初始化echart实例对象
    var left1Chart = echarts.init(document.getElementById('left1'), 'dark');
    // 指定图表的配置项和数据
    // ----------左1的配置项-------------------
    var option = {
        title: {
            text: "全国累计趋势",
            textStyle: {
                color: 'white',
            },
            left: 'left',
        },
        tooltip: {
            trigger: 'axis',
            //指示器
            axisPointer: {
                type: 'line',
                lineStyle: {
                    color: '#7171C6'
                }
            },
        },
        //图例
        legend: {
            data: ['累计确诊', "累计治愈", "累计死亡"],
            left: "right"
        },
        //图形位置
        grid: {
            left: '4%',
            right: '6%',
            bottom: '4%',
            top: 50,
            containLabel: true
        },
        xAxis: [{
            type: 'category',
            data: []
        }],
        yAxis: [{
            type: 'value',
            //y轴字体设置
            axisLabel: {
                show: true,
                color: 'white',
                fontSize: 12,
                formatter: function (value) {
                    if (value >= 10000000) {
                        value = value / 10000000 + 'kw';
                    }
                    return value;
                }
            },
            //y轴线设置显示
            axisLine: {
                show: true
            },
            //与x轴平行的线样式
            splitLine: {
                show: true,
                lineStyle: {
                    color: '#17273B',
                    width: 1,
                    type: 'solid',
                }
            }
        }],
        series: [{
            name: "累计确诊",
            type: 'line',
            smooth: true,
            data: []
        }, {
            name: "累计治愈",
            type: 'line',
            smooth: true,
            data: []
        }, {
            name: "累计死亡",
            type: 'line',
            smooth: true,
            data: []
        }]
    };
    var chinaDayList = left1.chinaDayList
    // 遍历每一天的数据
    for (var day of chinaDayList) {
        // 将每天的累计确诊病例数添加到配置项的data中
        option.xAxis[0].data.push(day.date)
        option.series[0].data.push(day.confirm)
        option.series[1].data.push(day.heal)
        option.series[2].data.push(day.dead)
    }
    // 使用刚指定的配置项和数据显示图表。
    left1Chart.setOption(option);
</script>
<script>
    // 初始化echart实例对象
    var myChart = echarts.init(document.getElementById('center2'), 'dark');
    // 指定图表的配置项和数据
    var option = {
        title: {
            text: '全国疫情地图展示',
            textStyle: {
                color: 'gold',
                fontStyle: 'normal',
            },
            left: 'center',
            top: '40px'
        },
        tooltip: {
            trigger: 'item'
        },
        visualMap: { // 左侧小导航图标
            show: true,
            x: 'left',
            y: 'bottom',
            textStyle: {
                fontSize: 8,
            },
            splitList: [{
                start: 1,
                end: 9
            },
                {
                    start: 10,
                    end: 99
                },
                {
                    start: 100,
                    end: 999
                },
                {
                    start: 1000,
                    end: 9999
                },
                {
                    start: 10000
                }
            ],
            color: ['#8A3310', '#C64918', '#E55B25', '#F2AD92', '#F9DCD1']
        },
        series: [{
            name: '累计确诊人数',
            type: 'map',
            mapType: 'china',
            roam: false, // 禁用拖动和缩放
            itemStyle: { // 图形样式
                normal: {
                    borderWidth: .5, //区域边框宽度
                    borderColor: '#009fe8', //区域边框颜色
                    areaColor: "#ffefd5", //区域颜色
                },
                emphasis: { // 鼠标滑过地图高亮的相关设置
                    borderWidth: .5,
                    borderColor: '#4b0082',
                    areaColor: "#fff",
                }
            },
            label: { // 图形上的文本标签
                normal: {
                    show: true, //省份名称
                    fontSize: 8,
                },
                emphasis: {
                    show: true,
                    fontSize: 8,
                }
            },
            data: []
        }]
    };
    // 获取中国各省市特区
    var provinces = center2.areaTree[0].children
    // 遍历每一个省自治区、直辖市
    for (var province of provinces) {
        // 将每个省的累计确诊病例数添加到配置项的data中
        option.series[0].data.push({
            'name': province.name,
            'value': province.total.confirm
        })
    }
    // 使用刚指定的配置项和数据显示图表。
    myChart.setOption(option);
</script>
<script>
    document.getElementById('confirm').innerText = center1.chinaTotal.confirm
    document.getElementById('heal').innerText = center1.chinaTotal.heal
    document.getElementById('dead').innerText = center1.chinaTotal.dead
    document.getElementById('nowConfirm').innerText = center1.chinaTotal.nowConfirm
    document.getElementById('noInfect').innerText = center1.chinaTotal.noInfect
    document.getElementById('importedCase').innerText = center1.chinaTotal.importedCase
</script>
<script>
    // 初始化echart实例对象
    var left2Chart = echarts.init(document.getElementById('left2'), 'dark');
    // 指定图表的配置项和数据
    // ----------左2的配置项-------------------
    var option = {
        title: {
            text: '全国新增趋势',
            textStyle: {
                color: 'white',
            },
            left: 'left',
        },
        tooltip: {
            trigger: 'axis',
            //指示器
            axisPointer: {
                type: 'line',
                lineStyle: {
                    color: '#7171C6'
                }
            },
        },
        //图例
        legend: {
            data: ['新增确诊', '新增疑似'],
            left: 'right'
        },
        //图形位置
        grid: {
            left: '4%',
            right: '6%',
            bottom: '4%',
            top: 50,
            containLabel: true
        },
        xAxis: [{
            type: 'category',
            data: [] // ['03.20', '03.21', '03.22']
        }],
        yAxis: [{
            type: 'value',
            //y轴字体设置
            axisLabel: {
                show: true,
                color: 'white',
                fontSize: 12,
                formatter: function (value) {
                    if (value >= 10000000) {
                        value = value / 10000000 + 'kw';
                    }
                    return value;
                }
            },
            //y轴线设置显示
            axisLine: {
                show: true
            },
            //与x轴平行的线样式
            splitLine: {
                show: true,
                lineStyle: {
                    color: '#17273B',
                    width: 1,
                    type: 'solid',
                }
            }
        }],
        series: [{
            name: '新增确诊',
            type: 'line',
            smooth: true,
            data: [] // [20, 406, 529]
        }, {
            name: '新增疑似',
            type: 'line',
            smooth: true,
            data: [] // [25, 75, 122]
        }]
    };
    var chinaDayAddList = left2.chinaDayAddList
    for (var day of chinaDayAddList) {
        // 将每个省的累计确诊病例数添加到配置项的data中
        option.xAxis[0].data.push(day.date)
        option.series[0].data.push(day.confirm)
        option.series[1].data.push(day.suspect)
    }
    // 使用刚指定的配置项和数据显示图表。
    left2Chart.setOption(option);
</script>
<script>
    // 初始化echart实例对象
    var right1Chart = echarts.init(document.getElementById('right1'), 'dark');
    // ----------右1的配置项-------------------
    var option = {
        title: {
            text: "全国确诊省市TOP10",
            textStyle: {
                color: 'white',
            },
            left: 'left'
        },
        color: ['#3398DB'],
        tooltip: {
            trigger: 'axis',
            //指示器
            axisPointer: {
                type: 'shadow' // 默认为直线,可选为:'line' | 'shadow'
            }
        },
        xAxis: {
            type: 'category',
            data: [] // ['湖北','广州','北京']
        },
        yAxis: {
            type: 'value',
            //y轴字体设置
            axisLabel: {
                show: true,
                color: 'white',
                fontSize: 12,
                formatter: function (value) {
                    if (value >= 1000) {
                        value = value / 1000 + 'k';
                    }
                    return value;
                }
            },
        },
        series: [{
            data: [], // [582, 300, 100]
            type: 'bar',
            barMaxWidth: "50%"
        }]
    };
    // 获取中国各省市特区
    var provinces = right1.areaTree[0].children
    var topData = []
    // 遍历每一个省自治区、直辖市
    for (var province of provinces) {
        // 将每个省的累计确诊病例数添加到配置项的data中
        topData.push({
            'name': province.name,
            'value': province.total.confirm
        })
    }
    topData.sort(function (a, b) {
        return b.value - a.value
    })
    topData.length = 10
    // console.log(topData)
    for (var province of topData) {
        // 将每个省的累计确诊病例数添加到配置项的data中
        option.xAxis.data.push(province.name)
        option.series[0].data.push(province.value)
    }
    // 使用刚指定的配置项和数据显示图表。
    right1Chart.setOption(option);
</script>
<script>
    // 初始化echart实例对象
    var right2Chart = echarts.init(document.getElementById('right2'), 'dark');
    //
    // ----------右2的配置项-------------------
    var option = {
        title: {
            text: "境外输入省市TOP5",
            textStyle: {
                color: 'white',
            },
            left: 'left'
        },
        tooltip: {
            trigger: 'axis',
            //指示器
            axisPointer: {
                type: 'shadow' // 默认为直线,可选为:'line' | 'shadow'
            }
        },
        xAxis: {
            type: 'category',
            data: [] // ['湖北','广州','北京']
        },
        yAxis: {
            type: 'value',
            //y轴字体设置
            axisLabel: {
                show: true,
                color: 'white',
                fontSize: 12,
                formatter: function (value) {
                    if (value >= 1000) {
                        value = value / 1000 + 'k';
                    }
                    return value;
                }
            },
        },
        series: [{
            data: [], // [582, 300, 100]
            type: 'bar',
            barMaxWidth: "50%"
        }]
    };
    // 获取中国各省市特区
    var provinces = right2.areaTree[0].children
    var topData = []
    // 遍历每一个省自治区、直辖市
    for (var province of provinces) {
        // 将每个省的累计确诊病例数添加到配置项的data中
        if (province.children[0].name == '境外输入') {
            topData.push({
                'name': province.name,
                'value': province.children[0].total.confirm
            })
        }

    }
    topData.sort(function (a, b) {
        return b.value - a.value
    })
    topData.length = 5
    for (var province of topData) {
        // 将每个省的累计确诊病例数添加到配置项的data中
        option.xAxis.data.push(province.name)
        option.series[0].data.push(province.value)
    }
    // 使用刚指定的配置项和数据显示图表。
    right2Chart.setOption(option);
</script>
</body>
</html>
body {
    background: #333;
}

#title {
    position: absolute;
    top: 0;
    left: 0;
    width: 100%;
    height: 10%;
    /* background: #555; */
    color: white;
    font-size: 35px;
    /* 弹性盒子布局 */
    display: flex;
    /* 水平剧中*/
    justify-content: center;
    /* 垂直居中*/
    align-items: center;
}

#left1 {
    background: #555;
    width: 30%;
    height: 45%;
    position: absolute;
    top: 10%;
    left: 0;
}

#left2 {
    background: #666;
    width: 30%;
    height: 45%;
    position: absolute;
    top: 55%;
    left: 0;
}

#center1 {
    position: absolute;
    top: 10%;
    left: 30%;
    width: 40%;
    height: 25%;
    /* background: #777; */
    display: flex;
    flex-wrap: wrap;
    /*文本超出后换行*/
}

.item {
    width: 33%;
}

.number {
    height: 60%;
    display: flex;
    justify-content: center;
    align-items: center;
    color: gold;
    font-size: 30px;
    font-weight: bold;
}

.text {
    height: 40%;
    display: flex;
    justify-content: center;
    align-items: center;
    color: white;
    font-size: 18px;
    font-weight: bold;
}

#center2 {
    position: absolute;
    top: 35%;
    left: 30%;
    width: 40%;
    height: 65%;
    background: #888;
}

#right1 {
    position: absolute;
    top: 10%;
    right: 0;
    width: 30%;
    height: 45%;
    background: #999;
}

#right2 {
    position: absolute;
    top: 55%;
    right: 0;
    width: 30%;
    height: 45%;
    background: #333;
}
2.3 可视化展示
我们需要编写获取数据的接口,然后通过ajax来发送请求进行调用,我这里是把读取的数据保存在js,通过调用js代码传入数据。文章来源:https://www.toymoban.com/news/detail-566128.html
2.3.1 左上角板块
def get_left1():
    df = pd.read_csv("./data/data.csv", encoding="gbk")
    df = df[df['countryName'] == '中国']
    df = df[['countryName', 'updateTime', 'confirmedCount', 'curedCount', 'deadCount']]
    df['updateTime'] = df['updateTime'].str.slice(0, -3)
    result = df.groupby('updateTime')[['confirmedCount', 'curedCount', 'deadCount']].sum().reset_index()
    chinaDayList = []
    for index, row in result.iterrows():
        chinaDayList.append({'date': row['updateTime'], 'confirm': row['confirmedCount'], 'heal': row['curedCount'],
                             'dead': row['deadCount']})
    data = 'var left1 = ' + str({"chinaDayList": chinaDayList})
    with open('./static/js/left1.js', 'w') as f:
        f.write(data)
2.3.2 中间上方板块
def get_center1():
    df = pd.read_csv("./data/data.csv", encoding="gbk")
    df = df[df['countryName'] == '中国']
    df = df[['countryName', 'updateTime', 'confirmedCount', 'curedCount', 'deadCount']]
    result = df[['confirmedCount', 'curedCount', 'deadCount']].sum().reset_index()
    confirm = result[index == 'confirmedCount'][0]
    heal = result[index == 'curedCount'][1]
    dead = result[index == 'deadCount'][2]
    nowConfirm = df[df['updateTime'] == max(df['updateTime'])]['confirmedCount'].sum()
    noInfect = df[df['updateTime'] == max(df['updateTime'])]['curedCount'].sum()
    importedCase = df[df['updateTime'] == max(df['updateTime'])]['deadCount'].sum()
    chinaTotal = {'confirm': confirm, 'heal': heal, 'dead': dead, 'nowConfirm': nowConfirm, 'noInfect': noInfect,
                  'importedCase': importedCase}
    data = 'var center1 = ' + str({"chinaTotal": chinaTotal})
    with open('./static/js/center1.js', 'w') as f:
        f.write(data)
2.3.3 右上角板块
def get_right1():
    df = pd.read_csv("./data/data.csv", encoding="gbk")
    df = df[df['countryName'] == '中国']
    df = df[df['provinceName'] != '中国']
    df = df[['countryName', 'provinceName', 'updateTime', 'confirmedCount']]
    df = df[df['updateTime'] == max(df['updateTime'])]
    children = []
    for index, row in df.iterrows():
        children.append({"name": row["provinceName"], "total": {"confirm": row['confirmedCount']}})
    areaTree = {'children': children}
    data = 'var right1 = ' + str({"areaTree": [areaTree]})
    with open('./static/js/right1.js', 'w', encoding='utf-8') as f:
        f.write(data)
2.3.4 左下角板块
def get_left2():
    df = pd.read_csv("./data/data.csv", encoding="gbk")
    df = df[df['countryName'] == '中国']
    df = df[['countryName', 'updateTime', 'confirmedCount', 'currentConfirmedCount']]
    df['updateTime'] = df['updateTime'].str.slice(0, -3)
    result = df.groupby('updateTime')[['confirmedCount', 'currentConfirmedCount']].sum().reset_index()
    chinaDayAddList = []
    for index, row in result.iterrows():
        chinaDayAddList.append(
            {'date': row['updateTime'], 'confirm': row['confirmedCount'], 'suspect': row['currentConfirmedCount']})
    data = 'var left2 = ' + str({"chinaDayAddList": chinaDayAddList})
    with open('./static/js/left2.js', 'w') as f:
        f.write(data)
2.3.5 中间下方板块
def get_center2():
    df = pd.read_csv("./data/data.csv", encoding="gbk")
    df = df[df['countryName'] == '中国']
    df = df[df['provinceName'] != '中国']
    df['provinceName'] = df['provinceName'].str.replace('省', '')
    df['provinceName'] = df['provinceName'].str.replace('自治区', '')
    df['provinceName'] = df['provinceName'].str.replace('回族', '')
    df = df[['countryName', 'provinceName', 'updateTime', 'confirmedCount']]
    df = df[df['updateTime'] == max(df['updateTime'])]
    children = []
    for index, row in df.iterrows():
        children.append({"name": row["provinceName"], "total": {"confirm": row['confirmedCount']}})
    areaTree = {'children': children}
    data = 'var center2 = ' + str({"areaTree": [areaTree]})
    with open('./static/js/center2.js', 'w', encoding='utf-8') as f:
        f.write(data)
2.3.6 右下角板块
def get_right2():
    df = pd.read_csv("./data/data.csv", encoding="gbk")
    df = df[df['countryName'] == '中国']
    df = df[df['provinceName'] != '中国']
    df = df.drop_duplicates(subset=['provinceName'], keep='first')
    df = df[['countryName', 'provinceName', 'updateTime', 'currentConfirmedCount']]
    df = df[df['updateTime'] == max(df['updateTime'])]
    children = []
    for index, row in df.iterrows():
        children.append({"name": row["provinceName"],
                         "children": [{"name": "境外输入", "total": {"confirm": row['currentConfirmedCount']}}]})
    data = 'var right2 = ' + str({"areaTree": [{"children": children}]})
    with open('./static/js/right2.js', 'w', encoding='utf-8') as f:
        f.write(data)
2.4 完整代码&数据集获取
完整代码&数据集可以私聊我获取,还有更多可视化大屏等着你:文章来源地址https://www.toymoban.com/news/detail-566128.html
001 服务大数据可视化监管平台
002 水质情况实时监测预警系统
003 联心菜市场数据中心
004 政务大数据共享交换平台
005 可视化监控管理
006 全国疫情实时监控
007 惠民服务平台
008 兰州智慧消防大数据平台
009 某公司大数据监控平台
010 双数智慧公卫-传染病督导平台
011 大数据可视化系统数据分析通用模版
012 某公司大数据展示模版
013 某公司大数据展示模版
014 时实客流量监控中心
015 广西矿产资源大数据监管平台
016 广西矿产资源大数据监管平台
017 大数据可视化通用素材
018 大数据可视化系统数据分析通用模版
019 大数据可视化系统数据分析通用模版
020 大数据通用模版大标题样式
021 大数据通用模版
022 全息档案平台中心
023 医院大数据展示
024 智慧社区内网比对平台
025 大数据可视化展板通用模板
026 设备环境监测平台
027 全国消费者情况看板
028 移动能耗管理平台
029 南方软件视频平台大屏中心
030 全国图书零售检测中心
031 数据可视化大屏展示系统
032 物流云数据看板平台
033 数据可视化页面设计
034 晋城高速综合管控大数据
035 视频监控前后台通用模板
036 门店销售监控平台
037 建筑智慧工地管控
038 无线网络大数据平台
039 湖南省大数据可视化平台
040 Echart图例使用
041 智慧物流服务中心
042 大数据分析系统
043 网络当天实时发稿量
044 车联网平台数据概览
045 信用风险定位系统(银行版)
046 作战指挥室
047 公司名称大数据可视化平台
048 大数据可视化展板通用模板
049 工厂信息监控台
050 大数据可视化展示平台通用模板
051 通用大数据可视化展示平台模板
052 智慧社区内网比对平台
053 通用大数据可视化展示平台模板
054 公安大数据监控平台2
055 物流大数据服务平台
056 大数据统计展示大屏
057 大屏数据统计
058 大屏数据智慧中心统计
059 物联网平台数据统计
060 广西电子商务公共服务平台大数据中心
061 智慧小区大数据分析
062 数据概览演示案例
063 商品运营大数据
064 设备环境监测平台
065 游戏可视化大数据用户案例
066 系统架构可视化监控
067 xx区智慧旅游综合服务平台
068 中国电信厅店营业效能分析
069 智能看板新中心
070 翼兴消防监控
071 市突发预警平台实时监控
072 大连市突发预警实时监控
073 观测站综合监控平台
074 酒机运行状态
075 数据可视化展示
076 交管大数据人脸识别系统
078 河长制大数据显示平台
079 保税区A仓监控中心
080 北斗车联网大数据平台
081 北京市执法信息平台
082 南方草木商品交易[超级大屏]
083 兴福公安综合监管大屏
084 压力容器大屏
085 车辆综合管控平台
086 物流大数据展示系统
087 农业产业大数据指挥仓系统
088 HTML大数据综合分析平台模板
089 警务综合监控管理平台HTML模板
090 企业营收大数据统计可视化大屏
091 ECharts扩展示例自定义视图
092 酷炫大屏数据可视化模板
093 办税渠道运行状态大数据监控平台
094 大数据统计展示大屏
095 交通大数据展示平台
096 智慧农业大数据展示
097 程序员数据可视化大屏展示
098 销售大数据分析
099 英雄联盟LPL比赛数据可视化
100 新型冠状肺炎实时监测大屏
3、号外
- 如果我的博客对你有帮助、如果你喜欢我的博客内容,请 “👍点赞” “✍️评论” “💙收藏” 一键三连哦!
- 【👇🏻👇🏻👇🏻关注我| 获取更多源码 | 定制源码】大学生毕设模板、期末大作业模板 、Echarts大数据可视化等! 「一起探讨 ,互相学习」!(vx:python812146)
- 以上内容技术相关问题😈欢迎一起交流学习👇🏻👇🏻👇🏻🔥
到了这里,关于Flask+Echarts搭建全国疫情可视化大屏的文章就介绍完了。如果您还想了解更多内容,请在右上角搜索TOY模板网以前的文章或继续浏览下面的相关文章,希望大家以后多多支持TOY模板网!


