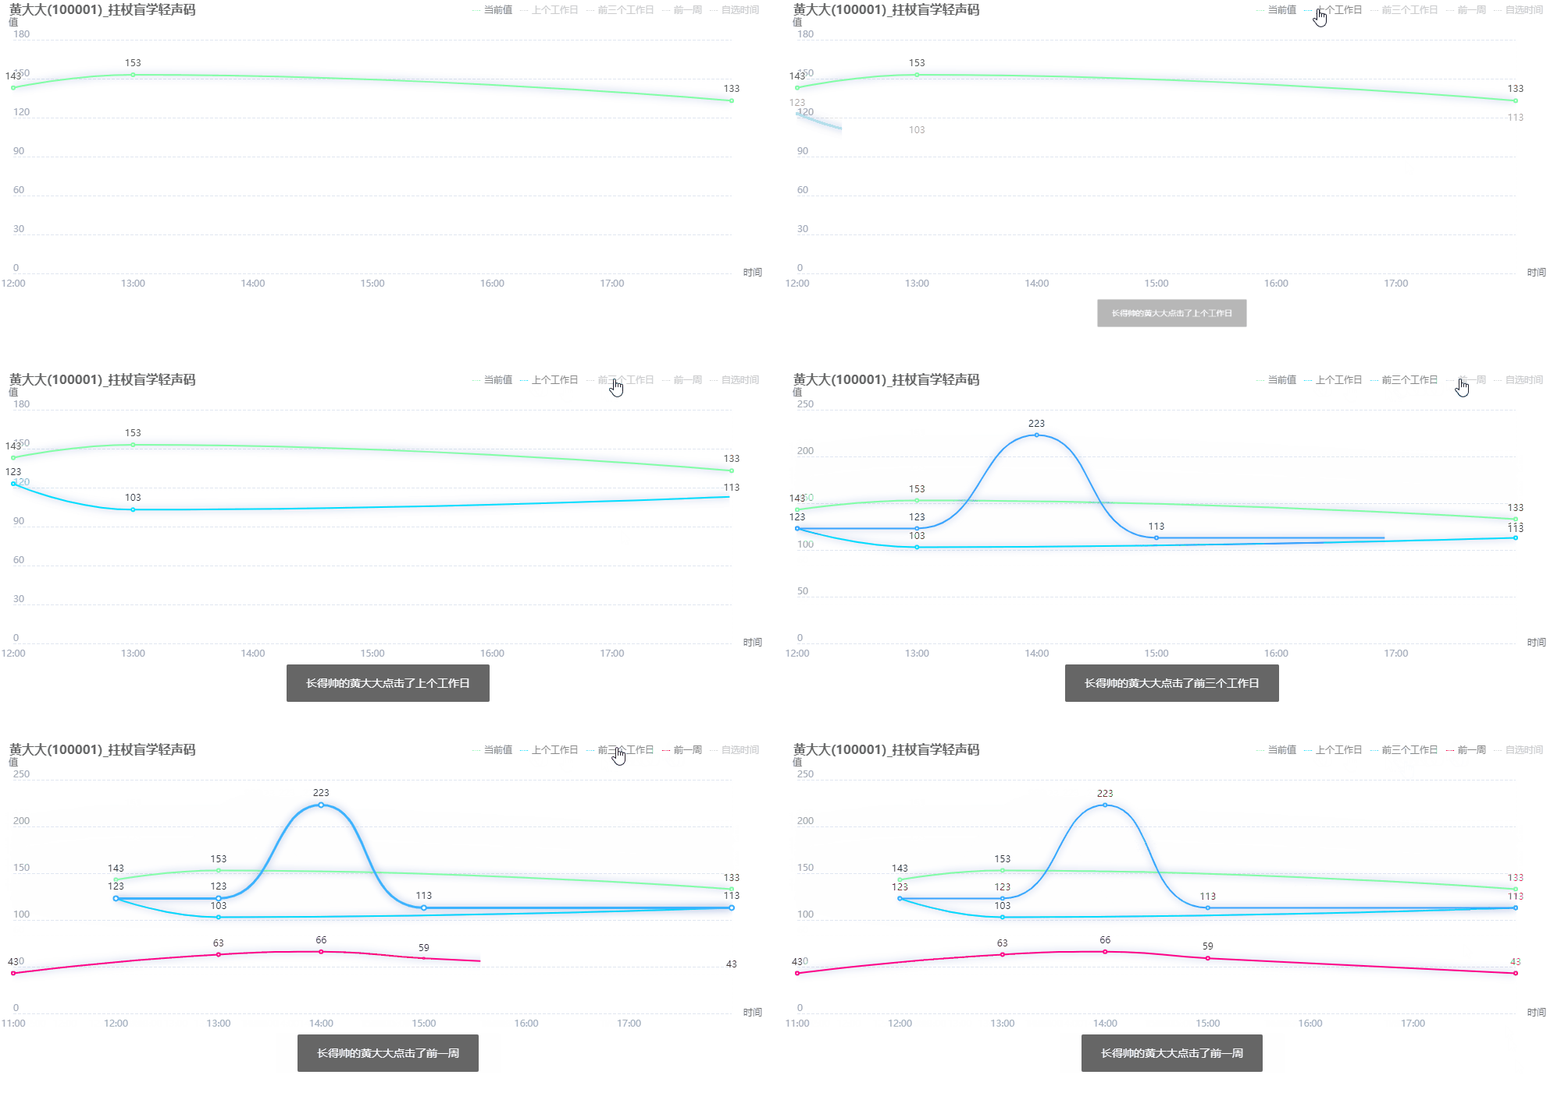
折线图点击事件代码:文章来源:https://www.toymoban.com/news/detail-599144.html
 let myChart = this.$echarts.init(document.getElementById('trendBoxECharts'))

  myChart.getZr().on('click', params => {
          console.log(params)
          let pointInPixel = [params.offsetX, params.offsetY]
          if (myChart.containPixel('grid', pointInPixel)) {
            //点击第几个柱子
            let pointInGrid = myChart.convertFromPixel({ seriesIndex: 0 }, pointInPixel)
            // 也可以通过params.offsetY 来判断鼠标点击的位置是否是图表展示区里面的位置
            // 也可以通过name[xIndex] != undefined,name是x轴的坐标名称来判断是否还是点击的图表里面的内容
            // x轴数据的索引
            let xIndex = pointInGrid[0]
            console.log('当前点击的索引', xIndex)
          }
})完整代码如下:文章来源地址https://www.toymoban.com/news/detail-599144.html
<template>
  <div class="trendBox">
    <div class="header-title">
      故障趋势

      <div class="month-picker">
        <el-date-picker
          @change="getMonth"
          v-model="monthData"
          value-format="yyyy-MM"
          type="month"
          placeholder="选择日期时间">
        </el-date-picker>
      </div>
    </div>

    <div id="trendBoxECharts"></div>
  </div>
</template>

<script>
  import { getLedgersWarnsList } from '@/api/fault/statisticAnalysis'

  export default {
    name: 'trendBox',
    components: {},
    props: {},
    data() {
      return {
        monthData: null,
        xData: [], // ['12-26', '12-27', '12-28', '12-29', '12-30', '12-31', '01-01', '01-02', '01-03', '01-04', '01-05', '01-06', '01-07', '01-08', '01-09']
        yData: [] // [0, 10, 2, 4, 4, 7, 0, 0, 0, 3, 0, 9, 6, 0, 0]
      }
    },
    methods: {
      getMonth(data) {
        console.log(data)
      },

      getTrendBoxECharts() {
        getLedgersWarnsList().then(res => {
          this.xData = res.data.date
          this.yData = res.data.value
        })
      },

      initTrendBoxECharts() {
        let option = {
          // title: {
          //   text: '这是标题',
          //   textStyle: { color: '#666', fontSize: 14, fontWeight: 'normal' },
          //   padding: [5, 0, 0, 0],
          // },
          legend: {
            show: false
          },
          grid: {
            left: 0,
            top: 10,
            bottom: 0,
            right: 0,
            containLabel: true
          },
          xAxis: {
            type: 'category',
            data: this.xData,
            axisLine: { lineStyle: { color: '#ccc' } },
            axisTick: { length: 3 },
            axisLabel: { color: '#999' }
          },
          yAxis: {
            type: 'value',
            axisLine: { show: true, lineStyle: { color: '#ccc' } },
            axisLabel: { color: '#999' },
            splitLine: { show: false }
          },
          tooltip: {
            trigger: 'axis',
            padding: [12, 17, 20, 23],
            textStyle: { color: '#424242' },
            renderMode: 'html',
            className: 'tooltip'
          },
          series: [
            {
              name: '故障',
              type: 'line',
              data: this.yData,
              smooth: true, // 平滑曲线
              showSymbol: false,
              itemStyle: { color: '#126EFC' },
              lineStyle: { width: 3, color: '#126EFC' },
              areaStyle: { color: 'rgba(0, 110, 254, 0.1)' }
            }

          ]
        }

        let myChart = this.$echarts.init(document.getElementById('trendBoxECharts'))
        myChart.setOption(option)
        myChart.getZr().on('click', params => {
          console.log(params)
          let pointInPixel = [params.offsetX, params.offsetY]
          if (myChart.containPixel('grid', pointInPixel)) {
            //点击第几个柱子
            let pointInGrid = myChart.convertFromPixel({ seriesIndex: 0 }, pointInPixel)
            // 也可以通过params.offsetY 来判断鼠标点击的位置是否是图表展示区里面的位置
            // 也可以通过name[xIndex] != undefined,name是x轴的坐标名称来判断是否还是点击的图表里面的内容
            // x轴数据的索引
            let xIndex = pointInGrid[0]
            console.log('当前点击的索引', xIndex)
          }
        })

        // 随着屏幕大小调节图表
        window.addEventListener('resize', () => {
          myChart.resize()
        })
      }
    },
    created() {
      this.getTrendBoxECharts()
    },
    mounted() {
      setTimeout(() => {
        this.initTrendBoxECharts()
      }, 500)
    }
  }
</script>

<style lang="scss" scoped>
  .trendBox {
    width: 100%;
    height: 100%;

    .header-title {
      height: 80px;
      line-height: 80px;
      font-size: 20px;
      font-weight: bold;
      color: #333333;
      margin: 0 20px;
      letter-spacing: 1px;
      display: flex;
      justify-content: space-between;

      .month-picker {
      }
    }

    #trendBoxECharts {
      width: 100%;
      height: calc(100% - 80px);
      padding: 0 20px 20px;
    }
  }
</style>
到了这里,关于echarts实现渐变折线图并添加点击事件的文章就介绍完了。如果您还想了解更多内容,请在右上角搜索TOY模板网以前的文章或继续浏览下面的相关文章,希望大家以后多多支持TOY模板网!


