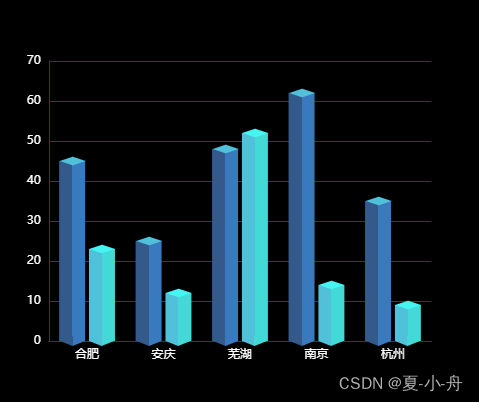
在vue2项目里面,研究了哈,这里记录下eacharts 实现3D效果柱状图
在main.js引入eacharts文章来源:https://www.toymoban.com/news/detail-606225.html
import echarts from 'echarts'
Vue.prototype.$echarts = echarts
<template>
  <scale-card title="月度故障业务平均恢复时长" iconname="el-icon-data-analysis">
    <div class="chart-container">
      <div ref="chart" class="chart" />
    </div>
  </scale-card>
</template>
export default{
	data() {
      return {
        statusChart: null
      }
    },
    mounted() {
      this.initChart()
      // 根据窗口变化自动调节图表大小
      window.addEventListener('resize', this.changeSize)
    },
    beforeDestroy() {
      console.log('销毁')
      this.statusChart && this.statusChart.dispose()
      window.removeEventListener('resize', this.changeSize)
    },
    methods:{
	    // 自适应宽高
	    changeSize() {
	        this.statusChart.resize()
	    }
	    initChart() {
	      	this.statusChart = this.$echarts.init(this.$refs.chart)
	        var colorArr = ['#0C628C', '#3887D5', '#2570BB']
	        var color = {
	          type: 'linear',
	          x: 0,
	          x2: 1,
	          y: 0,
	          y2: 0,
	          colorStops: [
	            {
	              offset: 0,
	              color: colorArr[0]
	            },
	            {
	              offset: 0.5,
	              color: colorArr[0]
	            },
	            {
	              offset: 0.5,
	              color: colorArr[1]
	            },
	            {
	              offset: 1,
	              color: colorArr[1]
	            }
	          ]
	        }
	        var barWidth = 30
	        const xAxisData = ['区域1', '区域2', '区域3', '区域4', '区域5', '区域6', '区域7', '区域8', '区域9']
	        var data1 = [6, 7, 3, 11, 33, 38, 22, 55, 66]
	        var bottomData = [1, 1, 1, 1, 1, 1, 1, 1, 1]
	        var topData = [100, 100, 100, 100, 100, 100, 100, 100, 100]
	        // 指定图表的配置项和数据
	        const option = {
	          backgroundColor: 'rgba(0,0,0,0)',
	          tooltip: {
	            trigger: 'axis',
	            formatter: function(params) {
	              var str = params[0].name + ':'
	              params.filter(function(item) {
	                if (item.componentSubType == 'bar') {
	                  str += '<br/>' + item.seriesName + ':' + item.value
	                }
	              })
	              return str
	            }
	          },
	          grid: {
	            x: '7%',
	            x2: '0%',
	            y: '15%',
	            y2: '15%'
	          },
	          xAxis: {
	            type: 'category',
	            data: xAxisData,
	            // 更改坐标轴颜色
	            axisLine: {
	              lineStyle: {
	                color: this.fontColorX
	              },
	              onZero: false
	            },
	            // x轴的字体样式
	            axisLabel: {
	              interval: 0,
	              textStyle: {
	                color: this.fontColorX, // 更改坐标轴文字颜色
	                fontSize: 14, // 更改坐标轴文字大小
	                fontFamily: 'MicrosoftYaHei'
	              },
	              // X轴lable的处理函数,如果x轴的lable有空格,比如:['AM点检 异常', 'PM巡检 异常', 'PM保养 异常'],这里会以空格为分割,显示两行
	              formatter: function(params) {
	                return params.split(' ').join('\n')
	                //                console.log(' formatter',params);
	              }
	            }

	          },
	          yAxis: {
	            type: 'value',
	            axisLabel: {
	              formatter: '{value}',
	              textStyle: {
	                color: this.fontColorY, // 更改坐标轴文字颜色
	                fontSize: 12, // 更改坐标轴文字大小
	                fontFamily: 'MicrosoftYaHei'
	              }
	            },
	            // 更改坐标轴颜色
	            axisLine: {
	              lineStyle: {
	                color: '#657CA8'
	              }
	            },
	            // 网格线
	            splitLine: {
	              // 网格线
	              lineStyle: {
	                type: 'solid',
	                with: 0.5,
	                color: this.borderColor
	              }
	            }
	          },
	          series: [
	            // 数据低下的圆片
	            {
	              name: '',
	              type: 'pictorialBar',
	              symbolOffset: ['0%', '50%'],
	              symbolSize: [barWidth - 4, (10 * (barWidth - 4)) / barWidth],
	              z: 12,
	              symbol: 'diamond',
	              itemStyle: {
	                opacity: 1,
	                color: color
	              // color: 'transparent'
	              },
	              data: bottomData
	            },
	            // 数据的柱状图
	            {
	              name: '',
	              type: 'bar',
	              barWidth: barWidth,
	              itemStyle: {
	                // lenged文本
	                opacity: 1, // 这个是 透明度
	                color: color
	              },

	              data: data1
	            },
	            // 替代柱状图 默认不显示颜色,是最下方柱图(邮件营销)的value值 - 20
	            {
	              type: 'bar',
	              symbol: 'diamond',
	              barWidth: barWidth + 2,
	              itemStyle: {
	                color: 'transparent'
	              },
	              data: data1
	            },
	            // 数据顶部的样式
	            {
	              name: '',
	              type: 'pictorialBar',
	              symbol: 'diamond',
	              symbolOffset: ['0%', '-50%'],
	              symbolSize: [barWidth, 10],
	              z: 12,
	              itemStyle: {
	                normal: {
	                  opacity: 1,
	                  color: colorArr[2],
	                  label: {
	                    show: true, // 开启显示
	                    position: 'top', // 在上方显示
	                    textStyle: {
	                      // 数值样式
	                      color: '#FFFFFF',
	                      fontSize: 12,
	                      top: 50
	                    }
	                  }
	                }
	              },
	              symbolPosition: 'end',
	              data: data1
	            },

	            // 阴影的顶部
	            {
	              name: '', // 头部
	              type: 'pictorialBar',
	              symbol: 'diamond',
	              symbolOffset: ['0%', '-50%'],
	              symbolSize: [barWidth, 10],
	              z: 12,
	              symbolPosition: 'end',
	              itemStyle: {
	                color: 'rgba(18, 47, 133,0.5)',
	                opacity: 0.3,
	                borderWidth: 1,
	                borderColor: 'rgba(18, 47, 133,1)'
	              },
	              data: topData
	            },
	            // 后面的背景
	            {
	              name: '2019',
	              type: 'bar',
	              barWidth: barWidth,
	              barGap: '-100%',
	              z: 0,
	              itemStyle: {
	                color: 'rgba(18, 47, 133,0.3)'
	              },

	              data: topData
	            }
	          ]
	        }
	        this.statusChart.setOption(option)
	    },
    }
}
展示效果:大屏demo 文章来源地址https://www.toymoban.com/news/detail-606225.html
到了这里,关于vue echarts实现3D效果柱状图的文章就介绍完了。如果您还想了解更多内容,请在右上角搜索TOY模板网以前的文章或继续浏览下面的相关文章,希望大家以后多多支持TOY模板网!


