一、SQL执行频率
MySQL客户端 连接成功后,通过show [session | global] status 命令可以提供服务器状态信息,通过如下指令,可以查看当前数据库的insert,update,dalete,select的访问频次
show [global | session] status like "Com_______"; # 七个_ 表示起个通配符
mysql> show global status like 'Com_______';
+---------------+-------+
| Variable_name | Value |
+---------------+-------+
| Com_binlog    | 0     |
| Com_commit    | 0     |
| Com_delete    | 0     |
| Com_import    | 0     |
| Com_insert    | 0     |
| Com_repair    | 0     |
| Com_revoke    | 0     |
| Com_select    | 4     |
| Com_signal    | 0     |
| Com_update    | 0     |
| Com_xa_end    | 0     |
+---------------+-------+
11 rows in set (0.00 sec)
说明1:上面的数据库被执行查询4次
文章来源地址https://www.toymoban.com/news/detail-607126.html
二、慢查询日志
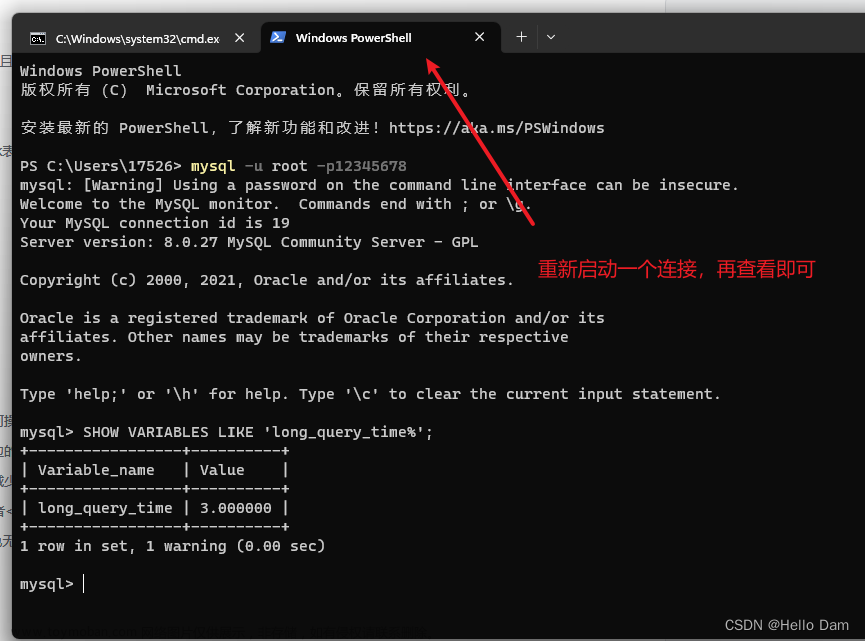
慢查询日志记录了所有执行时间超过指定参数(long_query_time 单位:秒,默认10秒)的所有SQL语句的日志,Mysql的慢查询日志默认没有开启,需要在Mysql的配置文件中(通常在/etc/my.cnf)中配置如下信息:
可以使用一下语句查询慢查询是否开启
mysql> show variables like 'slow_query_log';
+----------------+-------+
| Variable_name  | Value |
+----------------+-------+
| slow_query_log | OFF   |
+----------------+-------+
1 row in set (0.01 sec)
说明:慢查询默认是关闭的
# 开启慢查询
slow_query_log=1

# 设置慢查询的时间
long_query_time=2
再次查询
mysql> show variables like 'slow_query_log';
+----------------+-------+
| Variable_name  | Value |
+----------------+-------+
| slow_query_log | ON    |
+----------------+-------+
1 row in set (0.00 sec)
慢日志文件通常指mysql的安装目录里面的data文件夹中。
三、profile
3.1 show profiles
可以查看每一条SQL的耗时基本情况
mysql> show profiles;
+----------+-------------+-----------------------------------------------------------------------+
| Query_ID | Duration    | Query                                                                 |
+----------+-------------+-----------------------------------------------------------------------+
|       11 |  0.00020000 | SELECT DATABASE()                                                     |
|       12 |  0.00029000 | SELECT DATABASE()                                                     |
|       13 |  0.00040900 | SELECT DATABASE()                                                     |
|       14 |  0.00145600 | show databases                                                        |
|       15 |  0.00279800 | show tables                                                           |
|       16 | 12.28066100 | select * from account_transaction                                     |
|       17 |  0.00166700 | select * from account_transaction where id = 1                        |
|       18 |  6.01525200 | select * from account_transaction where trade_no="164126925202017539" |
|       19 |  6.64749300 | select * from account_transaction where trade_no="164126925202017539" |
|       20 |  5.39658800 | select * from account_transaction where trade_no="164126923751014167" |
|       21 |  0.00067300 | select * from account_transaction where id=100                        |
|       22 |  0.00046900 | select * from account_transaction where id=1000                       |
|       23 |  0.00045200 | select * from account_transaction where id=10000                      |
|       24 |  0.00052900 | select * from account_transaction where id=100000                     |
|       25 |  0.00038300 | select * from account_transaction where id=20000                      |
+----------+-------------+-----------------------------------------------------------------------+
15 rows in set, 1 warning (0.00 sec)
说明1:第16条查询全部数据花费了12.28秒,第17条根据id查询只花费了0.001秒,第18条通过普通字段查询花费了6.00秒
说明2:SQL中能不做全量查询就不要做全量查询。
说明3:SQL中能通过id查询就不要通过其他字段查询,因为毕竟其他字段的查询还是会根据二级索引查到id,再根据id查询到具体的数据的。
3.2 have_profiling
参数have_profiling能够看到当前mysql是否支持profile操作:
mysql> select @@have_profiling;
+------------------+
| @@have_profiling |
+------------------+
| YES              |
+------------------+
1 row in set, 1 warning (0.00 sec)
说明1:这里的YES只是说明该版本的mysql是支持profile操作的,但是不代表profile操作是开始的,仅代表有这个功能而已!
默认profiling是关闭的,可以通过set语句在session/global级别开启profiling;
mysql> select @@profiling;
+-------------+
| @@profiling |
+-------------+
|           0 |
+-------------+
1 row in set, 1 warning (0.01 sec)
3.3 开启profiling
mysql> set profiling=1;
Query OK, 0 rows affected, 1 warning (0.00 sec)

mysql> select @@profiling;
+-------------+
| @@profiling |
+-------------+
|           1 |
+-------------+
1 row in set, 1 warning (0.00 sec)
3.4 查看指定SQL耗时
通过带query_id的SQL语句各个阶段的耗时情况
show profile for query query_id;
mysql> show profile for query 20;
+--------------------------------+----------+
| Status                         | Duration |
+--------------------------------+----------+
| starting                       | 0.000083 |
| Executing hook on transaction  | 0.000007 |
| starting                       | 0.000007 |
| checking permissions           | 0.000006 |
| Opening tables                 | 0.000107 |
| init                           | 0.000012 |
| System lock                    | 0.000010 |
| optimizing                     | 0.000012 |
| statistics                     | 0.000025 |
| preparing                      | 0.000041 |
| executing                      | 5.393642 |
| end                            | 0.000016 |
| query end                      | 0.000005 |
| waiting for handler commit     | 0.000009 |
| closing tables                 | 0.000009 |
| freeing items                  | 0.002130 |
| logging slow query             | 0.000426 |
| cleaning up                    | 0.000041 |
+--------------------------------+----------+
18 rows in set, 1 warning (0.01 sec)
3.5 查看指定SQL的CPU使用情况
show profile cpu for query query_id
mysql> show profile cpu for query 20;
+--------------------------------+----------+----------+------------+
| Status                         | Duration | CPU_user | CPU_system |
+--------------------------------+----------+----------+------------+
| starting                       | 0.000083 | 0.000072 |   0.000009 |
| Executing hook on transaction  | 0.000007 | 0.000003 |   0.000004 |
| starting                       | 0.000007 | 0.000006 |   0.000002 |
| checking permissions           | 0.000006 | 0.000004 |   0.000002 |
| Opening tables                 | 0.000107 | 0.000058 |   0.000017 |
| init                           | 0.000012 | 0.000005 |   0.000006 |
| System lock                    | 0.000010 | 0.000008 |   0.000002 |
| optimizing                     | 0.000012 | 0.000010 |   0.000002 |
| statistics                     | 0.000025 | 0.000023 |   0.000001 |
| preparing                      | 0.000041 | 0.000027 |   0.000014 |
| executing                      | 5.393642 | 2.294837 |   0.151005 |
| end                            | 0.000016 | 0.000007 |   0.000009 |
| query end                      | 0.000005 | 0.000003 |   0.000001 |
| waiting for handler commit     | 0.000009 | 0.000009 |   0.000001 |
| closing tables                 | 0.000009 | 0.000008 |   0.000002 |
| freeing items                  | 0.002130 | 0.000037 |   0.000063 |
| logging slow query             | 0.000426 | 0.000034 |   0.000175 |
| cleaning up                    | 0.000041 | 0.000021 |   0.000018 |
+--------------------------------+----------+----------+------------+
18 rows in set, 1 warning (0.00 sec)
四、explain执行计划
explain 或者 desc 命令获取Mysql如何执行select 语句的信息,包括在select 语句在执行过程中表如何连接,及连接的顺序
4.1 语法
explain/desc select 字段列表 from 表名 where 条件;
4.2 示例
mysql> select * from account_transaction where id=100;
+-----+--------------------+--------+--------+----------------------------+---------------+--------------+--------+---------+-----------------+-------------------+-----------+--------+
| id  | trade_no           | type   | method | time                       | payment       | out_trade_no | amount | balance | trader_staff_id | operator_staff_id | device_id | remark |
+-----+--------------------+--------+--------+----------------------------+---------------+--------------+--------+---------+-----------------+-------------------+-----------+--------+
| 100 | 156384784634000449 | TOP_UP | CASH   | 2019-07-23 02:10:46.929559 | LOCAL_ACCOUNT |              |  10000 |   10000 |             449 |                11 | 7         |        |
+-----+--------------------+--------+--------+----------------------------+---------------+--------------+--------+---------+-----------------+-------------------+-----------+--------+
1 row in set (0.00 sec)

mysql> explain select * from account_transaction where id=100;
+----+-------------+---------------------+------------+-------+---------------+---------+---------+-------+------+----------+-------+
| id | select_type | table               | partitions | type  | possible_keys | key     | key_len | ref   | rows | filtered | Extra |
+----+-------------+---------------------+------------+-------+---------------+---------+---------+-------+------+----------+-------+
|  1 | SIMPLE      | account_transaction | NULL       | const | PRIMARY       | PRIMARY | 4       | const |    1 |   100.00 | NULL  |
+----+-------------+---------------------+------------+-------+---------------+---------+---------+-------+------+----------+-------+
1 row in set, 1 warning (0.00 sec)
4.3 explain字段含义
参数id:select查询的序列号,表示查询语句中的执行顺序,如果id相同,执行顺序从上到下,id不同,值越大,越先执行
mysql> select s.*, c.* from student s, course c,student_course sc where s.id=sc.student_id and c.id = sc.course_id;
+----+--------+----+--------+
| id | name   | id | name   |
+----+--------+----+--------+
|  1 | 张三   |  1 | java   |
|  1 | 张三   |  2 | python |
|  1 | 张三   |  3 | php    |
|  2 | 李四   |  2 | python |
|  2 | 李四   |  3 | php    |
|  3 | 王五   |  4 | C      |
+----+--------+----+--------+
6 rows in set (0.03 sec)

mysql> explain select s.*, c.* from student s, course c,student_course sc where s.id=sc.student_id and c.id = sc.course_id;
+----+-------------+-------+------------+--------+----------------------------+---------+---------+-------------------------+------+----------+--------------------------------------------+
| id | select_type | table | partitions | type   | possible_keys              | key     | key_len | ref                     | rows | filtered | Extra                                      |
+----+-------------+-------+------------+--------+----------------------------+---------+---------+-------------------------+------+----------+--------------------------------------------+
|  1 | SIMPLE      | s     | NULL       | ALL    | PRIMARY                    | NULL    | NULL    | NULL                    |    4 |   100.00 | NULL                                       |
|  1 | SIMPLE      | sc    | NULL       | ALL    | fk_course_id,fk_student_id | NULL    | NULL    | NULL                    |    6 |    33.33 | Using where; Using join buffer (hash join) |
|  1 | SIMPLE      | c     | NULL       | eq_ref | PRIMARY                    | PRIMARY | 4       | mysql_test.sc.course_id |    1 |   100.00 | NULL                                       |
+----+-------------+-------+------------+--------+----------------------------+---------+---------+-------------------------+------+----------+--------------------------------------------+
3 rows in set, 1 warning (0.00 sec)
说明1:这一个select语句中,涉及到了三个表,所以有三条执行记录。
说明2:虽然搜索的顺序是student,course,student_course,但是执行顺序是student,student_course,course,因为两个表是没有关系的,需要依靠第三张关系表维系
说明3:这是一个三个都是相同id的案例
mysql>   select * from student where id in(select student_id from student_course where course_id = (select id from course where name = "python"));
+----+--------+
| id | name   |
+----+--------+
|  1 | 张三   |
|  2 | 李四   |
+----+--------+
2 rows in set (0.00 sec)

mysql> explain select * from student where id in(select student_id from student_course where course_id = (select id from course where name = "python"));
+----+--------------+----------------+------------+--------+----------------------------+--------------+---------+------------------------+------+----------+-------------+
| id | select_type  | table          | partitions | type   | possible_keys              | key          | key_len | ref                    | rows | filtered | Extra       |
+----+--------------+----------------+------------+--------+----------------------------+--------------+---------+------------------------+------+----------+-------------+
|  1 | PRIMARY      | <subquery2>    | NULL       | ALL    | NULL                       | NULL         | NULL    | NULL                   | NULL |   100.00 | NULL        |
|  1 | PRIMARY      | student        | NULL       | eq_ref | PRIMARY                    | PRIMARY      | 4       | <subquery2>.student_id |    1 |   100.00 | NULL        |
|  2 | MATERIALIZED | student_course | NULL       | ref    | fk_course_id,fk_student_id | fk_course_id | 4       | const                  |    2 |   100.00 | Using where |
|  3 | SUBQUERY     | course         | NULL       | ALL    | NULL                       | NULL         | NULL    | NULL                   |    4 |    25.00 | Using where |
+----+--------------+----------------+------------+--------+----------------------------+--------------+---------+------------------------+------+----------+-------------+
4 rows in set, 1 warning (0.00 sec)
说明1:id值越大,越先被执行,所以这个查询,先执行course表的查询,在执行student_course表,最后执行student表
参数select_type:表示select的类型,常见的取值有,SIMPLE、PRIMARY、UNION、SUBQUERY
参数type:表示连接的类型,性能由好到差的链接类型为NULL、system、const、eq_ref、ref、range、index、all;
-
- 当查询语句中不使用任何表,则查询类型为最优的,但是却在实际工作中,很难做到,不查询表,不然查询的意义是什么呢。
- 当查询系统表的时候,type会为system,所以一般系统表查询比较快
- 当查询id主键或者唯一索引的时候,会出现const类型
- 当查询使用非唯一索引的时候,会出现ref
- 当全表查询的时候会出现all
参数possible_key:可能的索引,一个或者多个
参数key:是实际用到的索引,如果为NULL,则表示没有使用索引
参数key_len:表示索引中使用的字节数,该值为索引字段最大可能长度,并非实际使用长度,在不损失精确性的前提下,长度越短越好。
参数rows:MySQL认为必须要执行的查询的行数,在InnoDB引擎中,是一个估计值,可能并不总是准确的
参数filtered:表示返回结果的行数占需要读取行数的百分比,filtered的值越大越好文章来源:https://www.toymoban.com/news/detail-607126.html
到了这里,关于Mysql高级2-SQL性能分析的文章就介绍完了。如果您还想了解更多内容,请在右上角搜索TOY模板网以前的文章或继续浏览下面的相关文章,希望大家以后多多支持TOY模板网!

![[MySQL] SQL优化之性能分析](https://imgs.yssmx.com/Uploads/2024/02/755810-1.png)