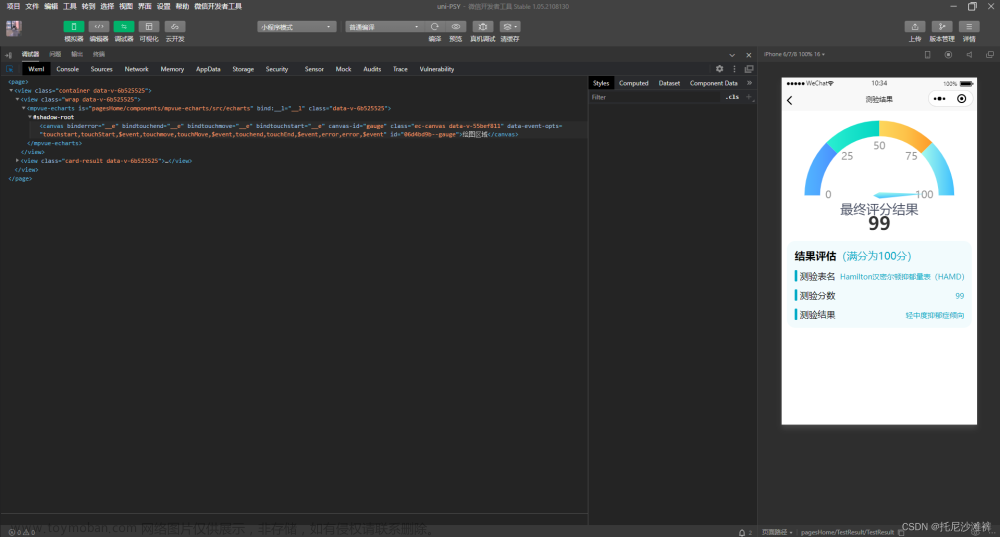
renderjs是一个运行在视图层的js。它比WXS更加强大。它只支持app-vue和h5。
renderjs的主要作用有2个:
1、大幅降低逻辑层和视图层的通讯损耗,提供高性能视图交互能力
2、在视图层操作dom,运行for web的js库
就是vue本身不支持直接通过原生JS操作DOM,于是在uniapp里,可以通过renderjs来实现逻辑层(vue的template或者说虚拟dom)与视图层(原生dom)之间的通讯,或者说操作。
注意点:
1、目前仅支持内联使用。
2、不要直接引用大型类库,推荐通过动态创建 script 方式引用。
3、可以使用 vue 组件的生命周期不可以使用 App、Page 的生命周期
4、视图层和逻辑层通讯方式与 WXS 一致,另外可以通过 this.$ownerInstance获取当前组件的 ComponentDescriptor 实例。
5、观测更新的数据在视图层可以直接访问到。
6、APP 端视图层的页面引用资源的路径相对于根目录计算,例如:./static/test.js。
7、APP 端可以使用 dom、bom API,不可直接访问逻辑层数据,不可以使用 uni 相关接口(如:uni.request)
8、H5 端逻辑层和视图层实际运行在同一个环境中,相当于使用 mixin 方式,可以直接访问逻辑层数据。文章来源:https://www.toymoban.com/news/detail-612194.html
实现:本demo利用的是 klinecharts (k线图的echart)文章来源地址https://www.toymoban.com/news/detail-612194.html
父组件
<template>
	<view class="chart" style="overflow: hidden;">
		<newchart ref="newchart" :detail="detail"></newchart>
	</view>
</template>
xxxx 逻辑代码


子组件
<template>
	<view
	:prop="historyList" :change:prop="klinecharts.updateEcharts"
	:datas="newdatas" :change:datas="klinecharts.updatenewdatas"

	ref="k-line-chart" id="k-line-chart" class="kling cb"></view>
</template>
<script>
	import {
		mapState, mapMutations
	} from 'vuex'
	export default {
		data() {
			return {
				domChart:null,
				historyList:[],
				newdatas:{},
			}
		},
		props:{
			detail:{

			}
		},
		onReady() {
			this.$ws.init()
		},
		computed: {
			...mapState('chart', ['categories', 'series']),
			seriesData() {
				return this.series

			}
		},
		watch:{
			detail(newV){
				this.$nextTick(() => {
					this.historyList = newV
				})
			},
			seriesData(newValue, oldValue) {
				this.newdatas = newValue
			}
		},
		methods:{

		}
	}
</script>
<script module="klinecharts" lang="renderjs">
	import {init} from 'klinecharts'
	import klinConfig from '@/utils/klinConfig.js' // 样式处理
	export default {
		data() {
			return {
				domChart:null,
				historyList:[]
			}
		},
		mounted() {
			const chart = init(document.getElementById('k-line-chart'))
			chart.setStyleOptions(klinConfig)
			chart.overrideTechnicalIndicator({
				name: 'MA',
				calcParams: [5, 10, 30]
			})

			chart.createTechnicalIndicator('MA', false, {
				id: 'candle_pane'
			})
			chart.setPriceVolumePrecision(5, 5)
			this.domChart = chart
		},

		methods: {
			 updateEcharts(newValue, oldValue, ownerInstance, instance) {
				let _this = this
				this.$nextTick(() => {
					_this.domChart.applyNewData(newValue, 0);
				})
			},
			updatenewdatas(newValue, oldValue, ownerInstance, instance){
				let _this = this
				this.$nextTick(() => {
					//更新参数
					this.domChart.updateData({
						timestamp: Number(newValue.timestamp),
						open: parseFloat(newValue.open),
						high: parseFloat(newValue.high),
						low: parseFloat(newValue.low),
						close: parseFloat(newValue.close)
					})


				})
			}
		}
	}
</script>
到了这里,关于关于uniapp打包成app echart数据不显示的 renderjs问题的文章就介绍完了。如果您还想了解更多内容,请在右上角搜索TOY模板网以前的文章或继续浏览下面的相关文章,希望大家以后多多支持TOY模板网!


