生命游戏
游戏的宇宙是无限可扩展的二维矩形网格,群体是那些标注为存活的网格的集合。群体可以依照称为代的离散时间步距进化。在每一步中,每个网格的命运由它周围最近的8个网格邻居的活度决定,规则如下:
如果一个存活的网格有两个(或三个)存活的邻居,或者一个死亡的网格周围有三个存活的邻居,则它在下一步中也是存活的。
滑翔机
滑翔机五网格群体初始结构,每一步进化过程中,都有两个网格死亡,并有两个新网格出生。
访问周围网格,并计算存活数目
      n = size(X,1);
      p = [1 1:n-1];
      q = [2:n n];

      % Count how many of the eight neighbors are alive.

      Y = X(:,p) + X(:,q) + X(p,:) + X(q,:) + ...
          X(p,p) + X(q,q) + X(p,q) + X(q,p);

      % A live cell with two live neighbors, or any cell with
      % three live neigbhors, is alive at the next step.

      X = (X & (Y == 2)) | (Y == 3);

      [loop,buttons] = query_buttons(buttons,pop);
      t = t + 1;
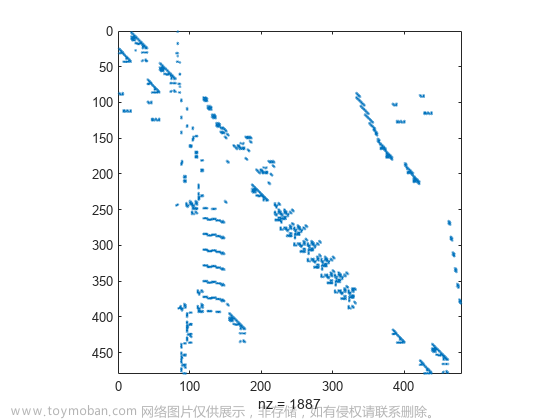
产生随机的初始群体
% Generate a random initial population
   X = sparse(50,50);
   X(21:30,21:30) = (rand(10,10) > .75);
   p0 = nnz(X);


循环100代
% Loop over 100 generations.
   for t = 1:100

      spy(X)
      title(num2str(t))
      drawnow

      % Whether cells stay alive, die, or generate new cells depends
      % upon how many of their eight possible neighbors are alive.
      % Index vectors increase or decrease the centered index by one.

      n = size(X,1);
      p = [1 1:n-1];
      q = [2:n n];

      % Count how many of the eight neighbors are alive.

      Y = X(:,p) + X(:,q) + X(p,:) + X(q,:) + ...
          X(p,p) + X(q,q) + X(p,q) + X(q,p);

      % A live cell with two live neighbors, or any cell with
      % three live neigbhors, is alive at the next step.

      X = (X & (Y == 2)) | (Y == 3);

   end

   p100 = nnz(X);
   fprintf('%5d %5d %8.3f\n',p0,p100,p100/p0)
循环
function lifex(varargin)

lex = open_lex('lexicon.txt');
pop = population(lex,varargin{:});

repeat = true;
while repeat

   % Place the initial population in the universe, X.

   [lex,pop] = read_lexicon(lex,pop);
   X = populate(pop);

   [plothandle,buttons] = initial_plot(size(X),pop);
   title(pop.name)

   t = 0;
   loop = true;
   while loop

      % Expand the universe if necessary to avoid the boundary.

      X = expand(X,pop);

      % Update the plot.

      [i,j] = find(X);
      set(plothandle,'xdata',j,'ydata',i);
      caption(t,nnz(X))
      drawnow

      % Whether cells stay alive, die, or generate new cells depends
      % upon how many of their eight possible neighbors are alive.
      % Index vectors increase or decrease the centered index by one.

      n = size(X,1);
      p = [1 1:n-1];
      q = [2:n n];

      % Count how many of the eight neighbors are alive.

      Y = X(:,p) + X(:,q) + X(p,:) + X(q,:) + ...
          X(p,p) + X(q,q) + X(p,q) + X(q,p);

      % A live cell with two live neighbors, or any cell with
      % three live neigbhors, is alive at the next step.

      X = (X & (Y == 2)) | (Y == 3);

      [loop,buttons] = query_buttons(buttons,pop);
      t = t + 1;

   end

   [repeat,pop] = what_next(buttons,lex,pop);

end
fclose(lex.fid);
set(buttons(1:6),'vis','off')
set(buttons(7),'value',0,'string','close','call','close(gcf)')

% ------------------------

function lex = open_lex(filename)
% lex = file_open(filename)
%    lex.fid = file identifier
%    lex.len = number of entries
%    lex.index = index of current entry

lex.fid = fopen(filename);
if lex.fid < 3
   error(['Cannot open "' filename '"'])
end
% Count number of usable entries,
lex.index = 0;
lex.len = 0;
while ~feof(lex.fid)
   % Look for a line with two colons, ':name:'.
   line = fgetl(lex.fid);
   if sum(line == ':') >= 2
      % name = line(2:find(line(2:end) == ':',1));
      % Look for an empty line or a line starting with a tab.
      tab = char(9);
      task = [tab '*'];
      tdot = [tab '.'];
      while ~feof(lex.fid)
         line = fgetl(lex.fid);
         if isempty(line)
            break
         elseif strncmp(line(1:2),task,2) || strncmp(line(1:2),tdot,2)
            lex.len = lex.len + 1;
            % fprintf('%d: %s\n',lex.len,name)
            break
         end
      end
   end
end
frewind(lex.fid);

% ------------------------

function pop = population(varargin)
% pop = population(varargin)
%    pop.index = index within lexicon of population
%    pop.name = name of population
%    pop.all = logical flag for slide show of populations
%    pop.b = border width, default = 20
%    pop.S = sparse matrix representation of population

lex = varargin{1};
pop.index = 0;
pop.name = ' ';
pop.all = false;
pop.b = 20;
pop.S = [];
if nargin < 2
   pop.index = ceil(rand*lex.len);
elseif ischar(varargin{2}) && isequal(varargin{2},'all')
   pop.all = true;
   pop.b = 10;
elseif ischar(varargin{2})
   pop.name = varargin{2};
   pop.index = -1;
elseif min(size(varargin{2})) > 1
   pop.S = sparse(varargin{2});
   pop.name = sprintf('my %d-by-%d matrix',size(pop.S));
else
   pop.index = varargin{2};
end
if nargin == 3
   pop.b = varargin{3};
end

% ------------------------

function [lex,pop] = read_lexicon(lex,pop)
% [lex,pop] = read_lexicon(lex,pop)
%    Update lex and pop to new population

if pop.all || pop.index > lex.len
   pop.index = mod(pop.index,lex.len)+1;
end
if pop.index < lex.index
   frewind(lex.fid)
   lex.index = 0;
end
while lex.index ~= pop.index
   % Look for a line with two colons, ':name:'.
   line = fgetl(lex.fid);
   if sum(line == ':') >= 2
      name = line(2:find(line(2:end) == ':',1));
      % Look for an empty line or a line starting with a tab.
      tab = char(9);
      task = [tab '*'];
      tdot = [tab '.'];
      while ~feof(lex.fid) && lex.index <= lex.len
         line = fgetl(lex.fid);
         if isempty(line)
            break
         elseif strncmp(line(1:2),task,2) || strncmp(line(1:2),tdot,2)
            lex.index = lex.index + 1;
            if lex.index == pop.index || ...
                  strncmpi(name,pop.name,length(pop.name))
               pop.index = lex.index;
               if pop.all
                  pop.name = [name ',  index = ' int2str(pop.index)];
               else
                  pop.name = name;
               end
               % Form sparse matrix by rows from '.' and '*'.
               S = sparse(0,0);
               m = 0;
               while ~isempty(line) && (line(1)==tab)
                  row = sparse(line(2:end) == '*');
                  m = m+1;
                  n = length(row);
                  S(m,n) = 0;
                  S(m,1:n) = row;
                  line = fgetl(lex.fid);
               end
               pop.S = S;
            elseif lex.index == lex.len
               error('Population name is not in lexicon.')
            end
            break
         end
      end
   end
end

% ------------------------

function [plothandle,buttons] = initial_plot(sizex,pop)
% [plothandle,buttons] = initial_plot(size(X),pop)
%    plothandle = handle to customized "spy" plot
%    buttons = array of handles to toggle buttons

clf
shg
m = max(sizex);
ms = max(10-ceil(m/10),2);
plothandle = plot(0,0,'o','markersize',ms,'markerfacecolor','blue');
set(gca,'xlim',[0.5 m+0.5],'ylim',[0.5 m+0.5],'ydir','rev', ...
   'xtick',[],'ytick',[],'plotboxaspectratio',[m+2 m+2 1])
buttons = zeros(7,1);
bstrings = {'step','slow','fast','redo','next','random','quit'};
for k = 1:7
   buttons(k) = uicontrol('style','toggle','units','normal', ...
   'position',[.10+.12*(k-1) .005 .10 .045],'string',bstrings{k});
end
set(buttons(1),'userdata',0);
if pop.all, set(buttons(1:6),'vis','off'), end

% ------------------------

function X = populate(pop)
% X = populate(pop);
%    X = sparse matrix universe with centered initial population

[p,q] = size(pop.S);
n = max(p,q) + 2*pop.b;
X = sparse(n,n);
i = floor((n-p)/2)+(1:p);
j = floor((n-q)/2)+(1:q);
X(i,j) = pop.S;

% ------------------------

function X = expand(X,pop)
% X = expand(X);
% Expand size if necessary to keep zeros around the boundary.
% Border width b avoids doing this every time step.
n = size(X,1);
b = max(pop.b,1);
if any(X(:,n-1) ~= 0) || any(X(n-1,:) ~= 0)
   X = [X sparse(n,b); sparse(b,n+b)];
   n = n + b;
end
if any(X(2,:) ~= 0) || any(X(:,2) ~= 0)
   X = [sparse(b,n+b); sparse(n,b) X];
   xlim = get(gca,'xlim')+b;
   ylim = get(gca,'ylim')+b;
   set(gca,'xlim',xlim,'ylim',ylim)
end

% ------------------------

function [loop,buttons] = query_buttons(buttons,pop)
% [loop,buttons] = query_buttons(buttons);
%    loop = true: continue time stepping
%    loop = false: restart

if pop.all
   pause(1)
   loop = false;
else
   bv = cell2mat(get(buttons,'value'));
   bk = get(buttons(1),'userdata');
   if bk == 0 || sum(bv==1) ~= 1
      while all(bv == 0)
         drawnow
         bv = cell2mat(get(buttons,'value'));
      end
      if sum(bv==1) > 1
         bv(bk) = 0;
      end
      bk = find(bv == 1);
   end
   set(buttons([1:bk-1 bk+1:7]),'value',0)
   switch bk
      case 1  % step
         set(buttons(1),'value',0);
         bk = 0;
         loop = true;
      case 2  % slow
         pause(.5)
         loop = true;
      case 3  % fast
         pause(.05)
         loop = true;
      otherwise, loop = false;
   end
   % Remember button number
   set(buttons(1),'userdata',bk);
end

% ------------------------

function [repeat,pop] = what_next(buttons,lex,pop)
% [next,pop] = what_next(buttons,lex,pop);
%    repeat = true: start with a new population
%    repeat = false: exit

bv = cell2mat(get(buttons,'value'));
bk = find(bv == 1);
set(buttons,'value',0)
repeat = true;
if ~isempty(bk)
   switch bk
      case 4  % redo
         pop.index = lex.index;
      case 5  % next
         pop.index = mod(lex.index,lex.len)+1;
      case 6  % random
         pop.index = ceil(rand*lex.len);
      case 7  % quit
         repeat = false;
   end
end

% ------------------------

function caption(t,nnz)
% caption(t,nnz(X))
% Print time step count and population size on the x-label.
s = sprintf('t=%3d, pop=%3d',t,nnz);
fs = get(0,'defaulttextfontsize')+2;
xlabel(s,'fontname','courier','fontsize',fs);


曼德勃罗集
曼德勃罗集是一个包含z0值的复平面区域,其轨迹定义为
文章来源:https://www.toymoban.com/news/detail-620035.html
z0=0.25-0.54i
z=0
z=z^2+z0
数组运算
%% Define the region.定义复平面域的分割方式
   x = 0: 0.05: 0.8;
   y = x';

%% Create the two-dimensional complex grid using Tony's indexing trick.
   n = length(x);
   e = ones(n,1);
   z0 = x(e,:) + i*y(:,e);

%% Or, do the same thing with meshgrid.
   [X,Y] = meshgrid(x,y);
   z0 = X + i*Y;

%% Initialize the iterates and counts arrays.
   z = zeros(n,n);
   c = zeros(n,n);

%% Here is the Mandelbrot iteration.
   depth = 32;
   for k = 1:depth  %循环次数
      z = z.^3 + z0;
      c(abs(z) < 2) = k;
   end

%% Create an image from the counts.
   c  %直接显示矩阵c
   image(c)
   axis image

%% Colors
   colormap(flipud(jet(depth)))
 文章来源地址https://www.toymoban.com/news/detail-620035.html
到了这里,关于MATLAB编程实践12、13的文章就介绍完了。如果您还想了解更多内容,请在右上角搜索TOY模板网以前的文章或继续浏览下面的相关文章,希望大家以后多多支持TOY模板网!