下载
虚拟机下载
https://customerconnect.vmware.com/en/downloads/info/slug/desktop_end_user_computing/vmware_workstation_player/17_0
cenos 镜像下载
https://www.centos.org/download/
grafana 服务下载
https://grafana.com/grafana/download/7.4.0?platform=linux
Prometheus 服务下载
https://prometheus.io/download/
命令
grafana安装
sudo yum install -y https://dl.grafana.com/enterprise/release/grafana-enterprise-7.2.0-1.x86_64.rpm
grafana 启动
sudo systemctl start grafana-server -- 启动服务
sudo systemctl stop grafana-server -- 停止服务
sudo systemctl status grafana-server -- 查看状态

prometheus 安装
wget https://github.com/prometheus/prometheus/releases/download/v2.30.3/prometheus-2.30.3.linux-amd64.tar.gz

 tar -xzf prometheus-2.30.3.linux-amd64.tar.gz
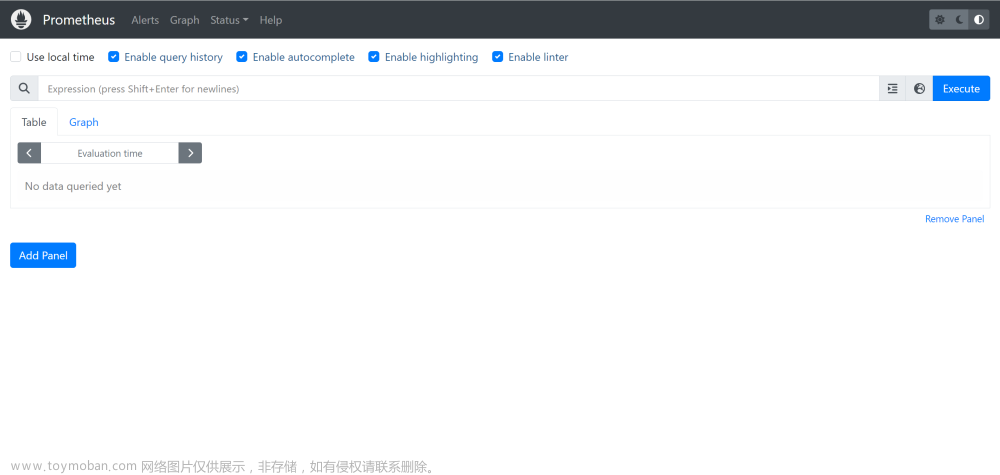
prometheus 启动
找到解压目录
执行 ./prometheus
结果如图
虚拟机浏览器访问


搭建遇到问题
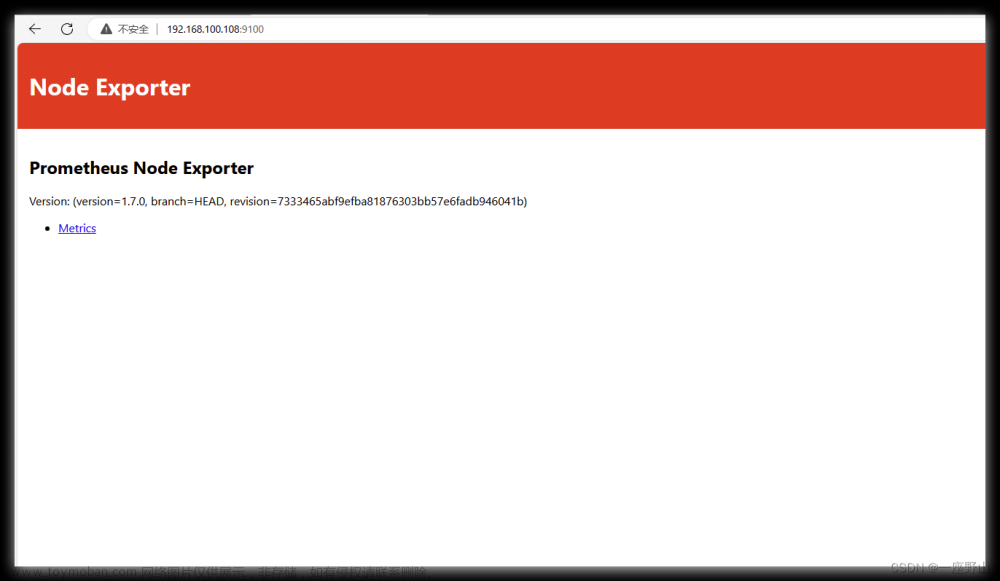
主机浏览器访问
这个一般通过 虚拟机ip 替换localhost 即可 加入你不可以 有几种情况
- 一是你虚拟机不是桥接模式
- 二可能你防火墙设置了
针对第二种你可以 通过命令关掉防火墙 (开发环境可以这样)文章来源:https://www.toymoban.com/news/detail-631880.html
systemctl stop firewalld
grafana web 访问失败

出现如图所示的问题加入你符合他说的那几个情况 可以修改配置去调整,假如就是第一次按照没有代理没有docker ,直接安装的 在linux centos 环境中 那个就是版本问题。你需要按照低版本 目前我用7开头的版本实验是可以的。8以上目前存在类似问题。文章来源地址https://www.toymoban.com/news/detail-631880.html
到了这里,关于Centos 从0搭建grafana和Prometheus 服务以及问题解决的文章就介绍完了。如果您还想了解更多内容,请在右上角搜索TOY模板网以前的文章或继续浏览下面的相关文章,希望大家以后多多支持TOY模板网!