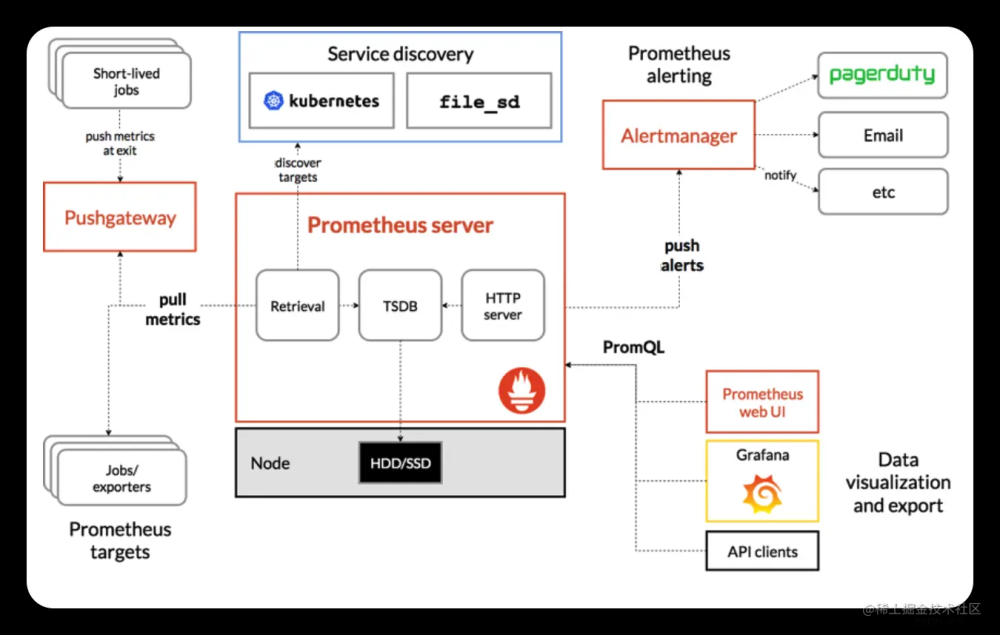
Prometheus Operator实现Ceph集群企业微信告警
实现方案
我们的k8s集群与ceph集群是部署在不同的服务器上,因此实现方案如下:
(1) ceph集群开启mgr内置的exporter服务,用于获取ceph集群的metrics
(2) k8s集群通过 Service + Endponit + ServiceMonitor建立ceph集群metrics与Prometheus之间的联系
- 建立一个 ServiceMonitor 对象,用于 Prometheus 添加监控项;
- 为 ServiceMonitor 对象关联 metrics 数据接口的一个 Service 对象;
- 确保 Service 对象可以正确获取到 Metrics 数据;
(3) 通过grafana监控ceph集群
(4) 配置企业微信告警
ceph集群开启内置exporter
Ceph Luminous 12.2.1的mgr中自带了Prometheus插件,内置了 Prometheus ceph exporter,可以使用Ceph mgr内置的exporter作为Prometheus的target。
在ceph集群机器上启动ceph exporter
ceph mgr module enable prometheus
查看Prometheus的服务端口是否启动, prometues exporter启动的端口是9283
netstat -nltp | grep mgr
通过 ceph -s可以看到ceph mgr进程是在哪台机器上启动的
(base) Ceph3 ➜  ~ ceph -s
  cluster:
    id:     21217f8a-8597-4734-acf6-05e9251ce7be
    health: HEALTH_OK

  services:
    mon: 3 daemons, quorum Ceph1,Ceph3,Ceph2 (age 10d)
    mgr: Ceph3(active, since 2w), standbys: Ceph2, Ceph1
    mds: cephfs:1 {0=Ceph2=up:active} 2 up:standby
    osd: 24 osds: 24 up (since 2w), 24 in (since 10M)
    rgw: 2 daemons active (Ceph1, Ceph2)

  task status:

  data:
    pools:   11 pools, 857 pgs
    objects: 27.06M objects, 71 TiB
    usage:   216 TiB used, 133 TiB / 349 TiB avail
    pgs:     856 active+clean
             1   active+clean+scrubbing+deep

  io:
    client:   1.3 MiB/s rd, 867 KiB/s wr, 7 op/s rd, 23 op/s wr
这里我们可以看到ceph mgr进程在Ceph3上启动, 在浏览器中输入对应的IP跟9283端口即可访问
点击蓝色Metrics后,可以看到所有的搜集的指标信息
k8s集群配置ServiceMonitor
k8s通过 Service + Endpoints 方式, 明确将外部ceph exporter服务映射为内部 Service.
Endpoints
Endpoints是将ceph exporter服务的节点所指向的服务映射到k8s内部服务,yaml配置文件如下
apiVersion: v1
kind: Endpoints
metadata:
  name: ceph-monitor
  namespace: monitoring
  labels:
    app: monitor-ceph
subsets:
- addresses:
  - ip: 10.32.0.15
  ports:
  - name: http
    port: 9283
    protocol: TCP
这里本质上获取服务的IP与Port
Service
Service是k8s内部的服务,可供k8s集群其他服务访问。这里yaml配置文件如下:
apiVersion: v1
kind: Service
metadata:
  name: ceph-monitor
  namespace: monitoring
  labels:
    app: monitor-ceph
spec:
  type: ClusterIP
  clusterIP: None
  ports:
  - name: http
    port: 9283
    protocol: TCP
    targetPort: 9283
这里需要注意:Service与Endpoints的name要保持一样,另外labels的命名要与name区分开,不要设置成一样,否则会导致咱们的服务无法访问。
ServiceMonitor
通过配置ServiceMonitor可以让Prometheus自动识别到ceph target. yaml文件如下:
apiVersion: monitoring.coreos.com/v1
kind: ServiceMonitor
metadata:
  name: ceph-monitor
  namespace: monitoring
  labels:
    release: prometheus
spec:
  endpoints:
    - port: http
      interval: 30s
  selector:
    matchLabels:
      app: monitor-ceph
  namespaceSelector:
    matchNames:
      - monitoring
这里的labels设置要与Prometheus对象中一致,否则可能会导致ceph的服务无法被Prometheus识别。
将上面三个配置写入到ceph-monitor.yaml文件,然后执行下述命令即可。
kubectl apply -f ceph-monitor.yaml

打开Prometheus网站可以发现Targets中已经可以监控到ceph集群了,接下来开始配置具体的监控内容和告警。
grafana配置ceph监控告警
配置监控规则方法
prometheus的监控规则文件在prometheus Pod中的路径:/etc/prometheus/rules/prometheus-prometheus-kube-prometheus-prometheus-rulefiles-0/
而这些文件都是通过一个叫PrometheusRule的k8s资源生成的,PrometheusRule用于配置Promtheus的 Rule 规则文件,包括 recording rules 和 alerting,可以自动被 Prometheus 加载。
至于为什么 Prometheus 能够识别这个 PrometheusRule 资源对象呢?这就需要查看我们创建的 prometheus 这个资源对象了,里面有非常重要的一个属性 ruleSelector,用来匹配 rule 规则的过滤器,我们这里没有过滤,所以可以匹配所有的,假设要求匹配具有 prometheus=k8s 和 role=alert-rules 标签的 PrometheusRule 资源对象,则可以添加下面的配置:
ruleSelector:
  matchLabels:
    prometheus: k8s
    role: alert-rules
为了监控ceph集群,我们需要自定义一些报警规则,其实就是创建一个PrometheusRule的对象即可,然后Prometheus会自动识别。接下来我们重点关注我们需要创建的规则内容。
配置ceph监控规则
首先我们需要整理一下ceph集群一些非常重要的监控内容:
- ceph 几个重要的服务进程:mon, mgr, mds, osd, rgw
- ceph osd 的使用率
- ceph集群的状态
- ceph集群IO效率
PrometheusRule
PrometheusRule defines recording and alerting rules for a Prometheus instance
| Field | Description |
|---|---|
apiVersion string |
monitoring.coreos.com/v1 |
kind string |
PrometheusRule |
metadata Kubernetes meta/v1.ObjectMeta
|
Refer to the Kubernetes API documentation for the fields of the metadata field. |
spec PrometheusRuleSpec
|
Specification of desired alerting rule definitions for Prometheus. |
配置ceph监控规则
目前网上配置ceph的规则文章基本都没有用,大家都不懂什么意思,这里建议大家弄懂规则的制定方法。
这里有一些注意事项需要说一下:
-
PrometheusRule的metadata下的标签一定要配置一个与k8s集群中prometheus: ruleSelector下定义的相同的标签,否则配置的Rule无法被Prometheus识别
-
获取prometheus的yaml文件:kubectl get prometheus -n monitoring -o yaml > prometheus.yaml
-
找到ruleSelector section下的配置信息,例如:
ruleSelector:
    matchLabels:
      release: prometheus
这里我们找到了标签:release,在配置rule时,填入即可。
-
-
配置的规则涉及的指标要从ceph exporter服务中获取。规则的设置方法如下:
- alert: CephCluster
  expr: ceph_health_status > 0  # 规则的计算公式,需要使用相应的metrics,从ceph exporer服务中获取
  for: 3m
  labels:
     severity: critical
     status: 非常严重
   annotations:
     summary: "{{$labels.instance}}: Ceph集群状态异常"
     description: "{{$labels.instance}}:Ceph集群状态异常,当前状态为{{ $value }}"
expr的设计规则
PrometheusRule中的 expr字段用于定义监控规则的表达式。该表达式使用PromQL(Prometheus查询语言)来指定要监控的指标以及触发警报的条件。以下是PromQL的一些常用语法和使用方法的详细介绍:
-
指标选择器:
- 使用
<metric_name>选择特定的指标,例如:cpu_usage - 使用
<metric_name>{<label_name>="<label_value>"}选择带有特定标签值的指标,例如:cpu_usage{instance="server1", job="web"}
- 使用
-
二元操作符:
-
==:等于 -
!=:不等于 -
>:大于 -
>=:大于等于 -
<:小于 -
<=:小于等于
-
-
逻辑操作符:
-
and:逻辑与 -
or:逻辑或 -
unless:逻辑非
-
-
函数:
-
rate(<metric_name>[<time_range>]):计算指标的速率,例如:rate(cpu_usage[5m]) -
sum(<vector>):对指标向量进行求和,例如:sum(cpu_usage) -
avg(<vector>):对指标向量进行平均值计算,例如:avg(cpu_usage)
-
-
时间范围:
-
[<duration>]:指定一个时间范围,例如:[5m]表示过去5分钟的数据
-
ceph的监控规则
apiVersion: monitoring.coreos.com/v1
kind: PrometheusRule
metadata:
  labels:
    prometheus: k8s
    role: alert-rules
    release: prometheus
  name: ceph-rules
  namespace: monitoring
spec:
  groups:
    - name: ceph
      rules:
      - alert: CephCluster
        expr: ceph_health_status > 0
        for: 3m
        labels:
          severity: critical
          status: 非常严重
        annotations:
          summary: "{{$labels.instance}}: Ceph集群状态异常"
          description: "{{$labels.instance}}:Ceph集群状态异常,当前状态为{{ $value }}"

      - alert: CephOSDDown
        expr: count(ceph_osd_up{} == 0.0) > 0
        for: 3m
        labels:
          severity: critical
          status: 非常严重
        annotations:
          summary: "{{$labels.instance}}: 有{{ $value }}个OSD挂掉了"
          description: "{{$labels.instance}}:{{ $labels.osd }}当前状态为{{ $labels.status }}"

      - alert: CephOSDOut
        expr: count(ceph_osd_up{}) - count(ceph_osd_in{}) > 0
        for: 3m
        labels:
          severity: critical
          status: 非常严重
        annotations:
          summary: "{{$labels.instance}}: 有{{ $value }}个OSD Out"
          description: "{{$labels.instance}}:{{ $labels.osd }}当前状态为{{ $labels.status }}"

      - alert: CephOverSpace
        expr: ceph_cluster_total_used_bytes / ceph_cluster_total_bytes * 100 > 80
        for: 3m
        labels:
          severity: critical
          status: 非常严重
        annotations:
          summary: "{{$labels.instance}}:集群空间不足"
          description: "{{$labels.instance}}:当前空间使用率为{{ $value }}"

      - alert: CephMonDown
        expr: count(ceph_mon_quorum_status{}) < 3
        for: 3m
        labels:
          severity: critical
          status: 非常严重
        annotations:
          summary: "{{$labels.instance}}:Mon进程异常"
          description: "{{$labels.instance}}: Mon进程Down"

      - alert: CephMgrDown
        expr: sum(ceph_mgr_status{}) < 1.0
        for: 3m
        labels:
          severity: critical
          status: 非常严重
        annotations:
          summary: "{{$labels.instance}}:Mgr进程异常"
          description: "{{$labels.instance}}: Mgr进程Down"

      - alert: CephMdsDown
        expr: sum(ceph_mds_metadata{}) < 3.0
        for: 3m
        labels:
          severity: warning
          status: 告警
        annotations:
          summary: "{{$labels.instance}}:Mds进程异常"
          description: "{{$labels.instance}}: Mds进程Down"

      - alert: CephRgwDown
        expr: sum(ceph_rgw_metadata{}) < 2.0
        for: 3m
        labels:
          severity: warning
          status: 告警
        annotations:
          summary: "{{$labels.instance}}:Rgw进程异常"
          description: "{{$labels.instance}}: Rgw进程Down"

      - alert: CephOsdOver
        expr: sum(ceph_osd_stat_bytes_used / ceph_osd_stat_bytes > 0.8) by (ceph_daemon) > 0
        for: 3m
        labels:
          severity: warning
          status: 告警
        annotations:
          summary: "{{$labels.instance}}:High OSD Usage Alert"
          description: "{{$labels.instance}}: Some OSDs have usage above 80%"
在k8s集群中配置生效,然后检查是否生效。如果没有生效,回去检查ruleSelector的标签是否配置正确
kubectl apply -f ceph_rules.yaml -n monitoring

说明我们的配置生效了,接下来开始在grafana中配置企业微信告警
Grafana配置企业微信告警
配置企业微信机器人
这里很简单,就不展开了。具体操作流程:找一个自己是群主的群聊,然后点击企业微信右上角的 ...并点击添加机器人,点击 新创建一个机器人,输入机器人名称及配置图片就生成好了。最后会得到一个链接: https://qyapi.weixin.qq.com/cgi-bin/webhook/send?key=xxx。
这里我配置了,但是无法直接在Grafana中配置webhook进行发送告警信息,这里需要使用第三方服务进行信息中转才能将消息发送到企业微信机器人。
部署中转服务
我在github上找到了两个项目:
第一个是 g2ww 我尝试了,并没有发送成功,总是报 40038, url长度错误。这里pass掉
第二个是 cloopy, 这个项目我测试成功。下面是我的处理流程:
step1 首先下载项目
git clone https://github.com/liozzazhang/message-transfer.git
step2 由于我使用的是k8s部署,所以这里要生成镜像部署,下面是生成的Dockerfile
FROM golang:latest AS build

COPY .  /go/src
WORKDIR /go/src

RUN CGO_ENABLED=0 GOOS=linux GOARCH=amd64 go build -o /go/bin/cloopy *.go

FROM alpine

COPY --from=build /go/bin/cloopy /cloopy
ENV TZ=Asia/Shanghai
CMD ["/cloopy"]
根据dockerfile生成镜像
docker build -t cloopy:latest .
step3 测试验证:镜像生成之后可以直接在本机上进行部署测试验证是否可以转发告警信息
docker run --rm -d -p 12345:12345 cloopy:latest
docker启动成功后,可以通过 docker logs -f $container_id 进行查看服务启动日志。
在grafana网页的添加Contact Points页面添加URL, URL格式为:http://10.66.17.96:12345/cloopy/grafana?webhook=https://qyapi.weixin.qq.com/cgi-bin/webhook/send?key=xxx

step4 测试通过后,开始编写k8s部署的yaml文件,如果使用域名的话,还需配置ingress
---
apiVersion: apps/v1
kind: Deployment
metadata:
  name: cloopy
  namespace: monitoring
  labels:
    app: cloopy
spec:
  replicas: 1
  selector:
    matchLabels:
      app: cloopy
  template:
    metadata:
      labels:
        app: cloopy
    spec:
      affinity:
        nodeAffinity:
          requiredDuringSchedulingIgnoredDuringExecution:
            nodeSelectorTerms:
              - matchExpressions:
                  - key: kubernetes.io/hostname
                    operator: In
                    values:
                      - master01
                      - master02
                      - master03
      containers:
      - name: cloopy
        image: cloopy:latest
        # command:
        #   - /bin/bash
        #   - "./bin/monitor.sh"
        ports:
        - containerPort: 12345

---
apiVersion: v1
kind: Service
metadata:
  name: cloopy
  namespace: monitoring
  labels:
    app: cloopy
spec:
  ports:
  - name: http
    port: 12345
    protocol: TCP
    targetPort: 12345
  selector:
    app: cloopy
  type:
    LoadBalancer
---

---
apiVersion: networking.k8s.io/v1
kind: Ingress
metadata:
  name: cloopy
  namespace: monitoring
spec:
  ingressClassName: nginx
  rules:
  - host: webhook.com
    http:
      paths:
      - path: /
        pathType: Prefix
        backend:
          service:
            name: cloopy
            port:
              number: 12345
        path: /
然后在k8s上进行部署即可: kubectl apply -f development.yaml。部署完成后,将grafana里URL测试环境的服务地址换成生产环境的域名或者IP再验证一下就可以了。
http://webhook.com/cloopy/grafana?webhook=https://qyapi.weixin.qq.com/cgi-bin/webhook/send?key=xxx
至此企业微信的Webhook便配置成功了。
配置企业微信
需要创建企业微信应用程序,并得到corp_id, secret_id, app_id。这几个变量要配置好。
然后将这几个变量配置到webcam下对应的变量就可以使用了,这个比较简单,但是其灵活性不如企业微信机器人。
配置告警规则
在配置告警规则时,我遇到了另外一个问题:通过AlertManager配置的rule无法在datasource Prometheus下进行告警,配置Alert时找不到这些告警内容,这里只能重新创建Alert Rule,然后再通过label进行绑定。
所以我将ceph下的规则又重新配置了一遍,我目前还没有找到好的方法进行yaml文件配置,等以后发现了再补充,目前是手动添加告警规则。
参考
如何用 Prometheus Operator 监控 K8s 集群外服务? - 掘金 (juejin.cn)
使用Operator管理Prometheus · Prometheus中文技术文档
Getting Started - Prometheus Operator (prometheus-operator.dev)
K8S集群部署kube-Prometheus监控Ceph(版本octopus)集群、并实现告警。_promethus基于ceph相关的告警规则_石头-豆豆的博客-CSDN博客
Prometheus Operator 配置PrometheusRule告警规则_prometheus runbook_url_富士康质检员张全蛋的博客-CSDN博客文章来源:https://www.toymoban.com/news/detail-634103.html
prometheus-operator/Documentation/api.md at main · prometheus-operator/prometheus-operator · GitHub文章来源地址https://www.toymoban.com/news/detail-634103.html
到了这里,关于第八篇: K8S Prometheus Operator实现Ceph集群企业微信机器人告警的文章就介绍完了。如果您还想了解更多内容,请在右上角搜索TOY模板网以前的文章或继续浏览下面的相关文章,希望大家以后多多支持TOY模板网!