一、监控k8s集群
要监控k8s集群需要使用到以下服务用于收集监控的资源信息,node_exporter用于监控k8s集群节点的资源信息,kube-state-metrics用于监控k8s集群的deployment、statefulset、daemonset、pod等的状态,cadvisor用于监控k8s集群的pod资源信息
在k8s集群中创建monitoring的命名空间用于部署监控的容器
kubectl create namespace monitoring
在k8s集群中部署node_exporter容器服务
vi node-exporter.yaml
apiVersion: apps/v1
kind: DaemonSet      #使用daemonset控制器,使得集群中的每个节点都能部署一个pod
metadata:
  name: node-exporter
  namespace: monitoring
  labels:
    k8s-app: node-exporter
spec:
  selector:
    matchLabels:
        k8s-app: node-exporter
  template:
    metadata:
      labels:
        k8s-app: node-exporter
    spec:
      tolerations:          #配置容忍策略,使得pod能部署在master节点上
        - effect: NoSchedule
          key: node-role.kubernetes.io/control-plane
      containers:
      - image: prom/node-exporter      #配置node-exporter的镜像
        imagePullPolicy: IfNotPresent
        name: prometheus-node-exporter
        ports:
        - containerPort: 9100     #配置容器端口
          hostPort: 9100         #配置绑定k8s主机节点的端口,用于提供对外访问的接口
          protocol: TCP
          name: metrics
      hostNetwork: true          #使用hostNetwork: true是必要的,这样才能将Pod的网络栈绑定到宿主机上,以实现hostPort的功能
执行yaml生成node-exporter容器
kubectl apply -y node-exporter.yaml
查看容器
kubectl get pod -n monitoring -l k8s-app=node-exporter -o wide

可以看到集群的每个节点都有一个node_exporter的pod服务
查看收集的数据
http://10.1.60.119:9100/metrics

在k8s集群中部署kube-state-metrics容器服务
部署kube-state-metrics服务需要去github上的项目拉取yaml
下载地址:https://github.com/kubernetes/kube-state-metrics/tree/v2.9.2
需要根据自己的k8s集群版本下载合适的kube-state-metrics版本,我的k8s版本是1.26.0所以我是下载了2.9.2版本的kube-state-metrics

mkdir /opt/kube-state-metrics && cd /opt/kube-state-metrics
将下载的安装包放到该目录下解压
tar -zxvf kube-state-metrics-2.9.2.tar.gz
将需要用到的yaml文件拷贝出来
mv kube-state-metrics-2.9.2/examples/standard/* /opt/kube-state-metrics
ls

更改一下yaml文件
vi deployment.yaml
apiVersion: apps/v1
kind: Deployment    #使用deployment控制器,将pod部署在工作节点即可
metadata:
  labels:
    app.kubernetes.io/component: exporter
    app.kubernetes.io/name: kube-state-metrics
    app.kubernetes.io/version: 2.9.2
  name: kube-state-metrics
  namespace: kube-system
spec:
  replicas: 1
  selector:
    matchLabels:
      app.kubernetes.io/name: kube-state-metrics
  template:
    metadata:
      labels:
        app.kubernetes.io/component: exporter
        app.kubernetes.io/name: kube-state-metrics
        app.kubernetes.io/version: 2.9.2
    spec:
      automountServiceAccountToken: true
      containers:
      - image: bitnami/kube-state-metrics:2.9.2   #更改镜像地址,原本的镜像在国外拉不下来
        livenessProbe:
          httpGet:
            path: /healthz
            port: 8080
          initialDelaySeconds: 5
          timeoutSeconds: 5
        name: kube-state-metrics
        ports:
        - containerPort: 8080
          name: http-metrics
        - containerPort: 8081
          name: telemetry
        readinessProbe:
          httpGet:
            path: /
            port: 8081
          initialDelaySeconds: 5
          timeoutSeconds: 5
        securityContext:
          allowPrivilegeEscalation: false
          capabilities:
            drop:
            - ALL
          readOnlyRootFilesystem: true
          runAsNonRoot: true
          runAsUser: 65534
          seccompProfile:
            type: RuntimeDefault
      nodeSelector:
        kubernetes.io/os: linux
      serviceAccountName: kube-state-metrics
关于镜像的问题可以使用docker命令查一下镜像
docker search kube-state-metrics

vi service.yaml
apiVersion: v1
kind: Service
metadata:
  labels:
    app.kubernetes.io/component: exporter
    app.kubernetes.io/name: kube-state-metrics
    app.kubernetes.io/version: 2.9.2
  name: kube-state-metrics
  namespace: kube-system
spec:
  type: NodePort
  clusterIP:
  ports:
  - name: http-metrics
    port: 8080
    nodePort: 30080            #原本的端口值比较大,超过了nodeport的端口范围
    targetPort: http-metrics
    protocol: TCP
  - name: telemetry
    port: 8081
    nodePort: 30081            #原本的端口值比较大,超过了nodeport的端口范围
    targetPort: telemetry
    protocol: TCP
  selector:
    app.kubernetes.io/name: kube-state-metrics
其它的yaml保持默认即可
执行yaml创建kube-state-metrics服务
kubectl apply -f /opt/kube-state-metrics/
查看pod、svc服务
kubectl get pod,svc -n kube-system

查看收集的数据
http://10.1.60.119:30080/metrics

在k8s集群中部署cadvisor容器服务
vi cadvisor.yaml
apiVersion: apps/v1
kind: DaemonSet
metadata:
  name: cadvisor
  namespace: monitoring
spec:
  selector:
    matchLabels:
      k8s-app: cadvisor
  template:
    metadata:
      labels:
        k8s-app: cadvisor
    spec:
      tolerations:
        - effect: NoSchedule
          key: node-role.kubernetes.io/control-plane
      hostNetwork: true
      restartPolicy: Always
      containers:
      - name: cadvisor
        image: google/cadvisor
        imagePullPolicy: IfNotPresent
        ports:
        - containerPort: 8080
          hostPort: 8080
          protocol: TCP
          name: metrics
执行yaml生成cadvisor容器
kubectl apply -y cadvisor.yaml
查看容器
kubectl get pod -n monitoring -l k8s-app=cadvisor -o wide

可以看到集群的每个节点都有一个cadvisor的pod服务
查看收集的数据
http://10.1.60.119:8080/metrics

二、Prometheus获取监控服务的数据并使用grafana展示
部署prometheus
参考:prometheus部署_Apex Predator的博客-CSDN博客
部署grafana
参考: grafana部署_Apex Predator的博客-CSDN博客
配置prometheus
编辑Prometheus配置文件
vi /opt/prometheus/prometheus/prometheus.yml
global:
  scrape_interval: 15s
  evaluation_interval: 15s
#alerting:    #关于告警组件的配置先忽略
 # alertmanagers:
 #   - static_configs:
  #      - targets:
  #          - 10.1.60.118:9093
#rule_files:     #关于告警规则的配置先忽略
#  - "/opt/prometheus/prometheus/rule/*.yml"
scrape_configs:
  - job_name: "prometheus"
    static_configs:
      - targets: ["localhost:9090"]
  - job_name: "k8s_node_exporter"  #配置k8s集群node_exporter监控数据服务的接口
    static_configs:
      - targets: ["10.1.60.119:9100","10.1.60.120:9100","10.1.60.121:9100","10.1.60.122:9100","10.1.60.123:9100"]
  - job_name: "k8s_pod_cadvisor"   #配置k8s集群cadvisor监控数据服务的接口
    static_configs:
      - targets: ["10.1.60.119:8080","10.1.60.120:8080","10.1.60.121:8080","10.1.60.122:8080","10.1.60.123:8080"]
  - job_name: "kube-state-metrics"   #配置k8s集群kube-state-metrics监控数据服务的接口
    static_configs:
      - targets: ["10.1.60.119:30081"]
  - job_name: "kube-state-telemetry"
    static_configs:
      - targets: ["10.1.60.119:30080"]
重启prometheus服务
systemctl restart prometheus
查看prometheus监控接口的情况
http://10.1.60.118:9090

配置grafana
配置prometheus为数据源


配置数据展示的dashboard
在以下网页中找到需要的模板
地址:Dashboards | Grafana Labs
node_exporter服务的模板我们就使用id为1860的模板

kube-state-metrics服务的模板我们就使用id为13332的模板

cadvisor服务的模板我们就使用id为1860的模板
配置grafana应用模板


其余两个也是一样找到模板id后进行配置即可,这里就不再展示了
三、Prometheus配置告警规则和告警服务实现钉钉告警
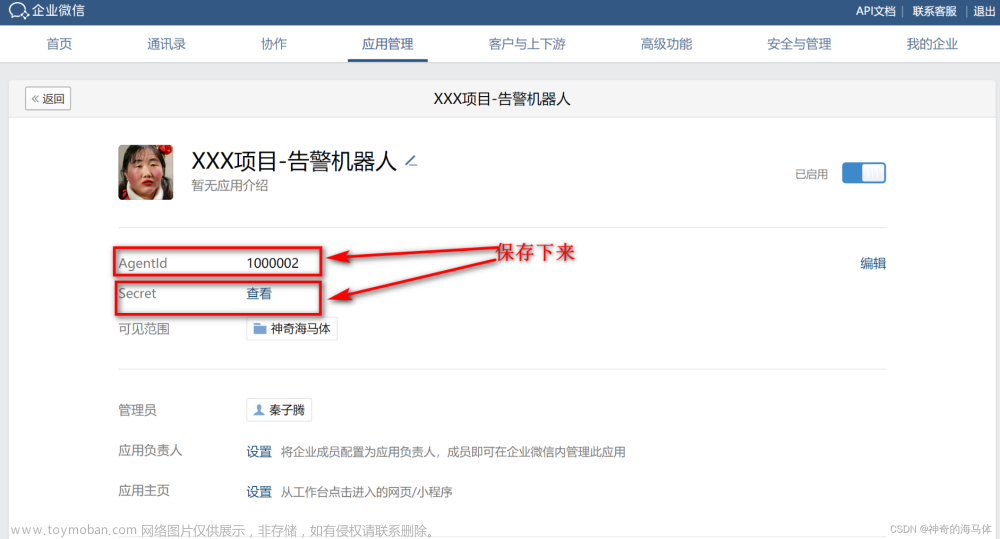
要实现钉钉告警需要部署alertmanager和prometheus-webhook-dingtalk服务
部署参考:prometheus告警发送组件部署_Apex Predator的博客-CSDN博客
配置prometheus告警规则
关于prometheus的告警规则可以在以下网站中找,里面有很多的告警规则
参考:Awesome Prometheus alerts | Collection of alerting rules
我这里就配置k8s集群主机节点的告警规则和pod的一些告警规则
mkdir /opt/prometheus/prometheus/rule && cd /opt/prometheus/prometheus/rule
vi node_exporter.yml
groups:
- name: 服务器资源监控
  rules:
  - alert: 内存使用率过高
    expr: 100 - (node_memory_MemAvailable_bytes / node_memory_MemTotal_bytes) * 100 > 80
    for: 3m
    labels:
      severity: 严重告警
    annotations:
      summary: "{{ $labels.instance }} 内存使用率过高, 请尽快处理!"
      description: "{{ $labels.instance }}内存使用率超过80%,当前使用率{{ $value }}%."
  - alert: 服务器宕机
    expr: up == 0
    for: 1s
    labels:
      severity: 严重告警
    annotations:
      summary: "{{$labels.instance}} 服务器宕机, 请尽快处理!"
      description: "{{$labels.instance}} 服务器延时超过3分钟,当前状态{{ $value }}. "
  - alert: CPU高负荷
    expr: 100 - (avg by (instance,job)(irate(node_cpu_seconds_total{mode="idle"}[5m])) * 100) > 90
    for: 5m
    labels:
      severity: 严重告警
    annotations:
      summary: "{{$labels.instance}} CPU使用率过高,请尽快处理!"
      description: "{{$labels.instance}} CPU使用大于90%,当前使用率{{ $value }}%. "

  - alert: 磁盘IO性能
    expr: avg(irate(node_disk_io_time_seconds_total[1m])) by(instance,job)* 100 > 90
    for: 5m
    labels:
      severity: 严重告警
    annotations:
      summary: "{{$labels.instance}} 流入磁盘IO使用率过高,请尽快处理!"
      description: "{{$labels.instance}} 流入磁盘IO大于90%,当前使用率{{ $value }}%."


  - alert: 网络流入
    expr: ((sum(rate (node_network_receive_bytes_total{device!~'tap.*|veth.*|br.*|docker.*|virbr*|lo*'}[5m])) by (instance,job)) / 100) > 102400
    for: 5m
    labels:
      severity: 严重告警
    annotations:
      summary: "{{$labels.instance}} 流入网络带宽过高,请尽快处理!"
      description: "{{$labels.instance}} 流入网络带宽持续5分钟高于100M. RX带宽使用量{{$value}}."

  - alert: 网络流出
    expr: ((sum(rate (node_network_transmit_bytes_total{device!~'tap.*|veth.*|br.*|docker.*|virbr*|lo*'}[5m])) by (instance,job)) / 100) > 102400
    for: 5m
    labels:
      severity: 严重告警
    annotations:
      summary: "{{$labels.instance}} 流出网络带宽过高,请尽快处理!"
      description: "{{$labels.instance}} 流出网络带宽持续5分钟高于100M. RX带宽使用量{$value}}."

  - alert: TCP连接数
    expr: node_netstat_Tcp_CurrEstab > 10000
    for: 2m
    labels:
      severity: 严重告警
    annotations:
      summary: " TCP_ESTABLISHED过高!"
      description: "{{$labels.instance}} TCP_ESTABLISHED大于100%,当前使用率{{ $value }}%."

  - alert: 磁盘容量
    expr: 100-(node_filesystem_free_bytes{fstype=~"ext4|xfs"}/node_filesystem_size_bytes {fstype=~"ext4|xfs"}*100) > 90
    for: 1m
    labels:
      severity: 严重告警
    annotations:
      summary: "{{$labels.mountpoint}} 磁盘分区使用率过高,请尽快处理!"
      description: "{{$labels.instance}} 磁盘分区使用大于90%,当前使用率{{ $value }}%."
vi kube-state-metrics.yml
groups: #用于定义一个或多个告警规则分组
- name: k8s容器服务监控 #告警规则分组的名称,用于标识一组相关的告警规则
rules: #规则列表,每个规则定义了一个具体的告警条件和处理方式
- alert: KubernetesNodeNotReady #告警规则的名称,用于标识告警规则
expr: kube_node_status_condition{condition="Ready",status="true"} == 0 #定义告警的条件
for: 10m #告警规则的持续时间配置,规定了节点状态满足告警条件的持续时间达到 10 分钟时触发告警
labels:
severity: 严重告警 #告警规则标签
annotations:
summary: "Kubernetes node not ready (instance {{ $labels.instance }})"
description: "Node {{ $labels.node }} has been unready for a long time\n VALUE = {{ $value }}\n LABELS = {{ $labels }}"
- alert: KubernetesOutOfCapacity
expr: sum by (node) ((kube_pod_status_phase{phase="Running"} == 1) + on(uid) group_left(node) (0 * kube_pod_info{pod_template_hash=""})) / sum by (node) (kube_node_status_allocatable{resource="pods"}) * 100 > 90
for: 2m
labels:
severity: 严重告警
annotations:
summary: "Kubernetes out of capacity (instance {{ $labels.instance }})"
description: "{{ $labels.node }} is out of capacity\n VALUE = {{ $value }}\n LABELS = {{ $labels }}"
- alert: KubernetesContainerOomKiller
expr: (kube_pod_container_status_restarts_total - kube_pod_container_status_restarts_total offset 10m >= 1) and ignoring (reason) min_over_time(kube_pod_container_status_last_terminated_reason{reason="OOMKilled"}[10m]) == 1
for: 0m
labels:
severity: 严重告警
annotations:
summary: "Kubernetes container oom killer (instance {{ $labels.instance }})"
description: "Container {{ $labels.container }} in pod {{ $labels.namespace }}/{{ $labels.pod }} has been OOMKilled {{ $value }} times in the last 10 minutes.\n VALUE = {{ $value }}\n LABELS = {{ $labels }}"
- alert: KubernetesVolumeOutOfDiskSpace
expr: kubelet_volume_stats_available_bytes / kubelet_volume_stats_capacity_bytes * 100 < 10
for: 2m
labels:
severity: 严重告警
annotations:
summary: "Kubernetes Volume out of disk space (instance {{ $labels.instance }})"
description: "Volume is almost full (< 10% left)\n VALUE = {{ $value }}\n LABELS = {{ $labels }}"
- alert: KubernetesPersistentvolumeError
expr: kube_persistentvolume_status_phase{phase=~"Failed|Pending", job="kube-state-metrics"} > 0
for: 0m
labels:
severity: 严重告警
annotations:
summary: "Kubernetes PersistentVolume error (instance {{ $labels.instance }})"
description: "Persistent volume is in bad state\n VALUE = {{ $value }}\n LABELS = {{ $labels }}"
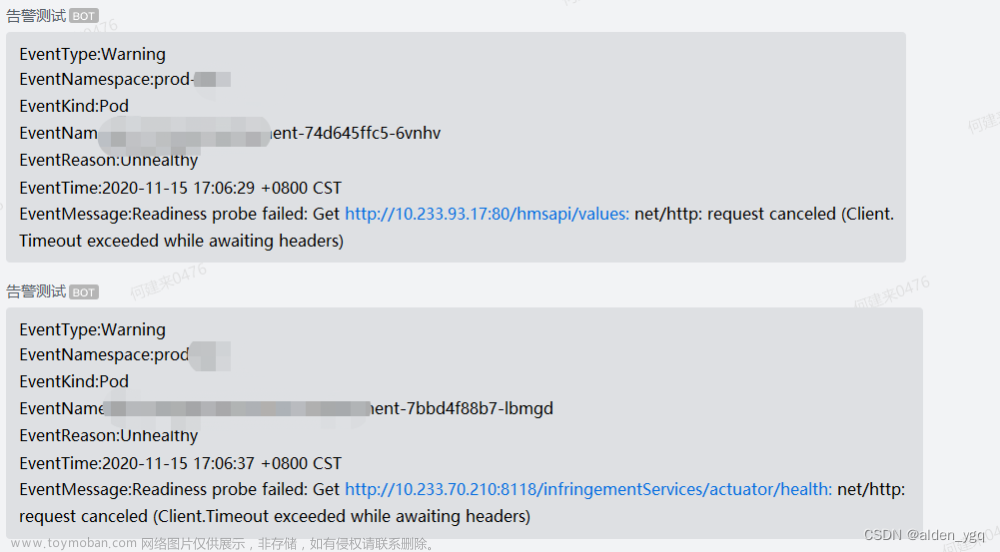
- alert: pod不健康
expr: sum by (namespace, pod) (kube_pod_status_phase{phase=~"Pending|Unknown|Failed"}) > 0
for: 15m
labels:
severity: 严重告警
annotations:
summary: "Kubernetes Pod not healthy (instance {{ $labels.instance }})"
description: "Pod has been in a non-ready state for longer than 15 minutes.\n VALUE = {{ $value }}\n LABELS = {{ $labels }}"
- alert: pod循环重启
expr: increase(kube_pod_container_status_restarts_total[2m]) > 1
for: 0m
labels:
severity: 严重告警
annotations:
summary: "Kubernetes pod crash looping (instance {{ $labels.instance }})"
description: "Pod {{ $labels.pod }} is crash looping\n VALUE = {{ $value }}\n LABELS = {{ $labels }}"
- alert: deployment部署失败未回滚
expr: kube_deployment_status_observed_generation != kube_deployment_metadata_generation
for: 10m
labels:
severity: 严重告警
annotations:
summary: "Kubernetes Deployment generation mismatch (instance {{ $labels.instance }})"
description: "A Deployment has failed but has not been rolled back.\n VALUE = {{ $value }}\n LABELS = {{ $labels }}"
- alert: k8s证书临期警告
expr: apiserver_client_certificate_expiration_seconds_count{job="apiserver"} > 0 and histogram_quantile(0.01, sum by (job, le) (rate(apiserver_client_certificate_expiration_seconds_bucket{job="apiserver"}[5m]))) < 7*24*60*60
for: 0m
labels:
severity: 严重告警
annotations:
summary: "Kubernetes client certificate expires next week (instance {{ $labels.instance }})"
description: "A client certificate used to authenticate to the apiserver is expiring next week.\n VALUE = {{ $value }}\n LABELS = {{ $labels }}"重启Prometheus服务
systemctl restart prometheus
访问prometheus查看规则是否生效
http://10.1.60.118:9090

告警测试,关闭node_exporter服务,看看是否会告警
kubectl delete -f node_exporter.yaml
通过prometheus我们可以看到告警规则首先是变成了pending状态

然后等了一会后转变为firing状态,这是因为配置了for,当触发条件满足一段时间后才会完全转化为触发告警
等待30s后将会收到钉钉告警,这是因为alertmanager配置了group_wait,当一组告警被触发后,在这个时间段内,其他属于同一组的告警也会被等待。这可以用于在一定时间内收集同一组告警,以便一次性发送通知

现在来将服务恢复一下,看多久会告警
kubectl apply -f node_exporter.yaml

可以看到是间隔时间几分钟后才告警恢复, 这是因为alertmanager配置了group_interval,一旦一个告警组的首个告警触发了通知,等待指定的间隔时间后,即使组内有其他告警,也会重新触发通知。这可以避免过于频繁地发送通知文章来源:https://www.toymoban.com/news/detail-642059.html
其他的告警规则服务我就不一个一个测试了,都是没有问题的文章来源地址https://www.toymoban.com/news/detail-642059.html
到了这里,关于prometheus监控k8s服务并告警到钉钉的文章就介绍完了。如果您还想了解更多内容,请在右上角搜索TOY模板网以前的文章或继续浏览下面的相关文章,希望大家以后多多支持TOY模板网!