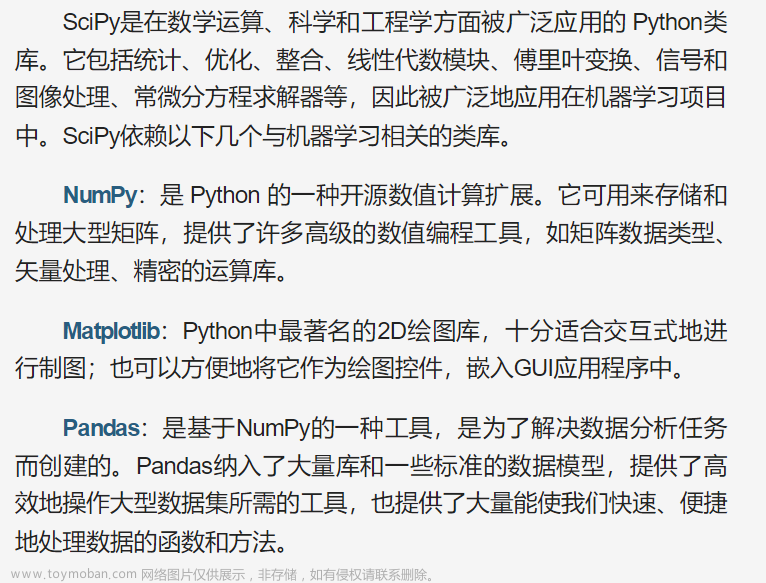
numPy 通常与 SciPy( Scientific Python )和 Matplotlib (绘图库)一起使用,这种组合广泛用于替代 MatLab,是一个强大的科学计算环境,有助于我们通过 Python 学习数据科学或者机器学习。
1. numpy
1.1 numpy简介
numpy /nampai/数值计算库,简单而言,可以被当做向量,线性代数计算。
pip install numpy
官方推荐导入方式:
以np的别名导入numpy,这可能是因为历史遗留问题,有些第三方库是以np的别名导入的numpy库。
import numpy as np
使用实例:
In [11]: import numpy as np

In [12]: np.pi
Out[12]: 3.141592653589793
1.2 矩阵类型的nparray
In [14]: x = np.linspace(-2*np.pi,2*np.pi,100) #在-2pi到2pi这个范围得到100个点,得到一个向量
In [15]: type(x)
Out[15]: numpy.ndarray
In [16]: x
Out[16]:
array([-6.28318531, -6.15625227, -6.02931923, -5.9023862 , -5.77545316,
       -5.64852012, -5.52158709, -5.39465405, -5.26772102, -5.14078798,
       -5.01385494, -4.88692191, -4.75998887, -4.63305583, -4.5061228 ,
       -4.37918976, -4.25225672, -4.12532369, -3.99839065, -3.87145761,
       -3.74452458, -3.61759154, -3.4906585 , -3.36372547, -3.23679243,
       -3.10985939, -2.98292636, -2.85599332, -2.72906028, -2.60212725,
       -2.47519421, -2.34826118, -2.22132814, -2.0943951 , -1.96746207,
       -1.84052903, -1.71359599, -1.58666296, -1.45972992, -1.33279688,
       -1.20586385, -1.07893081, -0.95199777, -0.82506474, -0.6981317 ,
       -0.57119866, -0.44426563, -0.31733259, -0.19039955, -0.06346652,
        0.06346652,  0.19039955,  0.31733259,  0.44426563,  0.57119866,
        0.6981317 ,  0.82506474,  0.95199777,  1.07893081,  1.20586385,
        1.33279688,  1.45972992,  1.58666296,  1.71359599,  1.84052903,
        1.96746207,  2.0943951 ,  2.22132814,  2.34826118,  2.47519421,
        2.60212725,  2.72906028,  2.85599332,  2.98292636,  3.10985939,
        3.23679243,  3.36372547,  3.4906585 ,  3.61759154,  3.74452458,
        3.87145761,  3.99839065,  4.12532369,  4.25225672,  4.37918976,
        4.5061228 ,  4.63305583,  4.75998887,  4.88692191,  5.01385494,
        5.14078798,  5.26772102,  5.39465405,  5.52158709,  5.64852012,
        5.77545316,  5.9023862 ,  6.02931923,  6.15625227,  6.28318531])

In [17]: y = np.cos(x) #每个点进行计算

In [18]: y
Out[18]:
array([ 1.        ,  0.99195481,  0.9679487 ,  0.92836793,  0.87384938,
        0.80527026,  0.72373404,  0.63055267,  0.52722547,  0.41541501,
        0.29692038,  0.17364818,  0.04758192, -0.07924996, -0.20480667,
       -0.32706796, -0.44406661, -0.55392006, -0.65486073, -0.74526445,
       -0.82367658, -0.88883545, -0.93969262, -0.97542979, -0.99547192,
       -0.99949654, -0.98743889, -0.95949297, -0.91610846, -0.85798341,
       -0.78605309, -0.70147489, -0.60560969, -0.5       , -0.38634513,
       -0.26647381, -0.14231484, -0.01586596,  0.1108382 ,  0.23575894,
        0.35688622,  0.47227107,  0.58005691,  0.67850941,  0.76604444,
        0.84125353,  0.90292654,  0.95007112,  0.9819287 ,  0.99798668,
        0.99798668,  0.9819287 ,  0.95007112,  0.90292654,  0.84125353,
        0.76604444,  0.67850941,  0.58005691,  0.47227107,  0.35688622,
        0.23575894,  0.1108382 , -0.01586596, -0.14231484, -0.26647381,
       -0.38634513, -0.5       , -0.60560969, -0.70147489, -0.78605309,
       -0.85798341, -0.91610846, -0.95949297, -0.98743889, -0.99949654,
       -0.99547192, -0.97542979, -0.93969262, -0.88883545, -0.82367658,
       -0.74526445, -0.65486073, -0.55392006, -0.44406661, -0.32706796,
       -0.20480667, -0.07924996,  0.04758192,  0.17364818,  0.29692038,
        0.41541501,  0.52722547,  0.63055267,  0.72373404,  0.80527026,
        0.87384938,  0.92836793,  0.9679487 ,  0.99195481,  1.        ])
numPy 通常与 SciPy( Scientific Python )和 Matplotlib (绘图库)一起使用,这种组合广泛用于替代 MatLab,是一个强大的科学计算环境,有助于我们通过 Python 学习数据科学或者机器学习。
2. Matplotlib
2.1 Matplotlib简介
安装:
In [19]: pip install matplotlib
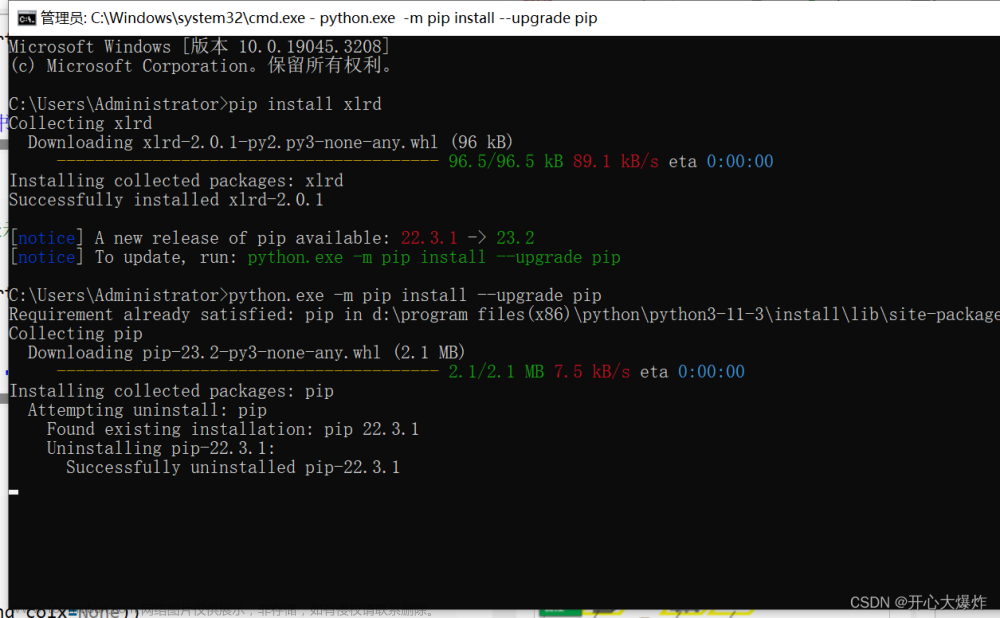
如果安装失败,可以尝试升级pip,命令如下:
python -m pip install -U pip
官网 : https://matplotlib.org/

官方推荐导入方式:
import matplotlib.pyplot as plt
2.2 Matplotlib使用实例
实例1:绘制cos图
In [21]: plt.plot(x,y)
In [21]: plt.plot(x,y)
Installed tk event loop hook.
Out[21]: [<matplotlib.lines.Line2D at 0x2b20f74b760>]
In [23]: plt.show()
运行结果: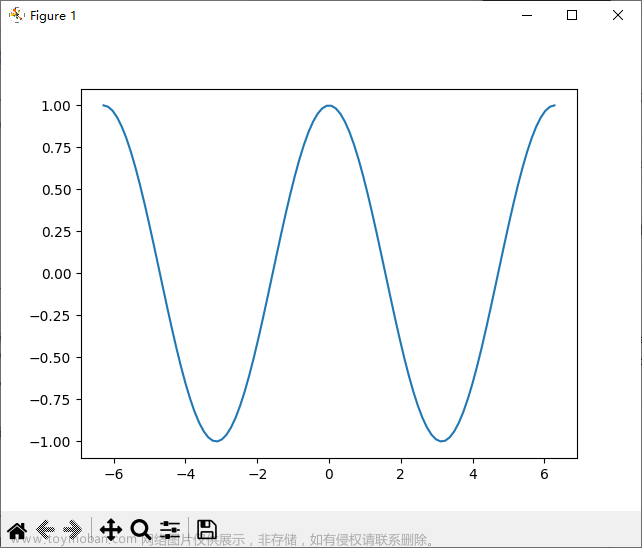
实例2:以脚本形式,绘制复杂的图
import numpy as np
import matplotlib.pyplot as plt

if __name__ == "__main__":
    x = np.linspace(-2*np.pi,2*np.pi,100)
    y = np.cos(x) + np.cos(2*x) + np.cos(3*x)

    plt.plot(x,y)
    plt.show()
运行结果如下: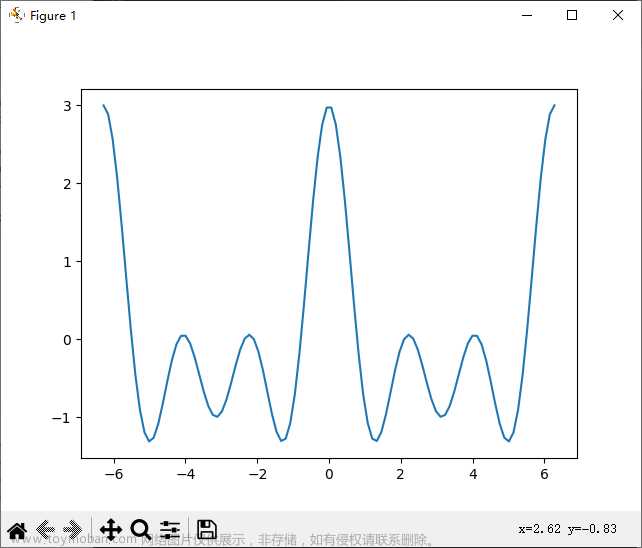 文章来源:https://www.toymoban.com/news/detail-648032.html
3. 学习视频地址:MATLAB的替代组合NumPy+SciPy+Matplotlib文章来源地址https://www.toymoban.com/news/detail-648032.html
到了这里,关于掌握Python的X篇_33_MATLAB的替代组合NumPy+SciPy+Matplotlib的文章就介绍完了。如果您还想了解更多内容,请在右上角搜索TOY模板网以前的文章或继续浏览下面的相关文章,希望大家以后多多支持TOY模板网!


