Prometheus+Grafana+AlertManager监控SpringBoot项目并发送邮件告警通知

这篇具有很好参考价值的文章主要介绍了Prometheus+Grafana+AlertManager监控SpringBoot项目并发送邮件告警通知。希望对大家有所帮助。如果存在错误或未考虑完全的地方,请大家不吝赐教,您也可以点击"举报违法"按钮提交疑问。

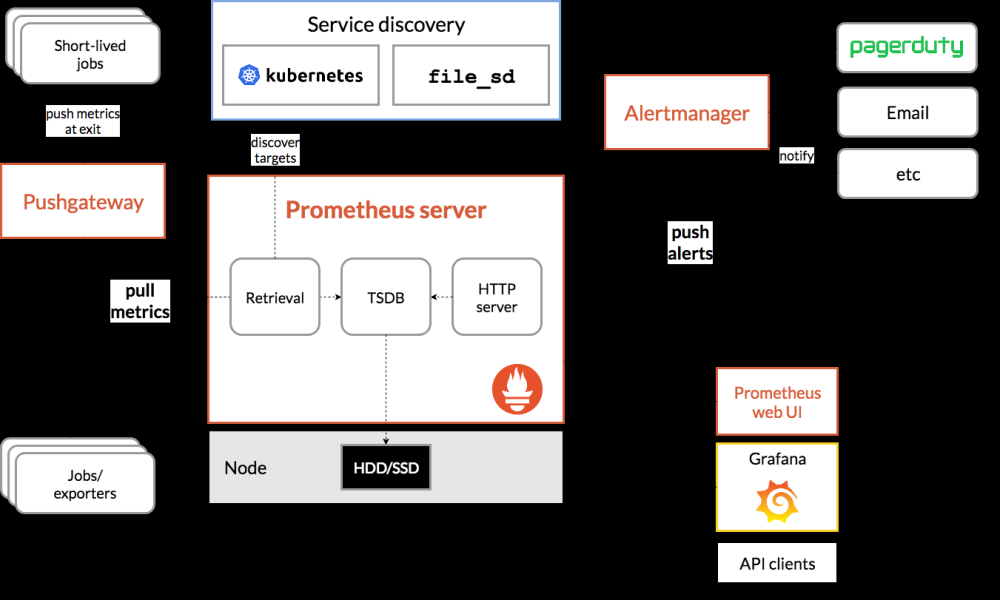
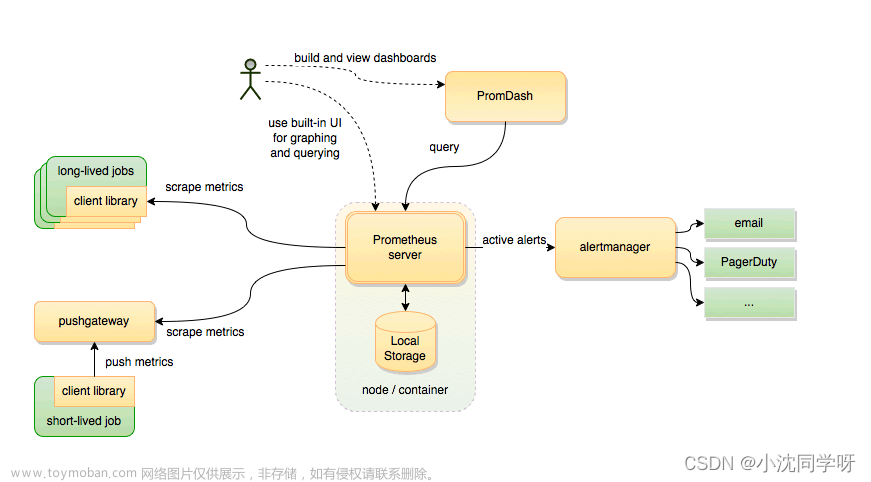
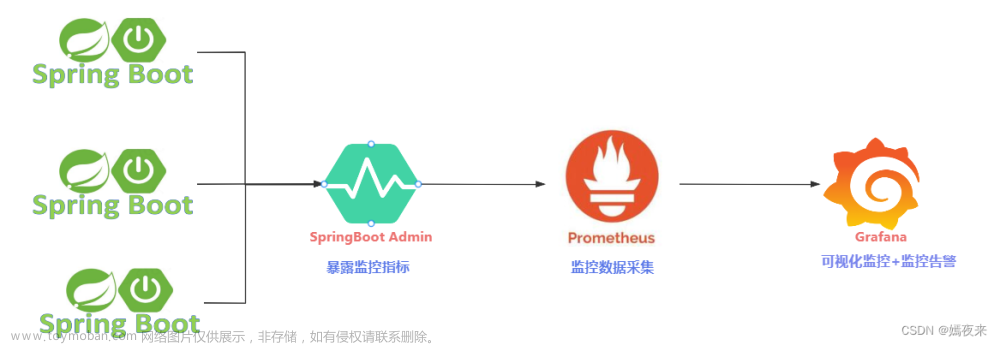
Prometheus+Grafana+AlertManager监控平台搭建

Docker搭建并配置Prometheus

Docker拉取并配置Grafana

Docker安装并配置Node-Exporter

Docker安装并配置cAdvisor

Docker安装并运行Alertmanager

新建SpringBoot项目

为Prometheus提供指标

新建项目,引入依赖

<!--用于导出prometheus系统类型的指标数据-->
<dependency>
    <groupId>io.micrometer</groupId>
    <artifactId>micrometer-registry-prometheus</artifactId>
    <version>1.9.8</version>
</dependency>

新建接口,运行程序

Prometheus配置文件中已添加该项目地址,运行后到Prometheus页面中查看连接情况
Prometheus+Grafana+AlertManager监控SpringBoot项目并发送邮件告警通知,后端,运维,Docker,prometheus,grafana,spring boot

成功

推送指标到pushgateway

引入依赖

<dependency>
    <groupId>io.prometheus</groupId>
    <artifactId>simpleclient</artifactId>
    <version>0.12.0</version>
</dependency>
<dependency>
    <groupId>io.prometheus</groupId>
    <artifactId>simpleclient_pushgateway</artifactId>
    <version>0.12.0</version>
</dependency>

新增push接口,用于推送指标(job=B,instance=A)到Pushgateway

@GetMapping("push")
public void executeBatchJob(){
    try{
        String url = "192.168.251.44:9091";
        CollectorRegistry registry = new CollectorRegistry();
        Gauge guage = Gauge.build("my_custom_metric11", "This is my custom metric.").create();
        guage.set(1.22);
        guage.register(registry);
        PushGateway pg = new PushGateway(url);
        Map<String, String> groupingKey = new HashMap<String, String>();
        groupingKey.put("instance", "A");
        pg.pushAdd(registry, "B", groupingKey);
    } catch (Exception e){
        e.printStackTrace();
    }
}

运行后调用接口,访问Pushgateway
Prometheus+Grafana+AlertManager监控SpringBoot项目并发送邮件告警通知,后端,运维,Docker,prometheus,grafana,spring boot

指标已被推送至Pushgateway

开始监控

Grafana连接Prometheus数据源

点击Add your first data source
Prometheus+Grafana+AlertManager监控SpringBoot项目并发送邮件告警通知,后端,运维,Docker,prometheus,grafana,spring boot

选择Prometheus
Prometheus+Grafana+AlertManager监控SpringBoot项目并发送邮件告警通知,后端,运维,Docker,prometheus,grafana,spring boot

Prometheus server URL中输入IP地址及端口号
注意:此处IP地址为Prometheus在Docker容器内部的IP地址
Prometheus+Grafana+AlertManager监控SpringBoot项目并发送邮件告警通知,后端,运维,Docker,prometheus,grafana,spring boot

查看容器内ID方法:

docker exec -it 容器ID sh
ifconfig

Prometheus+Grafana+AlertManager监控SpringBoot项目并发送邮件告警通知,后端,运维,Docker,prometheus,grafana,spring boot
退出:Ctrl+D

点击底部Save&Test
Prometheus+Grafana+AlertManager监控SpringBoot项目并发送邮件告警通知,后端,运维,Docker,prometheus,grafana,spring boot

导入Grafana模板

Prometheus+Grafana+AlertManager监控SpringBoot项目并发送邮件告警通知,后端,运维,Docker,prometheus,grafana,spring boot
填入模板号,点击load
Prometheus+Grafana+AlertManager监控SpringBoot项目并发送邮件告警通知,后端,运维,Docker,prometheus,grafana,spring boot
选择之前设置的Prometheus作为数据源即可
Prometheus+Grafana+AlertManager监控SpringBoot项目并发送邮件告警通知,后端,运维,Docker,prometheus,grafana,spring boot

监控SpringBoot项目

Prometheus+Grafana+AlertManager监控SpringBoot项目并发送邮件告警通知,后端,运维,Docker,prometheus,grafana,spring boot

邮件告警通知

开启邮箱POP3/SMTP服务(以QQ邮箱为例)

Prometheus+Grafana+AlertManager监控SpringBoot项目并发送邮件告警通知,后端,运维,Docker,prometheus,grafana,spring boot

开启后获得授权码,填到alertmanager配置文件相应位置中,并补全其他必要信息,重启alertmanager服务。
停止SpringBoot项目,等待一段时间。
进入Prometheus的Alerts页面,可以看到有告警信息,提示所监控机器不可用,状态已经为Firing,这表示已经将告警发送至Alertmanager。
Prometheus+Grafana+AlertManager监控SpringBoot项目并发送邮件告警通知,后端,运维,Docker,prometheus,grafana,spring boot

进入AlertManager界面,可以看到告警信息。
Prometheus+Grafana+AlertManager监控SpringBoot项目并发送邮件告警通知,后端,运维,Docker,prometheus,grafana,spring boot
AlertManager会根据配置好的规则将消息发送至邮箱。

Prometheus+Grafana+AlertManager监控SpringBoot项目并发送邮件告警通知,后端,运维,Docker,prometheus,grafana,spring boot

操作完成


同系列文章

Linux安装Docker

Docker搭建并配置Prometheus

Docker拉取并配置Grafana

Docker安装并配置Node-Exporter

Docker安装并配置cAdvisor

Docker安装并运行Alertmanager

Prometheus+Grafana+AlertManager监控Linux主机状态文章来源地址https://www.toymoban.com/news/detail-676511.html

到了这里,关于Prometheus+Grafana+AlertManager监控SpringBoot项目并发送邮件告警通知的文章就介绍完了。如果您还想了解更多内容,请在右上角搜索TOY模板网以前的文章或继续浏览下面的相关文章,希望大家以后多多支持TOY模板网!

本文来自互联网用户投稿,该文观点仅代表作者本人,不代表本站立场。本站仅提供信息存储空间服务,不拥有所有权,不承担相关法律责任。如若转载,请注明出处: 如若内容造成侵权/违法违规/事实不符,请点击违法举报进行投诉反馈,一经查实,立即删除!

领支付宝红包 赞助服务器费用

相关文章

  • K8s部署Prometheus+grafana+alertmanager报警监控系统(持续更新)

    自行准备一套k8s集群,如果不知道怎么搭建,可以参考一下我之前的博客 https://blog.csdn.net/qq_46902467/article/details/126660847 我的k8s集群地址是: k8s-master1 10.0.0.10 k8s-node1 10.0.0.11 k8s-node2 10.0.0.12 一、安装nfs服务 二、安装nfs客户端 三、部署Prometheus 四、部署grafana 五、部署alertmanage

    2023年04月24日
    浏览(39)
  • k8s集群监控及报警(Prometheus+AlertManager+Grafana+prometheusAlert+Dingding)

    k8s集群部署后,急需可靠稳定低延时的集群监控报警系统,报警k8s集群正常有序运行,经过不断调研和测试,最终选择Prometheus+AlertManager+Grafana+prometheusAlert的部署方案,故障信息报警至钉钉群和邮件,如需要额外监控可部署pushgateway主动推送数据到Prometheus进行数据采集 Promet

    2024年02月08日
    浏览(36)
  • SpringBoot+Prometheus+Grafana 监控面板(项目配置方式【入侵】)

    提示:本文使用SpringBoot 简单样例,介绍基础配置和使用方法 包含内容:Docker、SpringBoot、Maven、 Prometheus、Grafana等 提示:本文包含官网内容介绍,具体更项目的学习,请参照各官网文档,谢谢 官网:https://prometheus.io/ 文档地址:https://prometheus.io/docs/introduction/overview/ 使用领先

    2024年02月16日
    浏览(30)
  • Kubernetes(k8s)监控与报警(qq邮箱+钉钉):Prometheus + Grafana + Alertmanager(超详细)

    💖The Begin💖点点关注,收藏不迷路💖 Kubernetes是一个高度动态的容器编排平台,管理着大量的容器化应用程序。 为了保证这些应用程序的稳定性和性能,我们需要实施有效的监控和警报机制。在这篇文章中,我们将介绍如何使用Prometheus和Grafana构建一个完整的Kubernetes监控与

    2024年04月11日
    浏览(49)
  • 实战:Prometheus+Grafana监控Linux服务器及Springboot项目

    相信大家都知道一个项目交付生产并不意味着结束,更多的是对线上服务的运维监控。运维监控主要涉及到部署服务器的资源情况,各个子服务的资源情况以及垃圾收集和吞吐量等等,还有故障告警等等功能。当然,作为一个搬砖人也是需要了解全链路的运维监控组件Promet

    2024年02月14日
    浏览(35)
  • 部署prometheus、grafana、alertmanager

    简介:由于资源有限,本实验用了两台机器 监控端:部署prometheus、grafana、alertmanager 被监控端:node_exporter、mysqld_exporter https://prometheus.io/download/ ​  mkdir -p /data/prometheus ​  tar -zxvf /root/prometheus-2.42.0.linux-amd64.tar.gz -C /data/ ​  cd /data ​  mv prometheus-2.42.0.linux-amd64/ prometheus 创建

    2023年04月19日
    浏览(37)
  • SpringBoot+Prometheus+Grafana搭建应用监控系统

    SpringBoot的应用监控方案比较多,SpringBoot+Prometheus+Grafana是比较常用的一种解决方案,主要的监控数据的处理逻辑如下: SpringBoot 的 actuator 提供了应用监控端点,可以对外暴露监控数据信息。 Prometheus 是监控系统,可以从 Springboot 采集监控数据,以时序数据的形式存储,并对外

    2024年01月22日
    浏览(43)
  • SpringBoot+Prometheus+Grafana实现系统可视化监控

    SpringBoot中集成Actuator实现监控系统运行状态: SpringBoot中集成Actuator实现监控系统运行状态_springboot actuator 获取系统运行时长_霸道流氓气质的博客-CSDN博客 基于以上Actuator实现系统监控,还可采用如下方案。 Prometheus,是一个开源的系统监控和告警的工具包,其采用Pull方式采集

    2024年02月15日
    浏览(36)
  • 基于Prometheus 和 Grafana 实现springboot应用监控和服务器监控

    目录 1.Prometheus环境搭建 1.1 下载和安装Prometheus 1.2 配置Prometheus 1.3 配置Prometheus抓取Spring Boot应用Metrics 1.4 启动Prometheus 2.Grafana环境搭建 2.1 下载和安装Grafana 2.2 配置Grafana数据源 2.3 创建Dashboard 3、NodeExporter(服务器监控)插件配置安装 3.1 下载和安装Node Exporter 插件 3.2配置pro

    2024年02月13日
    浏览(32)
  • 【经验案例】Springboot微服务搭建JVM监控(Springboot + Prometheus + Grafana)

    由于项目之前在生产环境出现过OOM的问题,并且没有及时发现,导致生产环境出现了在一定时间内不可用的情况,故决定搭建JVM监控对微服务24小时监听,以便于出现问题能够及时通知相关人员进行服务降级或解决问题。 经过可行性分析,得到目前较为适合的微服务监控为

    2024年02月06日
    浏览(34)

觉得文章有用就打赏一下文章作者

支付宝扫一扫打赏

博客赞助

微信扫一扫打赏

请作者喝杯咖啡吧~博客赞助

支付宝扫一扫领取红包,优惠每天领

二维码1

领取红包

二维码2

领红包