时序预测 | MATLAB实现基于QPSO-BiLSTM、PSO-BiLSTM和BiLSTM时间序列预测
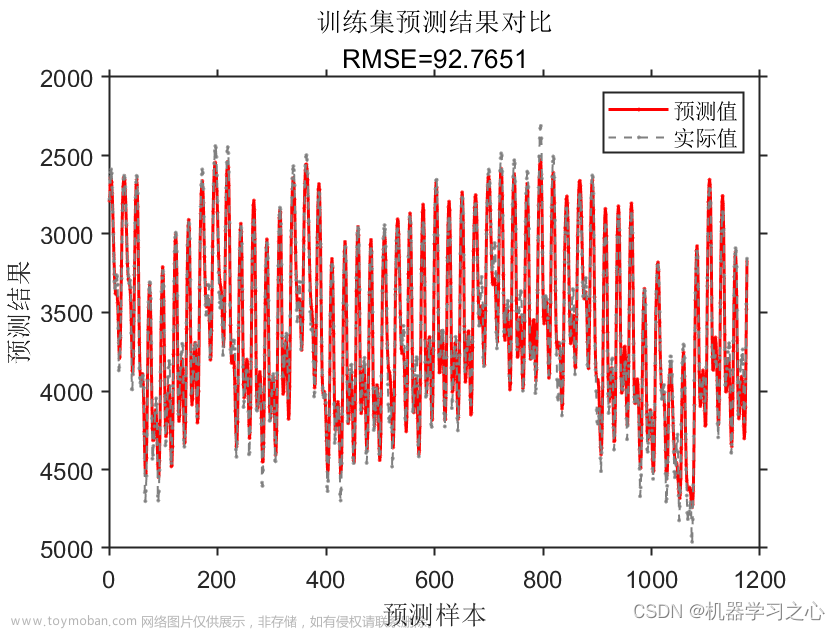
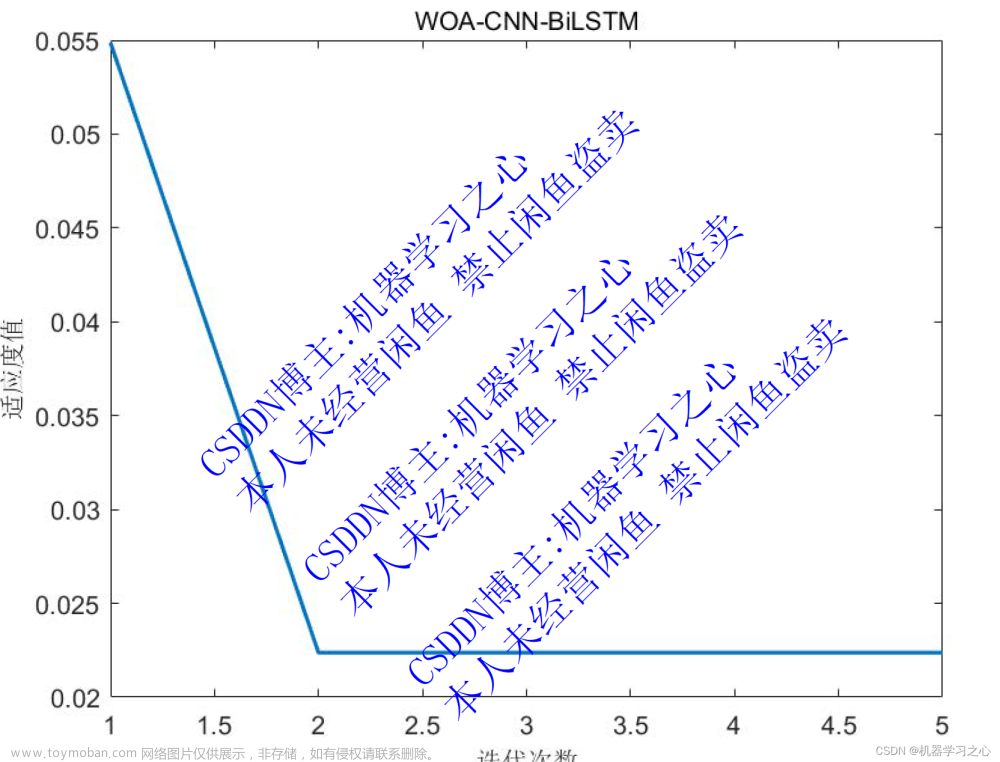
效果一览


基本描述
1.Matlab实现QPSO-BiLSTM、PSO-BiLSTM和BiLSTM神经网络时间序列预测;
2.输入数据为单变量时间序列数据,即一维数据;
3.运行环境Matlab2020及以上,依次运行Main1BiLSTMTS、Main2PSOBiLSTMTS、Main3QPSOBiLSTMTS、Main4CDM即可,其余为函数文件无需运行,所有程序放在一个文件夹,data为数据集;BiLSTM(双向长短时记忆模型)与粒子群算法优化后的BiLSTM(PSOBiLSTM)以及量子粒子群算法优化后的BiLSTM(QPSOBiLSTM)对比实验,可用于风电、光伏等负荷预测,时序预测,数据为单输入单输出,PSO、QPSO优化超参数为隐含层1节点数、隐含层2节点数、最大迭代次数和学习率。
4.命令窗口输出MAE、MAPE、RMSE和R2;文章来源:https://www.toymoban.com/news/detail-680548.html
程序设计
- 完整程序和数据下载:私信博主回复QPSO-BiLSTM、PSO-BiLSTM和BiLSTM时间序列预测。
for i=1:PopNum%随机初始化速度,随机初始化位置
    for j=1:dim
        if j==dim% % 隐含层节点与训练次数是整数 学习率是浮点型
            pop(i,j)=(xmax(j)-xmin(j))*rand+xmin(j);
        else
            pop(i,j)=round((xmax(j)-xmin(j))*rand+xmin(j));  %
        end
    end
end

% calculate the fitness_value of Pop
pbest = pop;
gbest = zeros(1,dim);
data1 = zeros(Maxstep,PopNum,dim);
data2 = zeros(Maxstep,PopNum);
for i = 1:PopNum
    fit(i) = fitness(pop(i,:),p_train,t_train,p_test,t_test);
    f_pbest(i) = fit(i);
end
g = min(find(f_pbest == min(f_pbest(1:PopNum))));
gbest = pbest(g,:);
f_gbest = f_pbest(g);

%-------- in the loop -------------
for step = 1:Maxstep

    mbest =sum(pbest(:))/PopNum;
    % linear weigh factor
    b = 1-step/Maxstep*0.5;
    data1(step,:,:) = pop;
    data2(step,:) = fit;
    for i = 1:PopNum
        a = rand(1,dim);
        u = rand(1,dim);
        p = a.*pbest(i,:)+(1-a).*gbest;
        pop(i,:) = p + b*abs(mbest-pop(i,:)).*...
            log(1./u).*(1-2*(u >= 0.5));
        % boundary detection

        for j=1:dim
            if j ==dim
                if pop(i,j)>xmax(j) | pop(i,j)<xmin(j)
                    pop(i,j)=(xmax(j)-xmin(j))*rand+xmin(j);  %
                end
            else
                pop(i,j)=round(pop(i,j));
                if pop(i,j)>xmax(j) | pop(i,j)<xmin(j)
                    pop(i,j)=round((xmax(j)-xmin(j))*rand+xmin(j));  %
                end
            end
        end


        fit(i) = fitness(pop(i,:),p_train,t_train,p_test,t_test);
        if fit(i) < f_pbest(i)
            pbest(i,:) = pop(i,:);
            f_pbest(i) = fit(i);
        end
        if f_pbest(i) < f_gbest
            gbest = pbest(i,:);
            f_gbest = f_pbest(i);
        end
    end
    trace(step)=f_gbest;
    step,f_gbest,gbest
    result(step,:)=gbest;
end
or i=1:N%随机初始化速度,随机初始化位置
    for j=1:D
        if j==D% % 隐含层节点与训练次数是整数 学习率是浮点型
            x(i,j)=(xmax(j)-xmin(j))*rand+xmin(j);
        else
            x(i,j)=round((xmax(j)-xmin(j))*rand+xmin(j));  %
        end
    end

    v(i,:)=rand(1,D);
end

%------先计算各个粒子的适应度,并初始化Pi和Pg----------------------
for i=1:N
    p(i)=fitness(x(i,:),p_train,t_train,p_test,t_test);
    y(i,:)=x(i,:);

end
[fg,index]=min(p);
pg = x(index,:);             %Pg为全局最优

%------进入主要循环,按照公式依次迭代------------

for t=1:M

    for i=1:N
        v(i,:)=w*v(i,:)+c1*rand*(y(i,:)-x(i,:))+c2*rand*(pg-x(i,:));
        x(i,:)=x(i,:)+v(i,:);


        for j=1:D
            if j ~=D
                x(i,j)=round(x(i,j));
            end
            if x(i,j)>xmax(j) | x(i,j)<xmin(j)
                if j==D
                    x(i,j)=(xmax(j)-xmin(j))*rand+xmin(j);  %
                else
                    x(i,j)=round((xmax(j)-xmin(j))*rand+xmin(j));  %
                end
            end
        end
        temp=fitness(x(i,:),p_train,t_train,p_test,t_test);
        if temp<p(i)
            p(i)=temp;
            y(i,:)=x(i,:);
        end

        if p(i)<fg
            pg=y(i,:);
            fg=p(i);
        end
    end
    trace(t)=fg;
    result(t,:)=pg;
参考资料
[1] https://blog.csdn.net/kjm13182345320/article/details/127596777?spm=1001.2014.3001.5501
[2] https://download.csdn.net/download/kjm13182345320/86830096?spm=1001.2014.3001.5501文章来源地址https://www.toymoban.com/news/detail-680548.html
到了这里,关于时序预测 | MATLAB实现基于QPSO-BiLSTM、PSO-BiLSTM和BiLSTM时间序列预测的文章就介绍完了。如果您还想了解更多内容,请在右上角搜索TOY模板网以前的文章或继续浏览下面的相关文章,希望大家以后多多支持TOY模板网!


