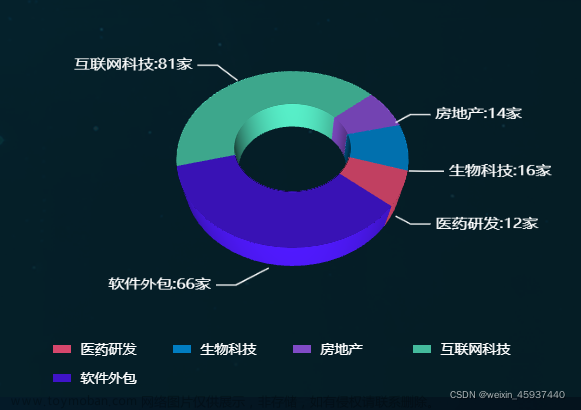
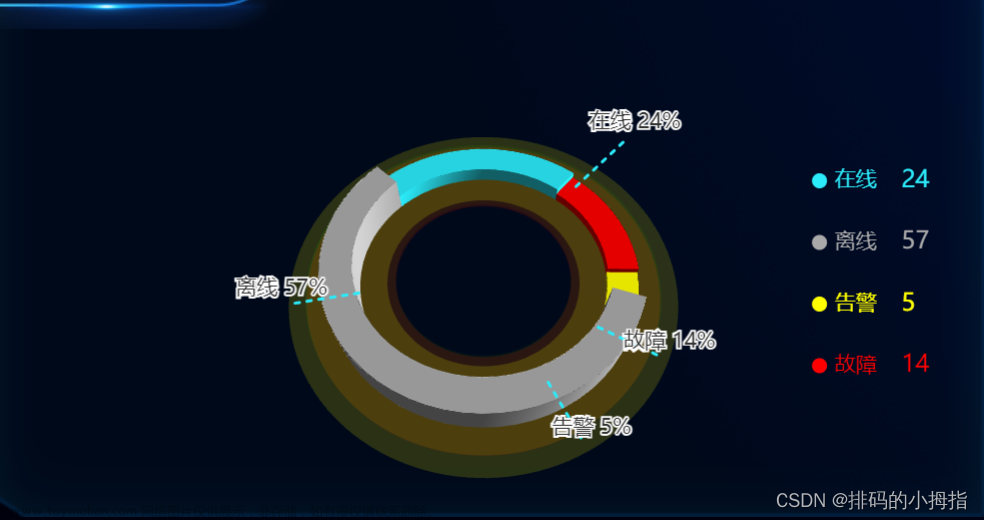
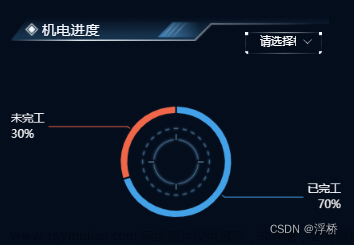
1.拿到产品原型图,需求中有这样一个图表

2.翻看echart的饼图示例,没有这种复合饼图,只有一个嵌套饼图

3. 于是网上查网友的文章,查到两篇类似的贴子,(52条消息) echarts模仿excel复合饼图(饼-饼)_相忘于江湖426543的博客-CSDN博客_echarts复核饼图 和 (52条消息) echarts实现复合饼图_JustMo_的博客-CSDN博客_echarts 复合饼图 其中一篇是react的,个别地方我看不太懂, 总之结合这两篇文章大概实现了这个需求
4. 首先是copy示例中的全部代码,在页面上先把这个嵌套的饼图搞出来
5. 移动中间的饼到右边,调整好两个饼的位置关系,这一步是通过media实现
在option中增加media属性,如图,内容见代码段

media: [
          {
            query: { minAspectRatio: 1 },
            option: {
              series: [{ center: ["70%", "50%"] }, { center: ["30%", "50%"] }],
            },
          },
        ],
然后修改第一个饼的半径 radius,使它成为一个实心的饼

调整第一个饼的旋转角度 startAngle,让它的较小的一个角朝正右方,这样方便后面画两条连接线
计算方式:这一角的数据占总数的比例去乘以360再除以2
原理:一个饼图渲染的时候默认是从90°开始的,x轴正向是0°,y轴正向是90°,依此类推一圈回来是360°。
startAngle() {
      let sum = 0;
      this.dataArr.forEach((element) => {
        sum += element.value;
      });
      return 360 * (this.dataArr[0].value / sum) * 0.5;
    },
效果:

最后就剩下两条线了。画线用markLine属性,两点确定一条直线,所以要找到两条线的分卸的起点坐标和终点坐标,终点的话这里就好说了,直接找到右边小饼的上下两个点就ok了,重点是两个起点坐标。
这里选择的办法是:先找到圆心坐标 和半径长度,再利用数学公式cos 算出它的x坐标值。我这里的圆心横坐标是450,半径长是200


 let x1 = x0 + (height / 4) * Math.cos((this.startAngle * 3.14) / 180);
      let y1 =
        height * 0.5 - (height / 4) * Math.sin((this.startAngle * 3.14) / 180);
 x2 = x1;
      y2 =
height * 0.5 + (height / 4) * Math.sin((this.startAngle * 3.14) / 180);全部代码:文章来源:https://www.toymoban.com/news/detail-686247.html
<template>
  <div id="main" style="width: 1500px; height: 800px"></div>
</template>

<script>
import * as echarts from "echarts";
export default {
  data() {
    return {
      chartDom: null,
      myChart: null,
      chartView: null,
      dataArr: [
        { value: 220, name: "Baidu" },
        { value: 500, name: "Direct" },
      ],
    };
  },
  computed: {
    startAngle() {
      let sum = 0;
      this.dataArr.forEach((element) => {
        sum += element.value;
      });
      return 360 * (this.dataArr[0].value / sum) * 0.5;
    },
    option() {
      if (this.chartView) {
        console.log("222");
        // changePos = true;
        let tmp = this.chartView[1]._data._itemLayouts[0];
        // let tmp = this.chartView; //[1]._data._itemLayouts[0];
        pos.startTop = {
          x: tmp.cx + Math.cos(tmp.startAngle) * tmp.r,
          y: tmp.cy + Math.sin(tmp.startAngle) * tmp.r,
        };
        pos.startBootom = {
          x: tmp.cx + Math.cos(tmp.endAngle) * tmp.r,
          y: tmp.cy + Math.sin(tmp.endAngle) * tmp.r,
        };
      }

      return {
        tooltip: {
          trigger: "item",
          formatter: "{a} <br/>{b}: {c} ({d}%)",
        },
        legend: {
          data: [
            "Direct",
            "Marketing",
            "Search Engine",
            "Email",
            "Union Ads",
            "Video Ads",
            "Baidu",
            "Google",
            "Bing",
            "Others",
          ],
        },
        series: [
          {
            name: "Access From",
            type: "pie",
            // selectedMode: "single",
            radius: [0, "30%"],
            label: {
              position: "inner",
              fontSize: 14,
            },
            labelLine: {
              show: false,
            },
            data: [
              { value: 1548, name: "Search Engine" },
              { value: 775, name: "Direct" },
              { value: 679, name: "Marketing", selected: true },
            ],
          },
          {
            name: "Access From",
            type: "pie",
            radius: [0, "50%"],
            labelLine: {
              length: 30,
            },
            label: {
              formatter: "{a|{a}}{abg|}\n{hr|}\n  {b|{b}:}{c}  {per|{d}%}  ",
              backgroundColor: "#F6F8FC",
              borderColor: "#8C8D8E",
              borderWidth: 1,
              borderRadius: 4,
              rich: {
                a: {
                  color: "#6E7079",
                  lineHeight: 22,
                  align: "center",
                },
                hr: {
                  borderColor: "#8C8D8E",
                  width: "100%",
                  borderWidth: 1,
                  height: 0,
                },
                b: {
                  color: "#4C5058",
                  fontSize: 14,
                  fontWeight: "bold",
                  lineHeight: 33,
                },
                per: {
                  color: "#fff",
                  backgroundColor: "#4C5058",
                  padding: [3, 4],
                  borderRadius: 4,
                },
              },
            },
            data: this.dataArr,
            startAngle: this.startAngle,
            markLine: {
              silent: true,
              symbol: "none",
              data: this.getMarkLineData(),
            },
          },
        ],
        media: [
          {
            query: { minAspectRatio: 1 },
            option: {
              series: [{ center: ["70%", "50%"] }, { center: ["30%", "50%"] }],
            },
          },
        ],
      };
    },
  },
  mounted() {
    this.chartDom = document.getElementById("main");
    this.myChart = echarts.init(this.chartDom);

    this.myChart.setOption(this.option);
    console.log("mychart", this.myChart);
  },
  methods: {
    getMarkLineData(percent) {
      // 1.获取画布 width,height
      let height = this.myChart.getHeight();
      let width = this.myChart.getWidth();
      console.log("width", width, "height", height);

      // 2.  根据 series[0].center 获取圆心坐标
      let x0 = 450; // 圆心x轴坐标
      let x1 = x0 + (height / 4) * Math.cos((this.startAngle * 3.14) / 180);
      let y1 =
        height * 0.5 - (height / 4) * Math.sin((this.startAngle * 3.14) / 180);
      x2 = x1;
      y2 =
        height * 0.5 + (height / 4) * Math.sin((this.startAngle * 3.14) / 180);
      let result = [
        [
          {
            x: x1,
            y: y1,
          },
          {
            x: "70%",
            y: "35%",
          },
        ],
        [
          {
            x: x1,
            y: y2,
          },
          {
            x: "70%",
            y: 521,
          },
        ],
      ];
      return result;
    },
  },
};
</script>
最终效果图文章来源地址https://www.toymoban.com/news/detail-686247.html

到了这里,关于vue中用echarts实现复合饼图,带关系连接线的文章就介绍完了。如果您还想了解更多内容,请在右上角搜索TOY模板网以前的文章或继续浏览下面的相关文章,希望大家以后多多支持TOY模板网!


