echart的tooltip自动展示

这篇具有很好参考价值的文章主要介绍了echart的tooltip自动展示。希望对大家有所帮助。如果存在错误或未考虑完全的地方,请大家不吝赐教,您也可以点击"举报违法"按钮提交疑问。

引入js文件

import {autoHover} from ‘./tooltip’文章来源地址https://www.toymoban.com/news/detail-688307.html

/**
 * echarts tooltip轮播
 * @param chart ECharts实例
 * @param chartOption echarts的配置信息
 * @param options object 选项
 * {
 *  interval    轮播时间间隔,单位毫秒,默认为3000
 *              true表示循环所有series的tooltip,false则显示指定seriesIndex的tooltip
 *  seriesIndex 默认为0,指定某个系列(option中的series索引)循环显示tooltip,
 *              当loopSeries为true时,从seriesIndex系列开始执行。
 * }
 * @returns {{clearLoop: clearLoop}|undefined}
 */

 export function autoHover(myChart, option, num, time) {
    var defaultData = { // 设置默认值
      time: 3000,
      num: 14
    };
    if (!time) {
      time = defaultData.time;
    }
    if (!num) {
      num = defaultData.num;
    }
  
    var count = 0;
    var timeTicket = 0;
  
  
    // 清除定时器
    function clearLoop() {
      if (timeTicket) {
        clearInterval(timeTicket);
        timeTicket = 0;
      }
  
      myChart.off('mousemove', stopAutoShow);
      myChart.getZr().off('mousemove', zRenderMouseMove);
      // myChart.getZr().off('globalout', zRenderGlobalOut);
    }
  
    // 关闭轮播
    function stopAutoShow() {
      if (timeTicket) {
        clearInterval(timeTicket);
        timeTicket = 0;
      }
    }
  
    function zRenderMouseMove(param) {
      if (param.event) {
        // 阻止canvas上的鼠标移动事件冒泡
        // param.event.cancelBubble = true;
      }
  
      stopAutoShow();
    }
  
  
    timeTicket && clearInterval(timeTicket);
    timeTicket = setInterval(function() {
      myChart.dispatchAction({
        type: 'downplay',
        seriesIndex: 0 // serieIndex的索引值   可以触发多个
      });
      myChart.dispatchAction({
        type: 'highlight',
        seriesIndex: 0,
        dataIndex: count
      });
      myChart.dispatchAction({
        type: 'showTip',
        seriesIndex: 0,
        dataIndex: count
      });
      count++;
      if (count >= num) {
        count = 0;
      }
    }, time);
    myChart.on('mouseover', function(params) {
      clearInterval(timeTicket);
      myChart.dispatchAction({
        type: 'downplay',
        seriesIndex: 0
      });
      myChart.dispatchAction({
        type: 'highlight',
        seriesIndex: 0,
        dataIndex: params.dataIndex
      });
      myChart.dispatchAction({
        type: 'showTip',
        seriesIndex: 0,
        dataIndex: params.dataIndex
      });
    });
  
    myChart.on('mouseout', function() {
      timeTicket && clearInterval(timeTicket);
      timeTicket = setInterval(function() {
        myChart.dispatchAction({
          type: 'downplay',
          seriesIndex: 0 // serieIndex的索引值   可以触发多个
        });
        myChart.dispatchAction({
          type: 'highlight',
          seriesIndex: 0,
          dataIndex: count
        });
        myChart.dispatchAction({
          type: 'showTip',
          seriesIndex: 0,
          dataIndex: count
        });
        count++;
        if (count >= 14) {
          count = 0;
        }
      }, 3000);
    });
    return {
      clearLoop: clearLoop
    };
  }

在echart里注册使用

 myChart.setOption(option, true);
      this.tootipTimer && this.tootipTimer.clearLoop(); // this.tootipTimer 在data里定义
      this.tootipTimer = 0;
      this.tootipTimer = autoHover(myChart, option, 8, 3000);

到了这里,关于echart的tooltip自动展示的文章就介绍完了。如果您还想了解更多内容,请在右上角搜索TOY模板网以前的文章或继续浏览下面的相关文章,希望大家以后多多支持TOY模板网!

本文来自互联网用户投稿,该文观点仅代表作者本人,不代表本站立场。本站仅提供信息存储空间服务,不拥有所有权,不承担相关法律责任。如若转载,请注明出处: 如若内容造成侵权/违法违规/事实不符,请点击违法举报进行投诉反馈,一经查实,立即删除!

领支付宝红包 赞助服务器费用

相关文章

  • Echarts图表之dispatchAction 操作 固定tooltip显示框

    echarts中支持的图表行为,通过dispatchAction触发。 使用dispatchAction操作来固定tooltip显示框,无需鼠标事件响应进入页面默认固定显示框,方便数据展示。   dispatchAction固定tooltip显示框需要 tooltip属性为axis    myChart.setOption(option);   //装配mychart  myChart.dispatchAction({         // 使

    2024年02月14日
    浏览(40)
  • Vue3 中 echarts 不显示 tooltip 的问题

    近期在项目中需要用到图表类型的数据展示,就想到了用 echarts,项目用的是 Vue3 ,到官网看文档,一顿捣鼓之后在页面上能正常显示图表,本想着一样按套路去展示更多的图表,不出意外的话指定要出意外,这个时候发现图表的提示框 tooltip 没显示!!经过一番查证,发现

    2024年02月14日
    浏览(36)
  • 3D圆环图Echarts + 图例滚动显示 + tooltip鼠标经过的弹框滚动显示

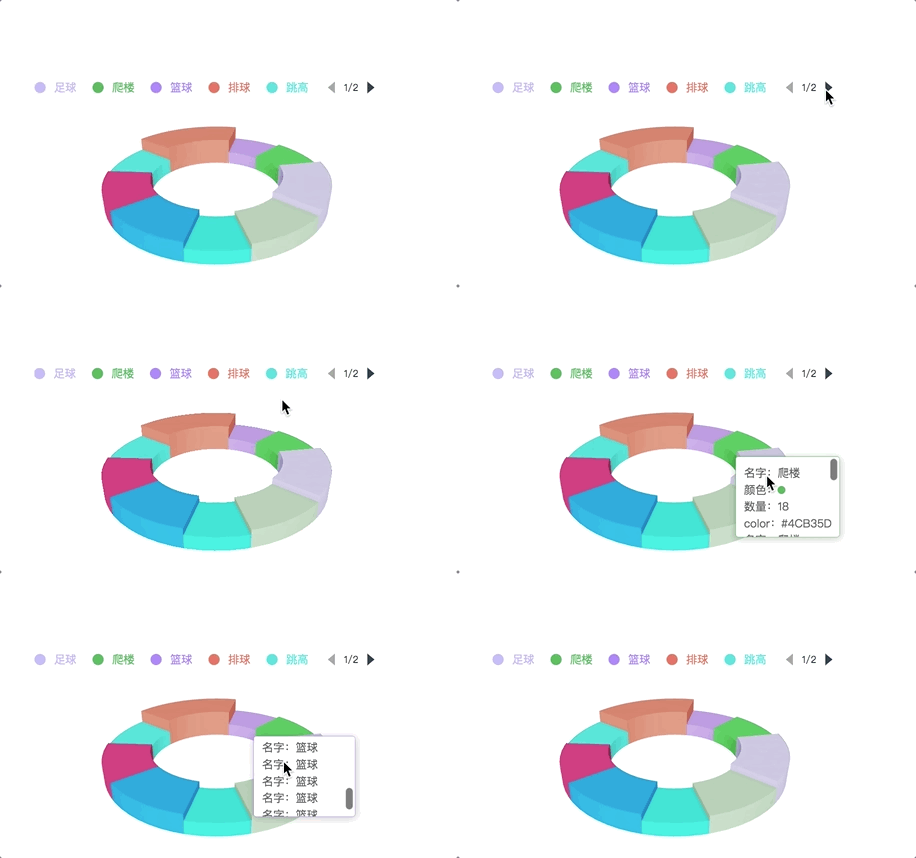
    效果图如下: 这是一个3D效果的Echarts圆环图,每个类别的数据相当于高度,图例可以滚动显示,tips也可以滚动显示,完整代码看最后。 1.图例滚动显示效果 2.tooltip鼠标经过弹框滚动效果 完整代码如下(脚手架写法):

    2024年02月14日
    浏览(37)
  • 详解:当鼠标放上echarts图形时,显示数据、名称,或者自定义tooltip弹窗

     主要知识点:tooltip{}该配置项为:提示框组件相关设置 写入代码的位置如下,tooltip与xAxis同级 效果一实现代码 效果二实现代码: 更加灵活的自定义弹窗,可以自己写html,其中 params[0].marker 是柱形颜色的圆形,其他参数可以打印 params查看一下 然后拼接进html里 写入代码的位

    2024年02月11日
    浏览(40)
  • echarts——柱状图,Y轴不显示,series内容展示在Y轴附近——基础积累

    最近看到同事在做下面效果的柱状图,效果图如下: 1.竖向柱状图——改为横向柱状图 需要将xAxis中的type:\\\'category\\\'改到yAxis中的type中 也就是说哪个轴的type是category,哪个轴就是主轴,X轴是主轴则柱状图是竖向的,Y轴是主轴则柱状图是横向的。 2.隐藏Y轴—— yAxis中的show设置

    2024年02月13日
    浏览(31)
  • echarts自定义tooltip,给tooltip增加百分号%

    支持返回 HTML 字符串或者创建的 DOM 实例。 (params: Object|Array, ticket: string, callback: (ticket: string, html: string)) = string | HTMLElement | HTMLElement[] 在 trigger 为 ‘axis’ 的时候,或者 tooltip 被 axisPointer 触发的时候,params 是多个系列的数据数组。其中每项内容格式同上,并且, { componentT

    2024年02月15日
    浏览(54)
  • echarts的tooltip添加点击事件

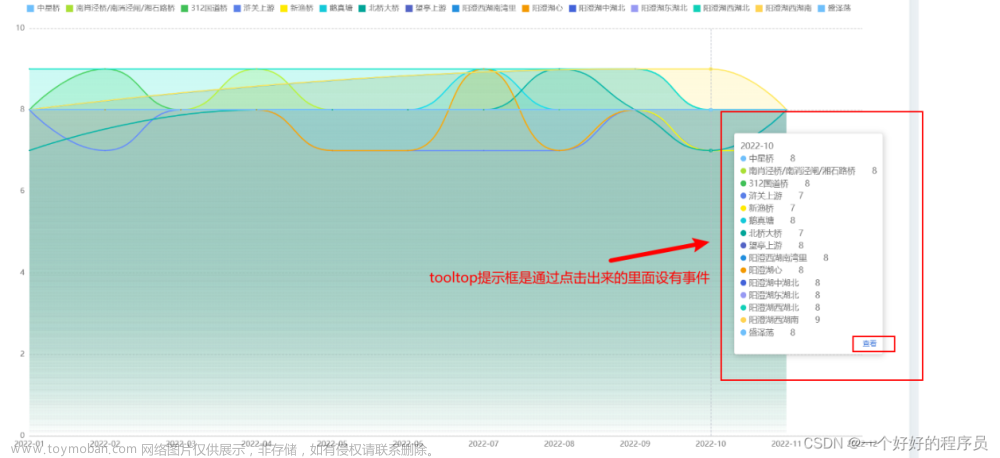
    效果如下  代码如下  代码如下

    2024年02月16日
    浏览(35)
  • echarts 提示框tooltip被遮挡的解决办法

    当echart的容器外部 dom 被设置为 overflow: hidden 时,提示框会被遮挡。 解决办法: 一、tooltip. confine 这样可以限制提示框在图表的区域内。 二、tooltip. appendToBody 默认值是 false 。 false 表示,tooltip 的 DOM 节点会被添加为本图表的 DOM container 的一个子孙节点。但是这种方式导致,

    2024年02月12日
    浏览(67)
  • echarts自定义x轴和tooltip数据格式

    x轴和y轴数据格式如下 修改后xy轴数据格式如下 需求: 将json数据转成折线图需要的数据格式,并且x轴始终为0 - 23 点,并且折线图上的点数不会缺失,对应时间有点位的就展示,没有就空

    2024年01月19日
    浏览(50)

觉得文章有用就打赏一下文章作者

支付宝扫一扫打赏

博客赞助

微信扫一扫打赏

请作者喝杯咖啡吧~博客赞助

支付宝扫一扫领取红包,优惠每天领

二维码1

领取红包

二维码2

领红包