python-数据分析-numpy、pandas、matplotlib的常用方法

这篇具有很好参考价值的文章主要介绍了python-数据分析-numpy、pandas、matplotlib的常用方法。希望对大家有所帮助。如果存在错误或未考虑完全的地方,请大家不吝赐教,您也可以点击"举报违法"按钮提交疑问。

一、numpy

import numpy as np

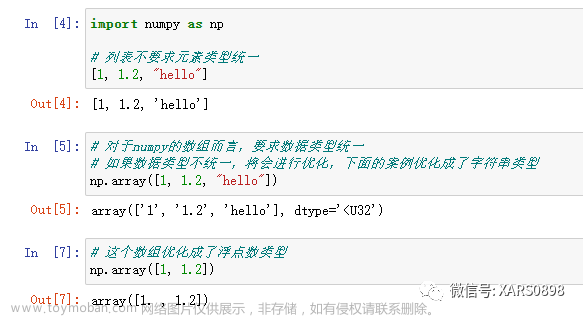
1.numpy 数组 和 list 的区别

输出方式不同
python-数据分析-numpy、pandas、matplotlib的常用方法,python,数据分析,jupyter,plotly,matplotlib,numpy,pandas

里面包含的元素类型
python-数据分析-numpy、pandas、matplotlib的常用方法,python,数据分析,jupyter,plotly,matplotlib,numpy,pandas

2.构造并访问二维数组

使用 索引/切片 访问ndarray元素

切片 左闭右开

np.array(list)

python-数据分析-numpy、pandas、matplotlib的常用方法,python,数据分析,jupyter,plotly,matplotlib,numpy,pandas

3.快捷构造高维数组

  • np.arange()

  • np.random.randn() - - - 服从标准正态分布- - - 数学期望 μ - - - 标准方差 s
    python-数据分析-numpy、pandas、matplotlib的常用方法,python,数据分析,jupyter,plotly,matplotlib,numpy,pandas
    使用matplotlib.pyplot模块验证标准正态分布
    python-数据分析-numpy、pandas、matplotlib的常用方法,python,数据分析,jupyter,plotly,matplotlib,numpy,pandas

  • np.random.randint(起始数,终止数(行,列))

4.改变数组的形状 几行几列 reshape

python-数据分析-numpy、pandas、matplotlib的常用方法,python,数据分析,jupyter,plotly,matplotlib,numpy,pandas

二、pandas

数据分析 - - - 数据清洗 - - - 控制过滤 - - - 异常值捕获

map分组 聚合

import numpy as np
import pandas as pd

pandas善于处理二维数据

1.数据结构 Series 和 DataFrame

Series

series类似于通过numpy产生的一维数据,但series包含索引(可以自己定)
python-数据分析-numpy、pandas、matplotlib的常用方法,python,数据分析,jupyter,plotly,matplotlib,numpy,pandas

python-数据分析-numpy、pandas、matplotlib的常用方法,python,数据分析,jupyter,plotly,matplotlib,numpy,pandas

DataFrame

DataFrame是一种二维表格数据结构

创建方法:

  1. 通过列表创建

    行索引是index,列索引是columns

    python-数据分析-numpy、pandas、matplotlib的常用方法,python,数据分析,jupyter,plotly,matplotlib,numpy,pandas

    先创建一个空的DataFrame,通过列表生成DataFrame

    python-数据分析-numpy、pandas、matplotlib的常用方法,python,数据分析,jupyter,plotly,matplotlib,numpy,pandas

  2. 通过字典创建

    python-数据分析-numpy、pandas、matplotlib的常用方法,python,数据分析,jupyter,plotly,matplotlib,numpy,pandas
    简单创建
    python-数据分析-numpy、pandas、matplotlib的常用方法,python,数据分析,jupyter,plotly,matplotlib,numpy,pandas
    将字典键变成行索引 - - - from_dict - - - orient(朝向)或者使用 T
    python-数据分析-numpy、pandas、matplotlib的常用方法,python,数据分析,jupyter,plotly,matplotlib,numpy,pandas

    data = {'a':[1,3,5],'b':[2,4,6]}
    pd.DataFrame(data = data)
    
    pd.DataFrame.from_dict(data,orient='index')
    

    python-数据分析-numpy、pandas、matplotlib的常用方法,python,数据分析,jupyter,plotly,matplotlib,numpy,pandas

  3. 通过二维数组创建

    python-数据分析-numpy、pandas、matplotlib的常用方法,python,数据分析,jupyter,plotly,matplotlib,numpy,pandas

    np.arange(12)	# array([ 0,  1,  2,  3,  4,  5,  6,  7,  8,  9, 10, 11])
    

2.修改索引

set_index 把常规行变成索引列

不会修改原始数据,若希望修改,使用 inplace=True

data.set_index(‘index’, inplace=True)

python-数据分析-numpy、pandas、matplotlib的常用方法,python,数据分析,jupyter,plotly,matplotlib,numpy,pandas

修改列名称 rename

修改列名称,使用columns - - - 行 index
使用字典来表达映射关系 - - - {原始数据:新数据}
python-数据分析-numpy、pandas、matplotlib的常用方法,python,数据分析,jupyter,plotly,matplotlib,numpy,pandas

将行索引变成常规列 reset_index()

若想修改原始数据 使用reset_index(replace=True)
python-数据分析-numpy、pandas、matplotlib的常用方法,python,数据分析,jupyter,plotly,matplotlib,numpy,pandas

3.Excel或csv数据的读取和写入

pd.read_excel(file_name, sheet_name=0, index_col=0)
从左到右,第一个sheet索引是0,该函数返回该页内容 - - - 会将第一行变为列索引 - - - 行索引从0开始
index_col=0 :将第一列变成行索引
header=0:将第一行变成列索引 - - - header=[0,1] 将前两行变成列索引

xxx.to_excel(file_name):将数据写到新的Excel文件

pd.read_csv(file_name, sep=','):读取csv文件,sep默认逗号分隔
index_col - - - header
xxx.to_csv(file_name)

4.pandas数据的读取和筛选

df = pd.DataFrame(data=[[1,2,3],[4,5,6],[7,8,9]],index=['r1','r2','r3'],columns=['c1','c2','c3'])

python-数据分析-numpy、pandas、matplotlib的常用方法,python,数据分析,jupyter,plotly,matplotlib,numpy,pandas

  • 读取 列 xxx[‘xxx’]
    python-数据分析-numpy、pandas、matplotlib的常用方法,python,数据分析,jupyter,plotly,matplotlib,numpy,pandas
  • 读取 行 xx.loc[‘xxx’]

python-数据分析-numpy、pandas、matplotlib的常用方法,python,数据分析,jupyter,plotly,matplotlib,numpy,pandas

  • df.head()
    默认查看前5行,出入几查看几行

  • 查看特殊的数据 按照特定条件筛选

    python-数据分析-numpy、pandas、matplotlib的常用方法,python,数据分析,jupyter,plotly,matplotlib,numpy,pandas

5.数据整体情况查看

  • df.shape - - - 查看数据有几行几列
  • df.describe() - - - 查看一些统计指标 – 每一列的个数 均值 标准方差 最小值 最大值
  • df.info() - - - 查看表格数据的信息 - - - 每一列的个数 是否有空值 每一列的类型

python-数据分析-numpy、pandas、matplotlib的常用方法,python,数据分析,jupyter,plotly,matplotlib,numpy,pandas

  • df.value_counts() - - - df.loc[‘r2’].value_counts()
    查看某行或某列有哪些数据,以及这些次数出现的频次
    python-数据分析-numpy、pandas、matplotlib的常用方法,python,数据分析,jupyter,plotly,matplotlib,numpy,pandas

6.数据运算

  • 从已有的列,通过数据运算创造一个新的列
    python-数据分析-numpy、pandas、matplotlib的常用方法,python,数据分析,jupyter,plotly,matplotlib,numpy,pandas
  • sum 求和 mean 均值 axis=0 is 列(默认) axis=1 is 行
    求列方向的聚合值

7.数据映射 map()

map()根据列对数据进行映射

map是一个循环遍历的过程

people = pd.DataFrame(data={
    '身高':np.random.randint(130,180,10),
    'age':np.random.randint(18,23,10)
})

python-数据分析-numpy、pandas、matplotlib的常用方法,python,数据分析,jupyter,plotly,matplotlib,numpy,pandas

def map_high(x):
    if x >= 170:
        return '高'
    else:
        return '低'

people['高/低'] = people['身高'].map(map_high)

python-数据分析-numpy、pandas、matplotlib的常用方法,python,数据分析,jupyter,plotly,matplotlib,numpy,pandas

python-数据分析-numpy、pandas、matplotlib的常用方法,python,数据分析,jupyter,plotly,matplotlib,numpy,pandas

8.空值的填充和查找

NaN空值·

写入空值

python-数据分析-numpy、pandas、matplotlib的常用方法,python,数据分析,jupyter,plotly,matplotlib,numpy,pandas

填充空值 fillna()

表格数据如果显示NaN,表示此处为空值fillna()函数,可以填充空值
inplace=True表示写入到数据内存

people.fillna(value=0, inplace=True)

将空值NaN使用value替换

python-数据分析-numpy、pandas、matplotlib的常用方法,python,数据分析,jupyter,plotly,matplotlib,numpy,pandas

查找空值 isnull()

是NaN,返回True - - - True is 1
不是返回False - - - False is 0

python-数据分析-numpy、pandas、matplotlib的常用方法,python,数据分析,jupyter,plotly,matplotlib,numpy,pandas
xxx.isnull().sum() 对布尔值进行列方向的求和 - - - - 求出每一列空值的个数

三、matplotlib

import numpy as np
import pandas as pd

import matplotlib.pyplot as plt
%matplotlib inline

1.折线图 plt.plot()

python-数据分析-numpy、pandas、matplotlib的常用方法,python,数据分析,jupyter,plotly,matplotlib,numpy,pandas

color 线的颜色
linewidth 线的宽度 像素
linestyle 线的风格

python-数据分析-numpy、pandas、matplotlib的常用方法,python,数据分析,jupyter,plotly,matplotlib,numpy,pandas
dashed 虚线 dashdot 虚线和点 dotted 点

python-数据分析-numpy、pandas、matplotlib的常用方法,python,数据分析,jupyter,plotly,matplotlib,numpy,pandas

# 可以省略,但建议写上,强制将前面的绘图代码渲染出来
plt.show()
x = [1,2,3]
y = [2,4,6]
plt.plot(x,y)

a = [1,3,5]
b = [1,2,3]
plt.plot(a,b)
# 可以省略,但建议写上,强制将前面的绘图代码渲染出来
plt.show()

python-数据分析-numpy、pandas、matplotlib的常用方法,python,数据分析,jupyter,plotly,matplotlib,numpy,pandas

2.柱状图 plt.bar()

条形图的横轴可以是字符串,起标识作用

x = ['A','B','C','D']
y = [13,17,15,14]
# plt.bar(x,y, color=['red','blue'])
plt.bar(x,y,color=np.random.random((4,3)))

python-数据分析-numpy、pandas、matplotlib的常用方法,python,数据分析,jupyter,plotly,matplotlib,numpy,pandas

3.散点图 plt.scatter()

回归问题

# 横轴数据
x = [1.3, 4,5.8,7.4]
# 纵轴数据
y = [20,30,40,50]
# 大小  也可以表达第三维数据
size = np.array([1,4,9,16])
plt.scatter(x,y,s=size*10,c=(1,2,3,4))

python-数据分析-numpy、pandas、matplotlib的常用方法,python,数据分析,jupyter,plotly,matplotlib,numpy,pandas

四、pandas 自带的绘图函数

DataFrame

# 从10到100随机生成一个数据
np.random.randint(10,100)   # 74
# 10行3列
np.random.randint(10,100,size=(10,3))

python-数据分析-numpy、pandas、matplotlib的常用方法,python,数据分析,jupyter,plotly,matplotlib,numpy,pandas

df = pd.DataFrame(data=np.random.randint(10,100, size=(10,3)),columns=['A','B','C'])
df.plot(kind='bar')

kind默认是line
hist 直方图 - - - pie 饼图 - - - box 箱体图 - - - area 面积图
python-数据分析-numpy、pandas、matplotlib的常用方法,python,数据分析,jupyter,plotly,matplotlib,numpy,pandas
T转置操作
python-数据分析-numpy、pandas、matplotlib的常用方法,python,数据分析,jupyter,plotly,matplotlib,numpy,pandas
Series

df = pd.Series(data=np.random.randint(1,10,size=5),index=['A','B','C','D','E'])
df.plot(kind='bar',color='red')

python-数据分析-numpy、pandas、matplotlib的常用方法,python,数据分析,jupyter,plotly,matplotlib,numpy,pandas

1.添加文字说明 标题 坐标轴

np.random.random(3)
# array([0.62461037, 0.88015921, 0.78706271])
# 从0到2π拆分成100个数,等差数列
x = np.linspace(0,2*np.pi, num=100)
y = np.sin(x)
# label 是图例要展示的内容
plt.plot(x,y,color=np.random.random(3),label='line of sin',linestyle='--')
# 允许展示图例 loc参数可选
plt.legend(loc='lower right')
plt.xlabel('X')
plt.ylabel('Y')
plt.title('Y=sinX')

python-数据分析-numpy、pandas、matplotlib的常用方法,python,数据分析,jupyter,plotly,matplotlib,numpy,pandas

plt.plot(x,np.sin(x),label='sin')
plt.plot(x,np.cos(x),label='cos')
plt.legend(loc='upper right')

python-数据分析-numpy、pandas、matplotlib的常用方法,python,数据分析,jupyter,plotly,matplotlib,numpy,pandas

2.label中文报错解决方法

使用matplotlib画图,默认不支持中文显示

plt.rcParams		# 可以查看一些默认属性
plt.rcParams['font.sans-serif']='SimHei'	# 用来正常显示中文标签
plt.rcParams['axes.unicode_minus']=False	# 解决符号'-'显示为方框的问题

plt.plot(x,np.sin(x),label='正弦函数')
plt.plot(x,np.cos(x),label='余弦函数')
plt.legend(loc='upper right')
plt.title('函数')

python-数据分析-numpy、pandas、matplotlib的常用方法,python,数据分析,jupyter,plotly,matplotlib,numpy,pandas

五、绘制多个图表 subplot()

三个参数

plt.subplot(221) 两行两列第一个

# 调整图表大小
plt.figure(figsize=(12,8))

ax1 = plt.subplot(221)
ax1.plot(x,np.sin(x))

ax2 = plt.subplot(222)
ax2.plot(x,np.cos(x))

ax3 = plt.subplot(223)
ax3.bar(['a','b','c'],[1,2,3])

ax4 = plt.subplot(224)
# ax4.pie(sizes=[30,40,30],labels=['A','B','C'],colors=['red','blue','yellow'])
ax4.pie(np.array([10, 20, 30, 40]))

plt.show()

python-数据分析-numpy、pandas、matplotlib的常用方法,python,数据分析,jupyter,plotly,matplotlib,numpy,pandas文章来源地址https://www.toymoban.com/news/detail-693765.html

到了这里,关于python-数据分析-numpy、pandas、matplotlib的常用方法的文章就介绍完了。如果您还想了解更多内容,请在右上角搜索TOY模板网以前的文章或继续浏览下面的相关文章,希望大家以后多多支持TOY模板网!

本文来自互联网用户投稿,该文观点仅代表作者本人,不代表本站立场。本站仅提供信息存储空间服务,不拥有所有权,不承担相关法律责任。如若转载,请注明出处: 如若内容造成侵权/违法违规/事实不符,请点击违法举报进行投诉反馈,一经查实,立即删除!

领支付宝红包 赞助服务器费用

相关文章

  • 【数据分析】matplotlib、numpy、pandas速通

    教程链接:【python教程】数据分析——numpy、pandas、matplotlib 资料:https://github.com/TheisTrue/DataAnalysis 官网链接:可查询各种图的使用及代码 对比常用统计图 (1)引入 (2) 示例 (3) 设置图片大小 figsize: 图片的 (长, 宽) dpi: 每英寸像素点的个数,例如选定为 80 (图像模糊

    2024年01月24日
    浏览(27)
  • 郭炜老师mooc第十一章数据分析和展示(numpy,pandas, matplotlib)

    numpy创建数组的常用函数  numpy数组常用属性和函数  numpy数组元素的增删 在numpy数组中查找元素  np.argwhere( a ):返回非0的数组元组的索引,其中a是要索引数组的条件。 np.where(condition) 当where内只有一个参数时,那个参数表示条件,当条件成立时,           where返回的是每个

    2024年03月15日
    浏览(68)
  • 数据分析 — Matplotlib 、Pandas、Seaborn 绘图

    Matplotlib 是一个用于 绘制数据可视化图形的 Python 库 。它提供了丰富的绘图工具,可以用于创建各种类型的图表。 安装和导入: pip install matplotlib import matplotlib.pyplot as plt # 导入 Matplotlib 库 图表适用场景总结: 1、折线图:表示数据的趋势情况,如几年每个月份的销量走势、

    2024年02月19日
    浏览(28)
  • 【100天精通Python】Day55:Python 数据分析_Pandas数据选取和常用操作

    目录 Pandas数据选择和操作 1 选择列和行 2 过滤数据 3 添加、删除和修改数据

    2024年02月09日
    浏览(46)
  • NumPy 和 Pandas 数据分析实用指南:1~6 全

    原文:Hands-On Data Analysis with NumPy and pandas 协议:CC BY-NC-SA 4.0 译者:飞龙 在本章中,我们将介绍以下主题: 安装 Anaconda 探索 Jupyter 笔记本 探索 Jupyter 的替代品 管理 Anaconda 包 配置数据库 在本章中,我们将讨论如何安装和管理 Anaconda。 Anaconda 是一个包,我们将在本书的以下各

    2023年04月14日
    浏览(61)
  • NumPy和Pandas库的基本用法,用于数据处理和分析

    当涉及到数据处理和分析时,NumPy和Pandas是两个非常常用的Python库。下面是它们的基本用法: NumPy(Numerical Python): 导入NumPy库:在代码中使用import numpy as np导入NumPy库。 创建NumPy数组:使用np.array()函数可以创建一个NumPy数组。例如,arr = np.array([1, 2, 3, 4, 5])创建一个包含整数

    2024年02月11日
    浏览(26)
  • 【Python数据分析】数据分析之numpy基础

    实验环境:建立在Python3的基础之上 numpy提供了一种数据类型,提供了数据分析的运算基础,安装方式 导入numpy到python项目 本文以案例的方式展示numpy的基本语法,没有介绍语法的细枝末节,笔者认为通过查阅案例就能掌握基本用法。 numpy数组的基本概念 numpy默认所有元素具有

    2024年02月10日
    浏览(28)
  • [数据分析大全]基于Python的数据分析大全——Numpy基础

    NumPy 的全称为 Numeric Python,它是 Python 的第三方扩展包,主要用来计算、处理一维或多维数组。   步入8月了,7月时因为项目所需,自学了 深度学习 相关的内容,现在 已经把项目所需要的神经网络框架搭建起来了,输入输出也都归一化了,模拟误差也加上了,图像的参数

    2024年02月14日
    浏览(38)
  • Python 数据分析——matplotlib 快速绘图

    matplotlib采用面向对象的技术来实现,因此组成图表的各个元素都是对象,在编写较大的应用程序时通过面向对象的方式使用matplotlib将更加有效。但是使用这种面向对象的调用接口进行绘图比较烦琐,因此matplotlib还提供了快速绘图的pyplot模块。本节首先介绍该模块的使用方法

    2024年02月11日
    浏览(29)
  • python-数据分析-pandas

    第一种:通过标量创建Series 第二种:通过列表创建Series 第三种:通过字典创建Series 第四种:通过ndarray创建Series values和index 索引和切片 第一种:通过一维列表构成的字典创建DataFrame 姓名 数学 语文 计算机 0 张三 87 54 34 1 李四 45 76 56 2 王五 34 55 77 3 赵六 98 90 87 姓名 数学 语文

    2023年04月23日
    浏览(42)

觉得文章有用就打赏一下文章作者

支付宝扫一扫打赏

博客赞助

微信扫一扫打赏

请作者喝杯咖啡吧~博客赞助

支付宝扫一扫领取红包,优惠每天领

二维码1

领取红包

二维码2

领红包