时序预测 | MATLAB实现基于QPSO-BiGRU、PSO-BiGRU、BiGRU时间序列预测
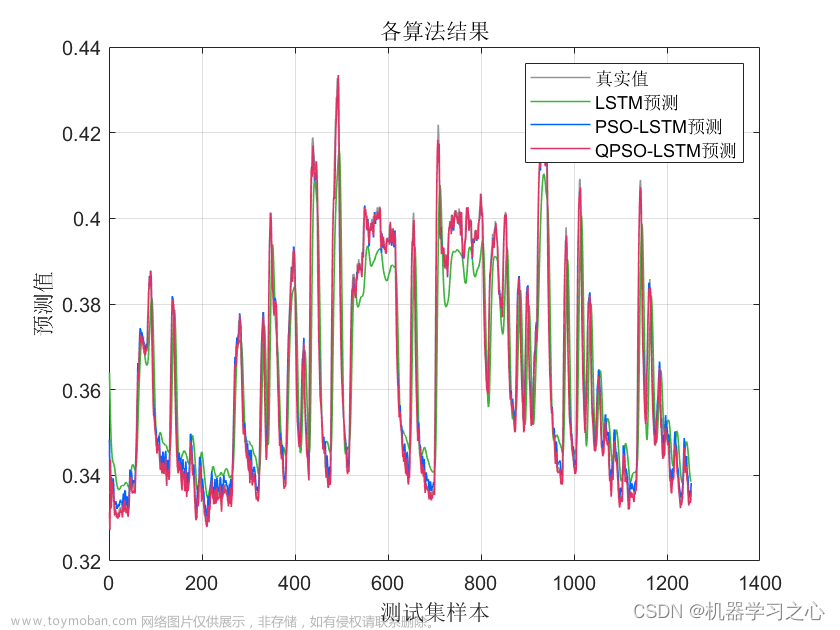
效果一览


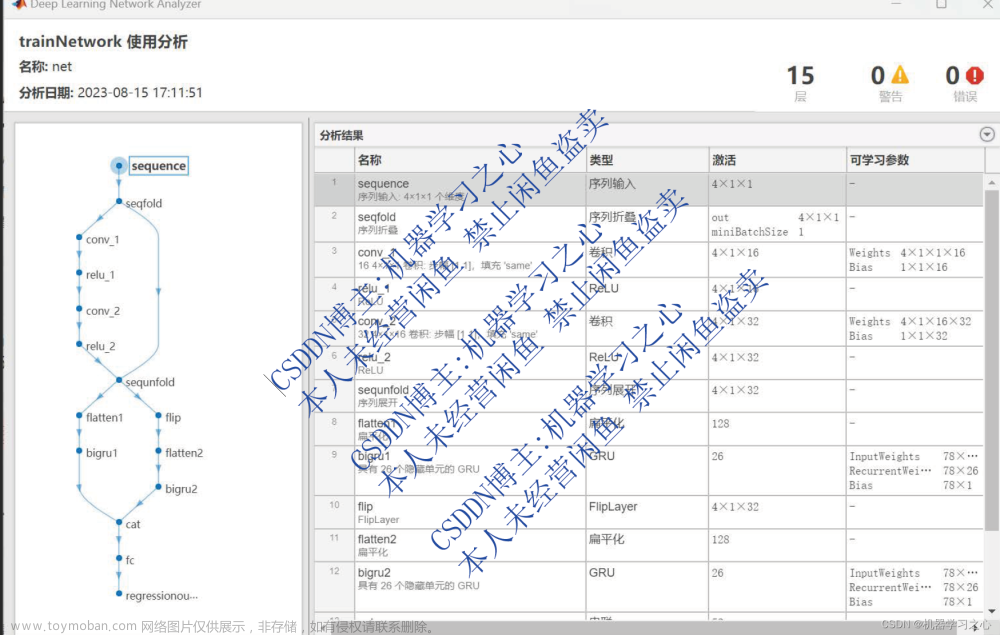
基本描述
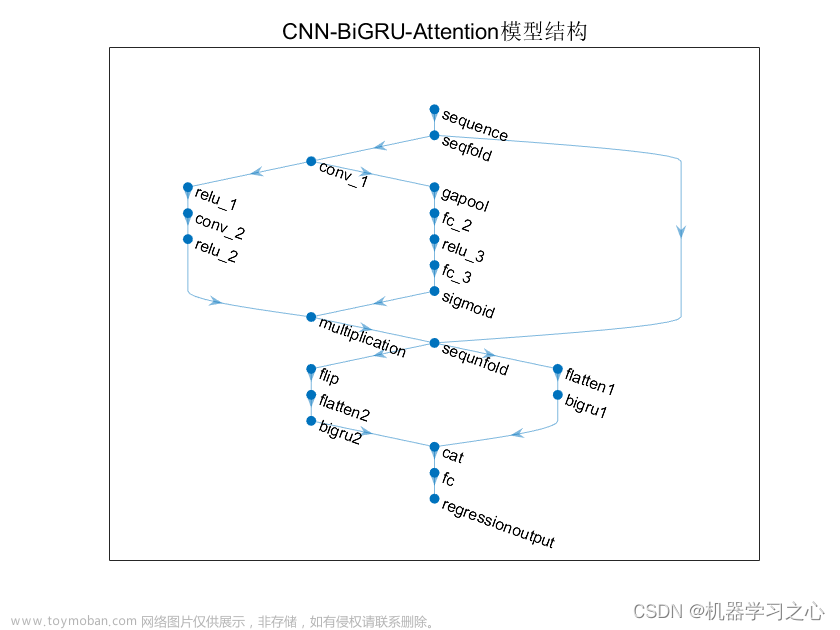
1.时序预测 | MATLAB实现基于QPSO-BiGRU、PSO-BiGRU、BiGRU时间序列预测;
2.单变量时间序列数据集;
3.运行环境Matlab2020及以上,依次运行Main1GRUTS、Main2PSOBiGRUTS、Main3QPSOBiGRUTS、Main4CDM即可,其余为函数文件无需运行,所有程序放在一个文件夹,data为数据集,单变量时间序列;
BiGRU(双向门控循环单元模型)与粒子群算法优化后的BiGRU(PSOBiGRU)以及量子粒子群算法优化后的BiGRU(QPSOBiGRU)对比实验,可用于风电、光伏等负荷预测,时序预测,数据为单变量时间序列数据集,PSO、QPSO优化超参数为隐含层1节点数、隐含层2节点数、最大迭代次数和学习率。
4.命令窗口输出MAE、MAPE、RMSE和R2;文章来源:https://www.toymoban.com/news/detail-694384.html
程序设计
- 完整程序和数据下载:私信博主回复MATLAB实现基于QPSO-BiGRU、PSO-BiGRU、BiGRU时间序列预测。
Function_name='F1'; % Name of the test function that can be from F1 to F23 (Table 1,2,3 in the paper) 设定适应度函数
[lb,ub,dim,fobj]=Get_Functions_details(Function_name);  %设定边界以及优化函数

N=20;
M=1000;
[xm1,trace1]=pso(N,M,dim,lb,ub,fobj);
[xm2,trace2]=qpso(N,M,dim,lb,ub,fobj);

figure('Position',[269   240   660   290])
%Draw search space
subplot(1,2,1);
func_plot(Function_name);
title('Parameter space')
xlabel('x_1');
ylabel('x_2');
zlabel([Function_name,'( x_1 , x_2 )'])

%Draw objective space
subplot(1,2,2);
plot(trace1,'Color','b','linewidth',1.5)
hold on
plot(trace2,'Color','r','linewidth',1.5)
title('Objective space')
xlabel('Iteration');
ylabel('Best score obtained so far');

axis tight
grid on
box on
legend('PSO','QPSO')

%% 取对数 更方便看
figure
plot(log10(trace1),'linewidth',1.5)
hold on
plot(log10(trace2),'linewidth',1.5)
legend('PSO','QPSO')
title('PSO VS QPSO')
xlabel('iteration/M')
ylabel('fitness value(log10)')
function func_plot(func_name)

[lb,ub,dim,fobj]=Get_Functions_details(func_name);

switch func_name
    case 'F1'
        x=-100:2:100; y=x; %[-100,100]

    case 'F2'
        x=-100:2:100; y=x; %[-10,10]

    case 'F3'
        x=-100:2:100; y=x; %[-100,100]

    case 'F4'
        x=-100:2:100; y=x; %[-100,100]
    case 'F5'
        x=-200:2:200; y=x; %[-5,5]
    case 'F6'
        x=-100:2:100; y=x; %[-100,100]
    case 'F7'
        x=-1:0.03:1;  y=x  %[-1,1]
    case 'F8'
        x=-500:10:500;y=x; %[-500,500]
    case 'F9'
        x=-5:0.1:5;   y=x; %[-5,5]
    case 'F10'
        x=-20:0.5:20; y=x;%[-500,500]
    case 'F11'
        x=-500:10:500; y=x;%[-0.5,0.5]
    case 'F12'
        x=-10:0.1:10; y=x;%[-pi,pi]
    case 'F13'
        x=-5:0.08:5; y=x;%[-3,1]
    case 'F14'
        x=-100:2:100; y=x;%[-100,100]
    case 'F15'
        x=-5:0.1:5; y=x;%[-5,5]
    case 'F16'
        x=-1:0.01:1; y=x;%[-5,5]
    case 'F17'
        x=-5:0.1:5; y=x;%[-5,5]
    case 'F18'
        x=-5:0.06:5; y=x;%[-5,5]
    case 'F19'
        x=-5:0.1:5; y=x;%[-5,5]
    case 'F20'
        x=-5:0.1:5; y=x;%[-5,5]
    case 'F21'
        x=-5:0.1:5; y=x;%[-5,5]
    case 'F22'
        x=-5:0.1:5; y=x;%[-5,5]
    case 'F23'
        x=-5:0.1:5; y=x;%[-5,5]
end


L=length(x);
f=[];

for i=1:L
    for j=1:L
        if strcmp(func_name,'F15')==0 && strcmp(func_name,'F19')==0 && strcmp(func_name,'F20')==0 && strcmp(func_name,'F21')==0 && strcmp(func_name,'F22')==0 && strcmp(func_name,'F23')==0
            f(i,j)=fobj([x(i),y(j)]);
        end
        if strcmp(func_name,'F15')==1
            f(i,j)=fobj([x(i),y(j),0,0]);
        end
        if strcmp(func_name,'F19')==1
            f(i,j)=fobj([x(i),y(j),0]);
        end
        if strcmp(func_name,'F20')==1
            f(i,j)=fobj([x(i),y(j),0,0,0,0]);
        end
        if strcmp(func_name,'F21')==1 || strcmp(func_name,'F22')==1 ||strcmp(func_name,'F23')==1
            f(i,j)=fobj([x(i),y(j),0,0]);
        end
    end
end
参考资料
[1] https://blog.csdn.net/kjm13182345320/article/details/127596777?spm=1001.2014.3001.5501
[2] https://download.csdn.net/download/kjm13182345320/86830096?spm=1001.2014.3001.5501文章来源地址https://www.toymoban.com/news/detail-694384.html
到了这里,关于时序预测 | MATLAB实现基于QPSO-BiGRU、PSO-BiGRU、BiGRU时间序列预测的文章就介绍完了。如果您还想了解更多内容,请在右上角搜索TOY模板网以前的文章或继续浏览下面的相关文章,希望大家以后多多支持TOY模板网!


