前言
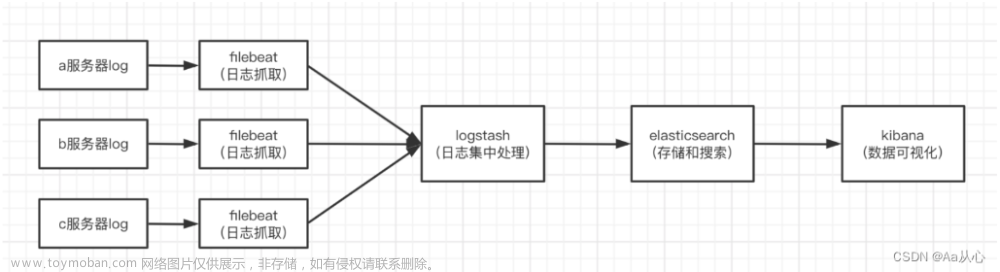
当今数字化时代,信息的快速增长使得各类组织和企业面临着海量数据的处理和分析挑战。在这样的背景下,ELK Stack(Elasticsearch、Logstash 和 Kibana)作为一套强大的开源工具组合,成为了解决数据管理、搜索和可视化的首选方案。无论是监控日志、实时数据分析,还是构建仪表盘来监测业务指标,ELK Stack 都提供了一站式的解决方案。
ELK Stack 的每个组件都扮演着关键的角色:
- Elasticsearch: 作为分布式搜索和分析引擎,Elasticsearch 可以高效地存储、搜索和分析海量数据。其强大的全文搜索能力和分布式架构使得在海量数据中快速定位所需信息成为可能。
- Logstash: 这是一个用于数据收集、转换和传输的数据处理引擎。它能够从各种数据源中采集数据,经过处理后发送到 Elasticsearch 或其他目标。无论是日志、事件数据还是指标,Logstash 可以将数据标准化,并将其准确地传送到适当的位置。
- Kibana: 作为 ELK Stack 的可视化工具,Kibana 提供了直观友好的用户界面,让用户能够通过创建仪表盘、图表和可视化来探索、分析和展示数据。这使得即便对数据分析没有深入专业知识的人员,也能够从数据中提取有价值的见解。
在本文档中,我们将深入探讨如何安装、配置和使用 ELK Stack。
系统环境如下
- 系统:ubuntu20.04 LTS
- 硬件:8核12G 500G
安装JAVA
sudo apt-get update#安装对应系统版本JDK,使用java --version查看相应jdk安装版本
apt install openjdk-16-jre-headless添加ELK存储库
wget -qO - https://artifacts.elastic.co/GPG-KEY-elasticsearch | sudo apt-key add -
sh -c 'echo "deb https://artifacts.elastic.co/packages/8.x/apt stable main" > /etc/apt/sources.list.d/elastic-8.x.list'
更新软件源
apt-get update安装Elasticsearch
apt-get install elasticsearch安装完成加入开机启动并重启
sudo systemctl daemon-reload
systemctl enable elasticsearch.service && systemctl start elasticsearch.service
为elasticsearch生成密码作为登录使用,用户名是elastic,密码会在屏幕随机生成。
cd /usr/share/elasticsearch && bin/elasticsearch-reset-password -u elastic注意备份elasticsearch原始文件,以防丢失想要恢复无法恢复。
cp /etc/elasticsearch/elasticsearch.yml /etc/elasticsearch/elasticsearch.yml.bak生成Enrollment token,第一次登录时候需要验证。
cd /usr/share/elasticsearch && bin/elasticsearch-create-enrollment-token --scope kibana安装Kibana
apt install kibana
systemctl enable kibana.service && systemctl start kibana.service
systemctl stop kibana.service && systemctl start kibana.service
生成Enrollment token后所需要的验证码
cd /usr/share/kibana/ && bin/kibana-verification-code注意ELK中所说的L是指Logstash,本文以安装filebeat为收集工具。
Logstash 和 Filebeat 都是用于数据收集和传输的工具,但它们在功能和使用方面有一些区别。以下是它们之间的主要区别:
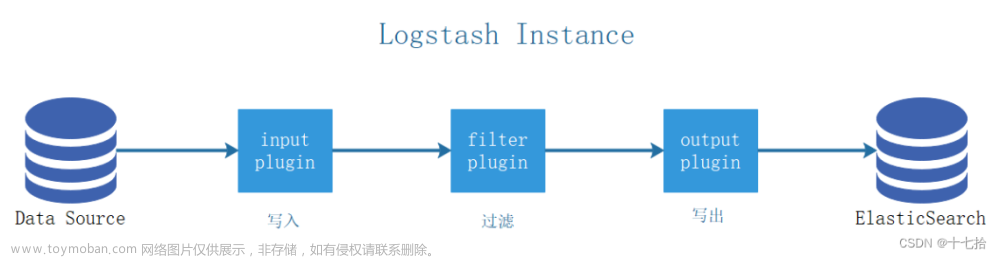
Logstash:
Logstash 是一个功能强大的数据收集、转换和传输引擎。它的主要功能是将不同来源的数据(如日志、事件、指标等)收集起来,进行过滤、解析、转换,然后将处理后的数据发送到指定的目标,如 Elasticsearch、其他存储系统或分析工具。Logstash 的主要特点包括:
- 数据处理能力: Logstash 提供了丰富的插件,能够对数据进行多种处理,如解析、过滤、标准化等,以确保数据在传输之前得到适当的处理。
- 多样的数据源: Logstash 可以从多种数据源中采集数据,包括日志文件、网络流量、消息队列等,使得它在处理各种数据类型和格式时非常有用。
- 数据传输: Logstash 可以将处理后的数据发送到多种目标,如 Elasticsearch、文件、消息队列等,以满足不同的数据存储和分析需求。
- 灵活性: Logstash 的配置非常灵活,您可以通过配置文件定义数据流的各个阶段,从而实现高度定制化的数据处理流程。
Filebeat:
Filebeat 是一个轻量级的日志数据传输工具,专门用于从文件系统中收集日志数据并将其传输到中央存储或分析系统。它的主要特点包括:
- 轻量级: Filebeat 被设计为轻量级工具,占用资源较少,适用于部署在资源有限的环境中。
- 实时性: Filebeat 可以实时监测日志文件的变化,一旦日志发生更新,它会立即传输变更的部分,确保实时性。
- 简化的数据处理: Filebeat 的主要功能是将日志数据收集并传输,而数据处理方面的功能较弱。它不像 Logstash 那样能进行复杂的数据解析和处理。
- 易于部署: 由于 Filebeat 轻量级的特点,它适用于分布式部署和轻松扩展。
总之,Logstash 更适合需要对数据进行复杂处理和转换的场景,而 Filebeat 则适用于轻量级、实时的日志传输需求。在实际应用中,可以根据具体需求选择使用 Logstash、Filebeat,或两者的结合,以构建适合的数据收集和传输方案。
安装filebeat采集工具
curl -L -O https://artifacts.elastic.co/downloads/beats/filebeat/filebeat-8.9.0-amd64.deb
dpkg -i filebeat-8.9.0-amd64.deb
systemctl start filebeat && systemctl enable filebeat
安装完检查对应软件status是否正常,接下来开始配置
elasticsearch配置
vi /etc/elasticsearch/elasticsearch.yml这里主要主机端口号
network.host: 127.0.0.1
http.port: 9200
全部配置如下,仅供参考。
# ======================== Elasticsearch Configuration =========================
#
# NOTE: Elasticsearch comes with reasonable defaults for most settings.
#       Before you set out to tweak and tune the configuration, make sure you
#       understand what are you trying to accomplish and the consequences.
#
# The primary way of configuring a node is via this file. This template lists
# the most important settings you may want to configure for a production cluster.
#
# Please consult the documentation for further information on configuration options:
# https://www.elastic.co/guide/en/elasticsearch/reference/index.html
#
# ---------------------------------- Cluster -----------------------------------
#
# Use a descriptive name for your cluster:
#
#cluster.name: my-application
#
# ------------------------------------ Node ------------------------------------
#
# Use a descriptive name for the node:
#
#node.name: node-1
#
# Add custom attributes to the node:
#
#node.attr.rack: r1
#
# ----------------------------------- Paths ------------------------------------
#
# Path to directory where to store the data (separate multiple locations by comma):
#
path.data: /var/lib/elasticsearch
#
# Path to log files:
#
path.logs: /var/log/elasticsearch
#
# ----------------------------------- Memory -----------------------------------
#
# Lock the memory on startup:
#
#bootstrap.memory_lock: true
#
# Make sure that the heap size is set to about half the memory available
# on the system and that the owner of the process is allowed to use this
# limit.
#
# Elasticsearch performs poorly when the system is swapping the memory.
#
# ---------------------------------- Network -----------------------------------
#
# By default Elasticsearch is only accessible on localhost. Set a different
# address here to expose this node on the network:
#
#network.host: 192.168.0.1
#
# By default Elasticsearch listens for HTTP traffic on the first free port it
# finds starting at 9200. Set a specific HTTP port here:
#
#http.port: 9200
network.host: 127.0.0.1
http.port: 9200
#
# For more information, consult the network module documentation.
#
# --------------------------------- Discovery ----------------------------------
#
# Pass an initial list of hosts to perform discovery when this node is started:
# The default list of hosts is ["127.0.0.1", "[::1]"]
#
#discovery.seed_hosts: ["host1", "host2"]
#
# Bootstrap the cluster using an initial set of master-eligible nodes:
#
#cluster.initial_master_nodes: ["node-1", "node-2"]
#
# For more information, consult the discovery and cluster formation module documentation.
#
# ---------------------------------- Various -----------------------------------
#
# Allow wildcard deletion of indices:
#
#action.destructive_requires_name: false

#----------------------- BEGIN SECURITY AUTO CONFIGURATION -----------------------
#
# The following settings, TLS certificates, and keys have been automatically
# generated to configure Elasticsearch security features on 09-08-2023 02:38:11
#
# --------------------------------------------------------------------------------

# Enable security features
xpack.security.enabled: true

xpack.security.enrollment.enabled: true

# Enable encryption for HTTP API client connections, such as Kibana, Logstash, and Agents
xpack.security.http.ssl:
  enabled: true
  keystore.path: certs/http.p12

# Enable encryption and mutual authentication between cluster nodes
xpack.security.transport.ssl:
  enabled: true
  verification_mode: certificate
  keystore.path: certs/transport.p12
  truststore.path: certs/transport.p12
# Create a new cluster with the current node only
# Additional nodes can still join the cluster later
cluster.initial_master_nodes: ["ubuntu"]

# Allow HTTP API connections from anywhere
# Connections are encrypted and require user authentication
http.host: 0.0.0.0
#logger.org.elasticsearch: "ERROR"

# Allow other nodes to join the cluster from anywhere
# Connections are encrypted and mutually authenticated
#transport.host: 0.0.0.0

#----------------------- END SECURITY AUTO CONFIGURATION -------------------------
kibana配置
# For more configuration options see the configuration guide for Kibana in
# https://www.elastic.co/guide/index.html

# =================== System: Kibana Server ===================
# Kibana is served by a back end server. This setting specifies the port to use.
#server.port: 5601

# Specifies the address to which the Kibana server will bind. IP addresses and host names are both valid values.
# The default is 'localhost', which usually means remote machines will not be able to connect.
# To allow connections from remote users, set this parameter to a non-loopback address.
server.host: "123.58.97.169"

# Enables you to specify a path to mount Kibana at if you are running behind a proxy.
# Use the `server.rewriteBasePath` setting to tell Kibana if it should remove the basePath
# from requests it receives, and to prevent a deprecation warning at startup.
# This setting cannot end in a slash.
#server.basePath: ""

# Specifies whether Kibana should rewrite requests that are prefixed with
# `server.basePath` or require that they are rewritten by your reverse proxy.
# Defaults to `false`.
#server.rewriteBasePath: false

# Specifies the public URL at which Kibana is available for end users. If
# `server.basePath` is configured this URL should end with the same basePath.
#server.publicBaseUrl: ""

# The maximum payload size in bytes for incoming server requests.
#server.maxPayload: 1048576

# The Kibana server's name. This is used for display purposes.
#server.name: "your-hostname"

# =================== System: Kibana Server (Optional) ===================
# Enables SSL and paths to the PEM-format SSL certificate and SSL key files, respectively.
# These settings enable SSL for outgoing requests from the Kibana server to the browser.
#server.ssl.enabled: false
#server.ssl.certificate: /path/to/your/server.crt
#server.ssl.key: /path/to/your/server.key

# =================== System: Elasticsearch ===================
# The URLs of the Elasticsearch instances to use for all your queries.
#elasticsearch.hosts: ["http://localhost:9200"]

# If your Elasticsearch is protected with basic authentication, these settings provide
# the username and password that the Kibana server uses to perform maintenance on the Kibana
# index at startup. Your Kibana users still need to authenticate with Elasticsearch, which
# is proxied through the Kibana server.
#elasticsearch.username: "kibana_system"
#elasticsearch.password: "pass"

# Kibana can also authenticate to Elasticsearch via "service account tokens".
# Service account tokens are Bearer style tokens that replace the traditional username/password based configuration.
# Use this token instead of a username/password.
# elasticsearch.serviceAccountToken: "my_token"

# Time in milliseconds to wait for Elasticsearch to respond to pings. Defaults to the value of
# the elasticsearch.requestTimeout setting.
#elasticsearch.pingTimeout: 1500

# Time in milliseconds to wait for responses from the back end or Elasticsearch. This value
# must be a positive integer.
#elasticsearch.requestTimeout: 30000

# The maximum number of sockets that can be used for communications with elasticsearch.
# Defaults to `Infinity`.
#elasticsearch.maxSockets: 1024

# Specifies whether Kibana should use compression for communications with elasticsearch
# Defaults to `false`.
#elasticsearch.compression: false

# List of Kibana client-side headers to send to Elasticsearch. To send *no* client-side
# headers, set this value to [] (an empty list).
#elasticsearch.requestHeadersWhitelist: [ authorization ]

# Header names and values that are sent to Elasticsearch. Any custom headers cannot be overwritten
# by client-side headers, regardless of the elasticsearch.requestHeadersWhitelist configuration.
#elasticsearch.customHeaders: {}

# Time in milliseconds for Elasticsearch to wait for responses from shards. Set to 0 to disable.
#elasticsearch.shardTimeout: 30000

# =================== System: Elasticsearch (Optional) ===================
# These files are used to verify the identity of Kibana to Elasticsearch and are required when
# xpack.security.http.ssl.client_authentication in Elasticsearch is set to required.
#elasticsearch.ssl.certificate: /path/to/your/client.crt
#elasticsearch.ssl.key: /path/to/your/client.key

# Enables you to specify a path to the PEM file for the certificate
# authority for your Elasticsearch instance.
#elasticsearch.ssl.certificateAuthorities: [ "/path/to/your/CA.pem" ]

# To disregard the validity of SSL certificates, change this setting's value to 'none'.
#elasticsearch.ssl.verificationMode: full

# =================== System: Logging ===================
# Set the value of this setting to off to suppress all logging output, or to debug to log everything. Defaults to 'info'
#logging.root.level: debug

# Enables you to specify a file where Kibana stores log output.
logging:
  appenders:
    file:
      type: file
      fileName: /var/log/kibana/kibana.log
      layout:
        type: json
  root:
    appenders:
      - default
      - file
#  layout:
#    type: json

# Logs queries sent to Elasticsearch.
#logging.loggers:
#  - name: elasticsearch.query
#    level: debug

# Logs http responses.
#logging.loggers:
#  - name: http.server.response
#    level: debug

# Logs system usage information.
#logging.loggers:
#  - name: metrics.ops
#    level: debug

# =================== System: Other ===================
# The path where Kibana stores persistent data not saved in Elasticsearch. Defaults to data
#path.data: data

# Specifies the path where Kibana creates the process ID file.
pid.file: /run/kibana/kibana.pid

# Set the interval in milliseconds to sample system and process performance
# metrics. Minimum is 100ms. Defaults to 5000ms.
#ops.interval: 5000

# Specifies locale to be used for all localizable strings, dates and number formats.
# Supported languages are the following: English (default) "en", Chinese "zh-CN", Japanese "ja-JP", French "fr-FR".
#i18n.locale: "en"

# =================== Frequently used (Optional)===================

# =================== Saved Objects: Migrations ===================
# Saved object migrations run at startup. If you run into migration-related issues, you might need to adjust these settings.

# The number of documents migrated at a time.
# If Kibana can't start up or upgrade due to an Elasticsearch `circuit_breaking_exception`,
# use a smaller batchSize value to reduce the memory pressure. Defaults to 1000 objects per batch.
#migrations.batchSize: 1000

# The maximum payload size for indexing batches of upgraded saved objects.
# To avoid migrations failing due to a 413 Request Entity Too Large response from Elasticsearch.
# This value should be lower than or equal to your Elasticsearch cluster’s `http.max_content_length`
# configuration option. Default: 100mb
#migrations.maxBatchSizeBytes: 100mb

# The number of times to retry temporary migration failures. Increase the setting
# if migrations fail frequently with a message such as `Unable to complete the [...] step after
# 15 attempts, terminating`. Defaults to 15
#migrations.retryAttempts: 15

# =================== Search Autocomplete ===================
# Time in milliseconds to wait for autocomplete suggestions from Elasticsearch.
# This value must be a whole number greater than zero. Defaults to 1000ms
#unifiedSearch.autocomplete.valueSuggestions.timeout: 1000

# Maximum number of documents loaded by each shard to generate autocomplete suggestions.
# This value must be a whole number greater than zero. Defaults to 100_000
#unifiedSearch.autocomplete.valueSuggestions.terminateAfter: 100000
i18n.locale: "zh-CN"

# This section was automatically generated during setup.
elasticsearch.hosts: ['https://123.58.97.169:9200']
elasticsearch.serviceAccountToken: AAEAAWVsYXN0aWMva2liYW5hL2Vucm9sbC1wcm9jZXNzLXRva2VuLTE2OTE1NDk3NTYyNDE6NE55LU1IdVFRRTY0UkVpUloyZDhQdw
elasticsearch.ssl.certificateAuthorities: [/var/lib/kibana/ca_1691549757740.crt]
xpack.fleet.outputs: [{id: fleet-default-output, name: default, is_default: true, is_default_monitoring: true, type: elasticsearch, hosts: ['https://123.58.97.169:9200'], ca_trusted_fingerprint: 27991095e8dddf17d06a00968bd1b693fc906ea2d52d9f5563134505625791f1}]
常见问题
1、为什么我添加了仪表盘面板不显示?
答:当确保索引配置都正确的同时,不要忘记“sudo filebeat setup”初始化面板。执行初始化即可。
2、安装了filebeat,启用和配置 system 模块后,模块状态点击检查数据 显示“未连接”
答:造成此现象是filebeat的系统配置modules.d/system.yml文件未正确配置文件集,也就是找不到文件路径。配置正确后,systemctl status filebeat 查看运行状态并检查是否有错误日志。
3、为什么在索引管理里删除不了索引?文章来源:https://www.toymoban.com/news/detail-695386.html
答:删除索引需要先暂停数据源服务,例如使用filebeat,需要先systemctl stop filebeat ,随后点击索引管理里的数据流,点击删除数据流即可删除数据流里的索引。文章来源地址https://www.toymoban.com/news/detail-695386.html
到了这里,关于Elasticsearch,Logstash和Kibana安装部署(ELK Stack)的文章就介绍完了。如果您还想了解更多内容,请在右上角搜索TOY模板网以前的文章或继续浏览下面的相关文章,希望大家以后多多支持TOY模板网!
![【图文详解】Docker搭建 ELK Stack (elk) [使用es-logstash-filebeat-kibana]](https://imgs.yssmx.com/Uploads/2024/01/405080-1.png)