一、QCustomPlot介绍
QCustomPlot是一个开源的Qt C++图表库,用于可视化数据。该库提供了多种类型的可定制的图表,包括散点图、线图、柱状图和等高线图等。它还支持自定义绘制,可以创建任意形状和大小的元素,并使其与其他元素交互。QCustomPlot易于集成到现有的Qt应用程序中,支持像鼠标选择、缩放和平移这样的常用图表交互。此外,它还可以生成高质量的图像和PDF输出。QCustomplot的文档详细地介绍了其使用方法和API,对于需要在其应用程序中添加数据可视化功能的开发人员来说,是一个强大而方便的工具。
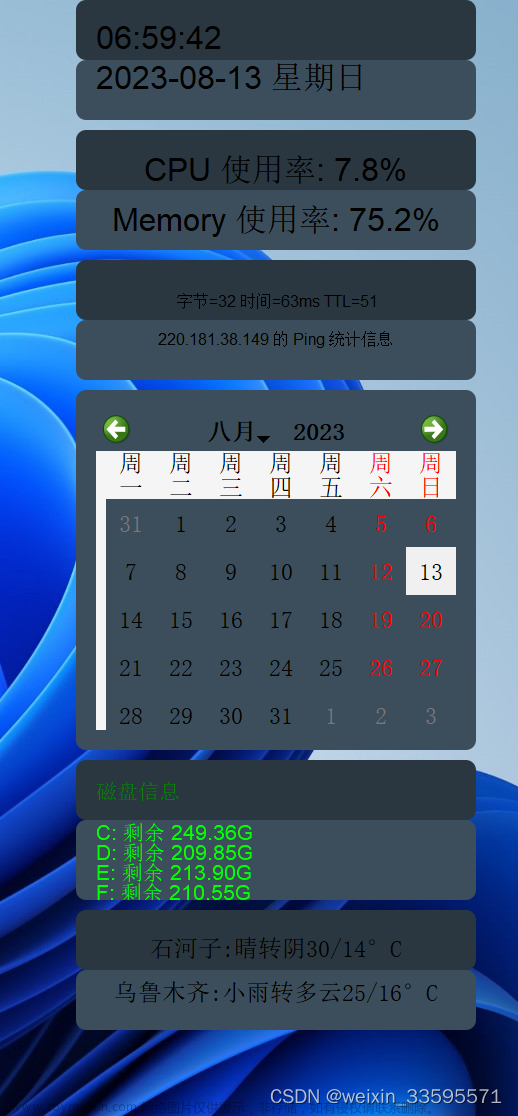
二、界面预览

三、代码实现
1、Qcustomplot下载
您可以从QCustomPlot官网(https://www.qcustomplot.com/index.php/download)下载QCustomPlot。在该网站上,您可以找到最新的稳定版本以及所有历史版本的下载链接。
2、将Qcustomplot添加到你的工程
解压下载的Qcustomplot压缩包,然后将qcustomplot.cpp和qcustomplot.h拷贝到你的工程
然后工程右键->添加现有文件到你的工程中。
3、工程文件修改
打开工程.pro文件,添加printsupport组件支持。
注意:如果你的编译器的版本是6.5,还需要添加QMAKE_CXXFLAGS += -Wa,-mbig-obj,这句,如下
4、代码编写
a、新建类
首先新建一个设计师界面类,然后在设计师界面中放置一个widget,然后提升为QCustomPlot,如下:
四、工程源码
.h文件
#ifndef SYSTEMSTATISTICSWIDGET_H
#define SYSTEMSTATISTICSWIDGET_H

#include <QWidget>
#include <QPixmap>
#include <QTextEdit>
#include <QObject>
#include <QTextObjectInterface>
#include <QPicture>
#include <QVariant>
#include <QPainter>

#include "qcustomplot.h"

namespace Ui {
class SystemStatisticsWidget;
}

class AxisTag : public QObject
{
public:
    explicit AxisTag(QCPAxis *parentAxis):QObject(parentAxis),mAxis(parentAxis)
    {
        mDummyTracer = new QCPItemTracer(mAxis->parentPlot());
        mDummyTracer->setVisible(false);
        mDummyTracer->position->setTypeX(QCPItemPosition::ptAxisRectRatio);
        mDummyTracer->position->setTypeY(QCPItemPosition::ptPlotCoords);
        mDummyTracer->position->setAxisRect(mAxis->axisRect());
        mDummyTracer->position->setAxes(0, mAxis);
        mDummyTracer->position->setCoords(1, 0);

        mArrow = new QCPItemLine(mAxis->parentPlot());
        mArrow->setLayer("overlay");
        mArrow->setClipToAxisRect(false);
        mArrow->setHead(QCPLineEnding::esSpikeArrow);
        mArrow->end->setParentAnchor(mDummyTracer->position);
        mArrow->start->setParentAnchor(mArrow->end);
        mArrow->start->setCoords(15, 0);

        mLabel = new QCPItemText(mAxis->parentPlot());
        mLabel->setLayer("overlay");
        mLabel->setClipToAxisRect(false);
        mLabel->setPadding(QMargins(3, 0, 3, 0));
        mLabel->setBrush(QBrush(Qt::white));
        mLabel->setPen(QPen(Qt::blue));
        mLabel->setPositionAlignment(Qt::AlignLeft|Qt::AlignVCenter);
        mLabel->position->setParentAnchor(mArrow->start);
    }

    virtual ~AxisTag()
    {
        if (mDummyTracer)
            mDummyTracer->parentPlot()->removeItem(mDummyTracer);
        if (mArrow)
            mArrow->parentPlot()->removeItem(mArrow);
        if (mLabel)
            mLabel->parentPlot()->removeItem(mLabel);
    }

    // setters:
    void setPen(const QPen &pen)
    {
        mArrow->setPen(pen);
        mLabel->setPen(pen);
    }
    void setBrush(const QBrush &brush)
    {
        mLabel->setBrush(brush);
    }
    void setText(const QString &text)
    {
        mLabel->setText(text);
    }

    // getters:
    QPen pen() const { return mLabel->pen(); }
    QBrush brush() const { return mLabel->brush(); }
    QString text() const { return mLabel->text(); }

    // other methods:
    void updatePosition(double value)
    {
        mDummyTracer->position->setCoords(1, value);
        mArrow->end->setCoords(mAxis->offset(), 0);
    }


protected:
    QCPAxis *mAxis;
    QPointer<QCPItemTracer> mDummyTracer;
    QPointer<QCPItemLine> mArrow;
    QPointer<QCPItemText> mLabel;
};


class SystemStatisticsWidget : public QWidget
{
    Q_OBJECT

public:
    enum {
        PlotTextFormat = QTextFormat::UserObject + 3902
    };
    enum {
        PicturePropertyId = 1
    };
    explicit SystemStatisticsWidget(QWidget *parent = nullptr);
    ~SystemStatisticsWidget();

    void addData(double cpuUsage,double memoryUsage);
    void popWindow(int x,int y,int width,int height);
protected:
    void showEvent(QShowEvent *event) override;
private:
    void controlInit();
    void setLabelText(double cpuUsage,double memoryUsage);
private slots:
    void btnClickedSlot();
private:
    Ui::SystemStatisticsWidget *ui;

    QPointer<QCPGraph> graphCpu;
    QPointer<QCPGraph> graphMemory;
    AxisTag *tagCpu;
    AxisTag *tagMemory;

    QString filePath;
};


#endif // SYSTEMSTATISTICSWIDGET_H
AxisTag 类是图像右边的那个小标签,用于显示单前值。
.cpp文件:
#include "systemStatisticsWidget.h"
#include "ui_systemStatisticsWidget.h"

SystemStatisticsWidget::SystemStatisticsWidget(QWidget *parent) :
    QWidget(parent),
    ui(new Ui::SystemStatisticsWidget),
    tagCpu(0),
    tagMemory(0)
{
    ui->setupUi(this);
    this->controlInit();
}

SystemStatisticsWidget::~SystemStatisticsWidget()
{
    delete ui;
}

void SystemStatisticsWidget::controlInit()
{
    this->ui->widgetPlot->yAxis->setTickLabels(false);
    connect(this->ui->widgetPlot->yAxis2, SIGNAL(rangeChanged(QCPRange)), this->ui->widgetPlot->yAxis, SLOT(setRange(QCPRange)));


    this->ui->widgetPlot->yAxis2->setVisible(true);
    this->ui->widgetPlot->axisRect()->addAxis(QCPAxis::atRight);
    this->ui->widgetPlot->axisRect()->axis(QCPAxis::atRight, 0)->setPadding(30);
    this->ui->widgetPlot->axisRect()->axis(QCPAxis::atRight, 1)->setPadding(30);


    graphCpu = this->ui->widgetPlot->addGraph(this->ui->widgetPlot->xAxis, this->ui->widgetPlot->axisRect()->axis(QCPAxis::atRight, 0));
    graphMemory = this->ui->widgetPlot->addGraph(this->ui->widgetPlot->xAxis, this->ui->widgetPlot->axisRect()->axis(QCPAxis::atRight, 1));
    graphCpu->setPen(QPen(QColor(250, 120, 0)));
    graphMemory->setPen(QPen(QColor(0, 180, 60)));

    this->graphCpu->setName(tr("CPU使用率"));
    this->graphMemory->setName(tr("内存使用率"));
    this->ui->widgetPlot->legend->setVisible(true);


    tagCpu = new AxisTag(graphCpu->valueAxis());
    tagCpu->setPen(graphCpu->pen());
    tagMemory = new AxisTag(graphMemory->valueAxis());
    tagMemory->setPen(graphMemory->pen());


    connect(this->ui->btnClearData,&QPushButton::clicked,this,&SystemStatisticsWidget::btnClickedSlot);
    connect(this->ui->btnScreenshotAndExport,&QPushButton::clicked,this,&SystemStatisticsWidget::btnClickedSlot);
    connect(this->ui->btnPause,&QPushButton::clicked,this,&SystemStatisticsWidget::btnClickedSlot);
}

void SystemStatisticsWidget::setLabelText(double cpuUsage, double memoryUsage)
{
#define WARNING_VALUE 70
#define ERROR_VALUE 90

    if(cpuUsage > 90)
        this->ui->labelCpuUasge->setStyleSheet("color: rgb(255, 0, 0);font: 700 11pt \"Microsoft YaHei UI\";");
    else if(cpuUsage >= 70)
        this->ui->labelCpuUasge->setStyleSheet("color: rgb(255, 255, 0);font: 700 11pt \"Microsoft YaHei UI\";");
    else
        this->ui->labelCpuUasge->setStyleSheet("color: rgb(255, 255, 255);font: 700 11pt \"Microsoft YaHei UI\";");
    this->ui->labelCpuUasge->setText(QString::number(cpuUsage,'f',2));
    if(memoryUsage > 90)
    {
        this->ui->labelMemoryUsage->setStyleSheet("color: rgb(255, 0, 0);font: 700 11pt \"Microsoft YaHei UI\";");
    }
    else if(memoryUsage >= 70)
    {
        this->ui->labelMemoryUsage->setStyleSheet("color: rgb(255, 255, 0);font: 700 11pt \"Microsoft YaHei UI\";");
    }
    else
    {
        this->ui->labelMemoryUsage->setStyleSheet("color: rgb(255, 255, 255);font: 700 11pt \"Microsoft YaHei UI\";");
    }
    this->ui->labelMemoryUsage->setText(QString::number(cpuUsage,'f',2));
}

void SystemStatisticsWidget::addData(double cpuUsage, double memoryUsage)
{
    if(this->isHidden())
        return;
    if(this->ui->btnPause->isChecked())
        return;

    graphCpu->addData(graphCpu->dataCount(), cpuUsage);
    graphMemory->addData(graphMemory->dataCount(), memoryUsage);

    this->ui->widgetPlot->xAxis->rescale();
    graphCpu->rescaleValueAxis(false, true);
    graphMemory->rescaleValueAxis(false, true);
    this->ui->widgetPlot->xAxis->setRange(this->ui->widgetPlot->xAxis->range().upper, 100, Qt::AlignRight);


    double graphCpuValue = graphCpu->dataMainValue(graphCpu->dataCount()-1);
    double graphMemoryValue = graphMemory->dataMainValue(graphMemory->dataCount()-1);
    tagCpu->updatePosition(graphCpuValue);
    tagMemory->updatePosition(graphMemoryValue);
    tagCpu->setText(QString::number(graphCpuValue, 'f', 2));
    tagMemory->setText(QString::number(graphMemoryValue, 'f', 2));

    this->ui->widgetPlot->replot();

    this->setLabelText(cpuUsage,memoryUsage);
}

void SystemStatisticsWidget::popWindow(int x, int y, int width, int height)
{
    //实例阴影shadow
    QGraphicsDropShadowEffect *shadow = new QGraphicsDropShadowEffect(this->ui->frame);
    shadow->setOffset(0, 0);
    shadow->setColor(QColor(32, 101, 165));
    shadow->setBlurRadius(10);
    this->ui->frame->setGraphicsEffect(shadow);

    this->ui->frame->setStyleSheet("QFrame#frame{border:1px groove gray;"
                                   "border-radius:10px;padding:5px;"
                                   "background-color: rgb(255, 255, 255);}");


    this->setWindowFlags(Qt::FramelessWindowHint | Qt::WindowStaysOnTopHint);
    this->setAttribute(Qt::WA_TranslucentBackground, true);

    //计算显示位置
#define DIST_TO_MOUISE 10
    int screenWidth = QGuiApplication::screenAt(QCursor().pos())->geometry().width();
    int screenHeight = QGuiApplication::screenAt(QCursor().pos())->geometry().height();

    int showX,showY;

    if(x + width + DIST_TO_MOUISE > screenWidth)
        showX = x-width-DIST_TO_MOUISE;
    else
        showX = x + DIST_TO_MOUISE;
    if(y + height + DIST_TO_MOUISE > screenHeight)
        showY = y - height - DIST_TO_MOUISE;
    else
        showY = y + DIST_TO_MOUISE;

    this->setGeometry(showX,showY,width,height);

    this->show();
}

void SystemStatisticsWidget::showEvent(QShowEvent *event)
{
    Q_UNUSED(event);
    this->graphCpu->data().data()->clear();
    this->graphMemory->data().data()->clear();
}

void SystemStatisticsWidget::btnClickedSlot()
{
    QPushButton *btn = static_cast<QPushButton *>(sender());

    if( btn == this->ui->btnClearData)
    {
        this->graphCpu->data().data()->clear();
        this->graphMemory->data().data()->clear();
        this->ui->widgetPlot->replot();
    }
    else if(btn == this->ui->btnScreenshotAndExport)
    {
//        if(this->filePath.isEmpty())
//        {
//            this->filePath = QFileDialog::getSaveFileName(this, "Save document...", qApp->applicationDirPath(), "*.pdf");
//        }
//        if(this->filePath.isEmpty())
//            return;
        QScreen *screen = QGuiApplication::primaryScreen();

        int x = this->ui->widgetPlot->mapToGlobal(QPoint(0,0)).x();
        int y = this->ui->widgetPlot->mapToGlobal(QPoint(0,0)).y();

        QPixmap pixmapGrab = screen->grabWindow(0,x,y,this->ui->widgetPlot->width(),this->ui->widgetPlot->height());
        QString fileName = QDateTime::currentDateTime().toString("yyyy.MM.dd.hh.mm.ss")+".png";
        pixmapGrab.save(fileName);
//        // 打印和绘图对象
//        QPrinter printer;
//        QPainter painter;
//        printer.setOutputFormat(QPrinter::PdfFormat);
//        printer.setOutputFileName(this->filePath);
//        QMargins pageMargins(20, 20, 20, 20);
//        QPageLayout pageLayout;
//        pageLayout.setMode(QPageLayout::StandardMode);
//        pageLayout.setOrientation(QPageLayout::Portrait);
//        pageLayout.setPageSize(QPageSize(QPageSize::A4));
//        pageLayout.setUnits(QPageLayout::Millimeter);
//        pageLayout.setMargins(QMarginsF(pageMargins));
//        printer.setPageLayout(pageLayout);

//        // QPrinter 和 QPainter关联
//        painter.begin(&printer);
//        painter.setFont(QFont("微软雅黑", 20));

//        // 尺寸根据pdf的页面宽度缩放
//        if(pixmapGrab.width() > printer.width())
//        {
//            pixmapGrab = pixmapGrab.scaledToWidth(printer.width(), Qt::TransformationMode::SmoothTransformation);
//        }
//        // 生成新的一页并绘制上去
//        //printer.newPage();
//        painter.drawPixmap(0, 0, pixmapGrab.width(), pixmapGrab.height(), pixmapGrab);

//        QString str = "\n"+QDateTime::currentDateTime().toString("yyyy-MM-dd hh:mm:ss");
//        QRect textRect(0,pixmapGrab.height(),printer.width(),20);
//        painter.drawText(textRect, Qt::AlignCenter, str);
//        // 关闭绘制
//        painter.end();
    }
    else if(btn == this->ui->btnPause)
    {

    }
}
五、测试代码编写
1、首先在mainwindow.h中定义一个界面和定时器
    SystemStatisticsWidget *systemStatisticsWidget;
    QTimer mDataTimer;
 文章来源:https://www.toymoban.com/news/detail-700463.html
2、在mainwindow.cpp中实例化和连接槽,并且定时添加数据
#include "mainwindow.h"
#include "ui_mainwindow.h"

MainWindow::MainWindow(QWidget *parent)
    : QMainWindow(parent)
    , ui(new Ui::MainWindow)
    ,systemStatisticsWidget(new SystemStatisticsWidget())
{
    ui->setupUi(this);

    connect(&mDataTimer, SIGNAL(timeout()), this, SLOT(timeroutSlot()));
    mDataTimer.start(40);

    this->ui->btnPopwindow->installEventFilter(this);
}

MainWindow::~MainWindow()
{
    delete ui;
}


void MainWindow::on_btnShow_clicked()
{
    this->systemStatisticsWidget->show();
}

void MainWindow::timeroutSlot()
{
    if(!systemStatisticsWidget->isHidden())
    {
        static uint64_t dataPoint = 0;
        dataPoint++;
        double cpu = qSin(dataPoint/50.0)+qSin(dataPoint/50.0/0.3843)*0.25;
        double memory = qCos(dataPoint/50.0)+qSin(dataPoint/50.0/0.4364)*0.15;
        this->systemStatisticsWidget->addData(cpu,memory);
    }
}

bool MainWindow::eventFilter(QObject *obj, QEvent *event)
{
    if(obj == this->ui->btnPopwindow)
    {
        if(event->type() == QEvent::Enter)
        {
           // auto evt = dynamic_cast<QEnterEvent *>(event);
          //  systemStatisticsWidget->popWindow(evt->globalPosition().x(),evt->globalPosition().y(),500,400);

        }
        else if(event->type() == QEvent::Leave)
        {
           // systemStatisticsWidget->close();
        }
    }
    return QMainWindow::eventFilter(obj,event);
}
六、完整工程下载
点击链接下载
构建版本 文章来源地址https://www.toymoban.com/news/detail-700463.html
到了这里,关于qt使用QCustomplot绘制cpu和内存使用率图的文章就介绍完了。如果您还想了解更多内容,请在右上角搜索TOY模板网以前的文章或继续浏览下面的相关文章,希望大家以后多多支持TOY模板网!