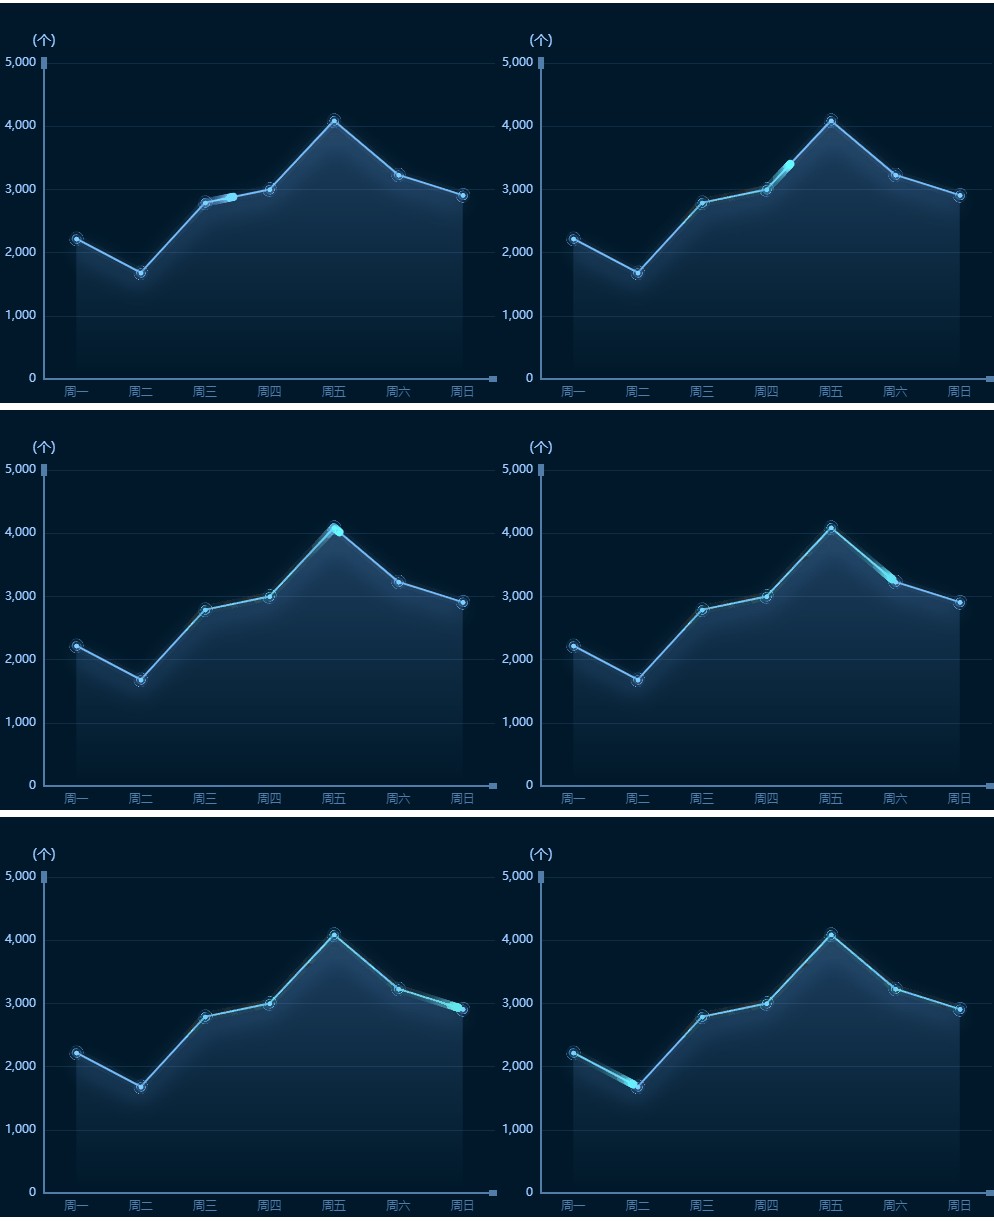
Echarts-3D柱状图

这篇具有很好参考价值的文章主要介绍了Echarts-3D柱状图。希望对大家有所帮助。如果存在错误或未考虑完全的地方,请大家不吝赐教,您也可以点击"举报违法"按钮提交疑问。

通过Echarts的echarts.graphic.extendShape实现真正的3D柱状图
思路就是通过调整顶部面(CubeTop)、左侧面(CubeLeft)、右侧面(CubeRight)来决定柱状图的宽窄
建议优先调整顶部面,一般c1不需要动

// echarts-3D-bar-config.js
import Vue from "vue";

const echarts = Vue.prototype.echarts;

const CubeLeft = echarts.graphic.extendShape({
  shape: {
    x: 0,
    y: 0
  },
  buildPath: function (ctx, shape) {
    const xAxisPoint = shape.xAxisPoint;
    // 顶部右侧顶点
    const c1 = [shape.x, shape.y];
    // 顶部左侧顶点
    const c2 = [shape.x - 15, shape.y - 8];
    // 底部左侧
    const c3 = [xAxisPoint[0] - 15, xAxisPoint[1] - 8];
    // 底部右侧
    const c4 = [xAxisPoint[0], xAxisPoint[1]];
    ctx.moveTo(c1[0], c1[1]).lineTo(c2[0], c2[1]).lineTo(c3[0], c3[1]).lineTo(c4[0], c4[1]).closePath();
  }
});

const CubeRight = echarts.graphic.extendShape({
  shape: {
    x: 0,
    y: 0
  },
  buildPath: function (ctx, shape) {
    const xAxisPoint = shape.xAxisPoint;
    // 顶部左侧顶点
    const c1 = [shape.x, shape.y];
    // 底部左侧顶点
    const c2 = [xAxisPoint[0], xAxisPoint[1]];
    // 底部右侧顶点
    const c3 = [xAxisPoint[0] + 15, xAxisPoint[1] - 8];
    // 顶部右侧顶点
    const c4 = [shape.x + 15, shape.y - 8];
    ctx.moveTo(c1[0], c1[1]).lineTo(c2[0], c2[1]).lineTo(c3[0], c3[1]).lineTo(c4[0], c4[1]).closePath();
  }
});

const CubeTop = echarts.graphic.extendShape({
  shape: {
    x: 0,
    y: 0
  },
  buildPath: function (ctx, shape) {
    // 底部顶点
    const c1 = [shape.x, shape.y];
    // 右侧顶点
    const c2 = [shape.x + 15, shape.y - 8];
    // 顶部顶点
    const c3 = [shape.x, shape.y - 15];
    // 右侧顶点
    const c4 = [shape.x - 15, shape.y - 8];
    ctx.moveTo(c1[0], c1[1]).lineTo(c2[0], c2[1]).lineTo(c3[0], c3[1]).lineTo(c4[0], c4[1]).closePath();
  }
});
echarts.graphic.registerShape("CubeLeft", CubeLeft);
echarts.graphic.registerShape("CubeRight", CubeRight);
echarts.graphic.registerShape("CubeTop", CubeTop);

然后在build-bar-option中引用即可
这里主要就是把series中的内容复制过来直接用就行了文章来源地址https://www.toymoban.com/news/detail-714802.html


import Vue from "vue";
import "./echarts-3D-Bar-config"

const echarts = Vue.prototype.echarts;

export function buildBarOption(vm, xData = [], seriesData = [], originData = []) {
  const option = {
    xAxis: {
      type: "category",
      axisLabel: {
        color: "#fff",
        rotate: 45,
        fontSize: 10
      },
      axisTick: {
        show: false
      },
      axisLine: {
        show: true,
        lineStyle: {
          color: "rgb(53, 179, 229)",
          width: 2
        }
      },
      data: xData
    },
    tooltip: {
      trigger: "item",
      axisPointer: {
        type: "shadow",
        label: {
          show: true
        }
      },
      backgroundColor: "transparent",
      padding: 0,
      formatter: function (params) {
        // console.log(params)
        return `
            <div style="padding: 15px; background: linear-gradient(180.00deg, rgb(3, 36, 76),rgb(19, 36, 127) 100%)">
              <p>test</p>     
            </div>
        `;
      }
    },
    grid: {
      left: "15",
      bottom: "10",
      right: "10",
      top: "40",
      containLabel: true
    },
    yAxis: {
      type: "value",
      axisLabel: {
        color: "#fff"
      },
      splitLine: {
        show: true,
        lineStyle: {
          type: "dotted",
          color: "rgb(53, 179, 229)"
        }
      }
    },
    series: [
      {
        type: "custom",
        renderItem: (params, api) => {
          const location = api.coord([api.value(0), api.value(1)]);
          return {
            type: "group",
            children: [
              {
                type: "CubeLeft",
                shape: {
                  api,
                  xValue: api.value(0),
                  yValue: api.value(1),
                  x: location[0],
                  y: location[1],
                  xAxisPoint: api.coord([api.value(0), 0])
                },
                style: {
                  fill: new echarts.graphic.LinearGradient(0, 0, 0, 1, [
                    {
                      offset: 0,
                      color: "#3B80E2"
                    },
                    {
                      offset: 1,
                      color: "#49BEE5"
                    }
                  ])
                }
              },
              {
                type: "CubeRight",
                shape: {
                  api,
                  xValue: api.value(0),
                  yValue: api.value(1),
                  x: location[0],
                  y: location[1],
                  xAxisPoint: api.coord([api.value(0), 0])
                },
                style: {
                  fill: new echarts.graphic.LinearGradient(0, 0, 0, 1, [
                    {
                      offset: 0,
                      color: "#3B80E2"
                    },
                    {
                      offset: 1,
                      color: "#49BEE5"
                    }
                  ])
                }
              },
              {
                type: "CubeTop",
                shape: {
                  api,
                  xValue: api.value(0),
                  yValue: api.value(1),
                  x: location[0],
                  y: location[1],
                  xAxisPoint: api.coord([api.value(0), 0])
                },
                style: {
                  fill: new echarts.graphic.LinearGradient(0, 0, 0, 1, [
                    {
                      offset: 0,
                      color: "#3B80E2"
                    },
                    {
                      offset: 1,
                      color: "#49BEE5"
                    }
                  ])
                }
              }
            ]
          };
        },
        data: seriesData
      },
      {
        data: seriesData,
        type: "bar",
        barWidth: 13,
        itemStyle: {
          color: "transparent"
        }
      }
    ]
  };

  return option;
}

到了这里,关于Echarts-3D柱状图的文章就介绍完了。如果您还想了解更多内容,请在右上角搜索TOY模板网以前的文章或继续浏览下面的相关文章,希望大家以后多多支持TOY模板网!

本文来自互联网用户投稿,该文观点仅代表作者本人,不代表本站立场。本站仅提供信息存储空间服务,不拥有所有权,不承担相关法律责任。如若转载,请注明出处: 如若内容造成侵权/违法违规/事实不符,请点击违法举报进行投诉反馈,一经查实,立即删除!

领支付宝红包 赞助服务器费用

相关文章

  • echarts5 3D柱状图

    div ref=\\\"echartsQinggan\\\" style=\\\"width: 100%;height: 100%;\\\"/div     async getData() { ///调用接口获取数据    this.Count1=[1,2,3]  this.Count2=[4,5,6]  this.Count3=[7,null,8] this.$nextTick(() = {         this.qinganFun()       })     },     qinganFun() {       // 获取DOM节点并初始化       const hotTheme = this.$echarts.i

    2024年03月18日
    浏览(50)
  • echarts3D地图+3D柱状图+3D飞线图

    echarts版本:5.4.0 echarts-gl版本:2.0.8 DataV.GeoAtlas地理小工具系列

    2024年02月07日
    浏览(37)
  • Echarts 3D立体柱状图(源码+例图)

    Echarts 3D立体柱状图,3D长方体柱状图,直接cope源码可用(源码+例图) 废话不多说,直接上代码!!! 

    2024年02月15日
    浏览(45)
  • vue echarts实现3D效果柱状图

    在vue2项目里面,研究了哈,这里记录下eacharts 实现3D效果柱状图 在main.js引入eacharts 展示效果:大屏demo

    2024年02月15日
    浏览(44)
  • echarts3d柱状图


    2024年02月21日
    浏览(43)
  • echarts看板效果图:流光折线图、3d柱状图、3d饼图、3d地图

    现在展厅的大看板是越花里胡哨越好,不过真的挺难做的。好在可以百度找到一些大神的作品进行参考。 下面的内容都是基于 echarts 5.3.3 和 vue3 。另外demo都是参考别人的案例。 效果图 代码 本质上是两条线组合在一起的,一条是静态的线条,一条是动态的线条。相关属性都

    2024年02月06日
    浏览(47)
  • echarts实现3d柱状图的两种方式

    看了不少关于3d柱状图的案例,发现做3d柱状图 常用的两种方式就是 自定义图形和象型柱图, 两种实现方式效果如下: 方法1: echarts.graphic.extendShape 自定义图形 echarts自定义图形的详细用法点这里, 官网点这里, 图中第一个3d柱状图我参考的案例在这里, 看了很多 echarts这种3d案例,

    2024年02月01日
    浏览(51)
  • vue+echarts——实现3D地图+3D柱状图 效果——粗糙代码记录——技能提升

    最近看到同事在弄下面的这个图,这个图是从网上看到的,是某个网站的收费项目: 所以,最后的决定是通过 echarts 中的 3D地图 来写。但是写出来的效果不慎好看。功能是可以实现的。 初版效果图如下: 直接上代码: 我这边是存储到当前文件夹中了。。。 背景颜色是 ec

    2024年02月09日
    浏览(66)
  • vue3 echarts实现3D立体柱状图效果,多柱状图

    使用插件vchart+echarts5.x按需引入实现 需要注意下,底下的椭圆,是在柱子底下“透”出来,颜色应该暗一点,才能视觉上看着有立体感。 成品,还原了大部分设计效果

    2024年02月06日
    浏览(44)
  • Cesium和Echarts的完美集成展示3D柱状图、折线图和饼状图

    在本文中,我们将介绍如何将Cesium和Echarts两个强大的数据可视化工具进行集成,实现在Cesium地球上展示3D柱状图、折线图和饼状图的功能。Cesium是一个用于创建基于Web的地球浏览和可视化应用程序的JavaScript库,而Echarts是一个功能强大的数据可视化库,支持多种图表类型。 首

    2024年02月04日
    浏览(152)

觉得文章有用就打赏一下文章作者

支付宝扫一扫打赏

博客赞助

微信扫一扫打赏

请作者喝杯咖啡吧~博客赞助

支付宝扫一扫领取红包,优惠每天领

二维码1

领取红包

二维码2

领红包