1) VSCode 调试 C/C++ 代码时,如何显示动态分配的指针数组。
创建一个动态分配的一维数组:
int n = 10;
int *array = (int *)malloc(n*sizeof(int));
memset(array, 1, n*sizeof(int));
如果直接 Debug 时查看 array 指针,并不能看到数组所有的值。
查看 Debug 窗口,有一个 Watch(监视窗口)小窗口,可以添加想要查看的变量的值。
添加 *(int(*)[10])array 或 *array@10 后就可以查看 array 数组的所有值,也就是添加:
- *(type(*)[size])pointer, 其中 type 是数组类型,size 是数组长度,pointer 是分配空间的数组指针。该方法将指针强制转化为一个数组。
- *pointer@size,该方法同样可以查看数组的值。(这种方法比较简便,不容易出错。)
- startElement@size,该方法同样可以查看数组的值,不过 @ 前是第一个要显示的元素,@后面是显示数组元素个数。(这种方法比较简便,不容易出错。)
如上也可以在 调试控制台 中输入想获取结果的变量名或者表达式获得当前的值。


`@' is a binary operator for treating parts of memory as arrays. 二进制操作符,能够把 memory 当成数组。
The left operand of `@' should be the first element of the desired array, as an individual object. The right operand should be the desired length of the array. [p *array-variable@length]
It is often useful to print out several successive objects of the same type in memory; a section of an array, or an array of dynamically determined size for which only a pointer exists in the program.
    // 等效于 arr[2][3][4]
    int ***arr;
    int m = 2, n = 3, t = 4;
    if ((m > 0) && (n > 0) && (t > 0))
    {
        arr = (int ***)malloc(sizeof(int) * m);
        for (int i = 0; i < m; i++)
        {
            arr[i] = (int **)malloc(sizeof(int) * n);
            for (int k = 0; k < n; k++)
            {
                arr[i][k] = (int *)malloc(sizeof(int) * t);
                for (int l = 0; l < t; l++)
                {
                    arr[i][k][l] = 0x5AA0 + l;
                }
            }
        }
    }
常规手段是看不到 arr 的内容的:


【多维数组,还是用 x 命令来的方便。】
再来个例子看看二维数组的打印:

直接全部输出二维数组:


查看多维数 组 arr[size1][size2][...][sizeX] 通项的公式为:
-
***...arr@sizeX@...@size2@size1 [有 X 个 size, 就有 X 个 *]
-
*(type(*)[size1][size2][...][sizeX])arr
在窗口中添加 ***arr@4@3@2 和 *(int(*)[2][3][4])arr,就可以查看数组的值。[如果是通过 malloc,分配的不连续的多维数组,这种方法并没有获得想要的结果,就像上边的例子 arr[2][3][4],元素地址是不连续的。]
Good for pointers to dynamicaly allocated memory.
int *array = (int *) malloc (len * sizeof (int));
p *array@len
p array[0]@len
(gdb) p *array@len
(gdb) p/x (short[2])0x12345678
$1 = {0x1234, 0x5678}
友好的打印输出数组内容:
使用 gdb,print 查看变量值时,发现如果数组长度超过默认值长度的话,会出现省略号来表示多余的内容。
set print elements n 默认为 200,如果超过这个值就会以...替代。 设置为 0,则会全部显示。
可以使用 set print elements 0 来设置显示数组长度无限制。在使用 print 就可以完全显示变量内容了。可以通过 show print elements 查看显示数组长度设定。
help set print 显示所有 print 提供设置选项。show print 显示当 前 print 的设置选项值。
set print address on/off 打开(默认)/关闭打印地址
set print array on/off 打开/关闭(默认) 更好的显示数组。本选项开启后,会换行打印,一个元素一行,默认关闭情况下就是打印在一行。
set print array-indexes on/off 打开/关闭(默认) 显示数组 index。
gdb 查看变量或表达式的值
对于在调试期间查看某个变量或表达式的值,GDB 调试器提供有 2 种方法,即使用 print 命令或者 display 命令。
print 命令: 它的功能就是在 GDB 调试程序的过程中,输出或者修改指定变量或者表达式的值。print 命令可以缩写为 p。
(gdb) print num
(gdb) p num
其中,参数 num 用来代指要查看或者修改的目标变量或者表达式。
当程序中包含多个作用域不同但名称相同的变量或表达式时,可以借助 :: 运算符明确指定要查看的目标变量或表达式。:: 运算符的语法格式如下:
(gdb) print file::variable
(gdb) print function::variable
其中 file 用于指定具体的文件名,funciton 用于指定具体所在函数的函数名,variable 表示要查看的目标变量或表达式。另外,print 也可以打印出类或者结构体变量的值。
display 命令:和 print 命令一样,display 命令也用于调试阶段查看某个变量或表达式的值,它们的区别是,使用 display 命令查看变量或表达式的值,每当程序暂停执行(例如单步执行)时,GDB 调试器都会自动帮我们打印出来,而 print 命令则不会。
也就是说,使用 1 次 print 命令只能查看 1 次某个变量或表达式的值,而同样使用 1 次 display 命令,每次程序暂停执行时都会自动打印出目标变量或表达式的值。因此,当我们想频繁查看某个变量或表达式的值从而观察它的变化情况时,使用 display 命令可以一劳永逸。
display 命令没有缩写形式,常用的语法格式如下 2 种:
(gdb) display expr
(gdb) display/fmt expr
注意,display 命令和 /fmt 之间不要留有空格。以 /x 为例,应写为 (gdb)display/x expr。
监控变量值的变化 - 观察断点:
GDB 调试器支持在程序中打 3 种断点,分别为普通断点、观察断点和捕捉断点。其中 break 命令打的就是普通断点,而 watch 命令打的为观察断点。
借助观察断点 (watch) 可以监控程序中某个变量或者表达式的值,只要发生改变,程序就会停止执行。相比普通断点,观察断点不需要我们预测变量(表达式)值发生改变的具体位置。
(gdb) watch varible
和 watch 命令功能相似的,还有 rwatch 和 awatch 命令。其中:
- rwatch 命令:只要程序中出现读取目标变量(表达式)的值的操作,程序就会停止运行;
- awatch 命令:只要程序中出现读取目标变量(表达式)的值或者改变值的操作,程序就会停止运行。
GDB 调试环境命令对应到 VSCode 调试控制台 (Debug Console) 窗口命令:
如果你留意的话,VSCode 调试控制台已经告诉你了方法:
Execute debugger commands using "-exec <command>", for example "-exec info registers" will list registers in use (when GDB is the debugger)

所以呢,能够执行的 gdb command 都可以在 VSCode 的 Debug Console 中执行。 如果你了解 Gdb 命令就不难理解“如何显示动态分配的指针数组”的问题。
| gdb 命令行 | VSCode 调试控制台窗口 | 描述 |
| x/fmt address(or variable name) | -exec x/80wx address(or variable name) | 以十六进制显示 address 起始位置的memory,显示80个 DW。 |
| p variable | -exec p variable | 显示或更改变量或表达式值 |
| variable | 查看某个变量或表达式的值。 | |
| variable = xxx | 更改 | |
| watch variable | -exec watch variable | 监控变量值的变化 |
/fmt:
| a |
Pointer - address 内存地址格式显示(与十六进制相似) |
| c |
Read as integer, print as character |
| d |
Integer, signed decimal |
| f |
Floating point number |
| o |
Integer, print as octal |
| s |
Try to treat as C string |
| t |
Integer, print as binary (t = 'two') |
| u |
Integer, unsigned decimal |
| x |
Integer, print as hexadecimal |
GDB print命令高级用法 (biancheng.net)
GDB调试教程:1小时玩转Linux gdb命令
https://www.cnblogs.com/puhongtao/p/14529605.html
一小时轻松掌握GDB调试_哔哩哔哩_bilibili
VSCode 反汇编:
1 通过 Call Stack 右键

2 通过 debug console 调试窗口 比如 -exec disas main

disassemble 程序计数器:反汇编 pc 所在函数的整个函数。
disassemble addr-0x40,addr+0x40:反汇编 addr 前后0x40大小。
| info line info line number |
Displays the start and end position in object code for the current line in source. Display position in object code for a specified line in source. |
| disassemble 0xstart 0xend
disassemble
|
Displays machine code for positions in object code specified (can use start and end hex memory values given by the info line command.
/m 表示把源代码和汇编一一对应显示出来,在新版本中建议 /s,他会考虑 compiler 的优化。the output is in source line order, regardless of any optimization that is present. Only the main source fileis displayed, not those of, e.g., any inlined functions. This modifier hasn't proved useful in practice and is deprecated in favor of /s. /r 表示显示汇编指令的原生字节码。raw instructions in hex are included. |
| set disassemble-next-line set disassemble-next-line on |
控制断点暂停或 step 后是否显示下一行的汇编,默认是 off。 |
总结:
VSCode 为 gdb 提供图形化显示,gdb为 VSCode 提供任意的内存可视化和汇编语句显示,即 VSCode 是 gdb 的前端, 所以 gdb 的命令可以在 debug console 中执行。
使用 -exec help 查看命令帮助,比如 -exec help x :

查看内存命令语法为:
x /<Nuf> <addr>
# N 要打印的单元数,可以为负值,表示往前数
# u表示每个单元的大小(b(byte), h(halfword), w(word), g(giant, 8 bytes))
# f表示打印的格式(o(octal), x(hex), d(decimal), u(unsigned decimal),t(binary), f(float), a(address),
#               i(instruction), c(char), s(string)and z(hex, zero padded on the left))
查看 Variables 和 Memory 的方法总结:


调试时在 VSCode 行内显示变量值的设定:
https://www.cnblogs.com/haoliuhust/p/17630701.html
inline values:

设置为 on:

VScode调试c代码时,如何显示动态分配的指针数组_vscode监视数组-CSDN博客
VScode调试C++代码时无法查看STL容器(string、vector等)_vs code无法打开string-CSDN博客
VSCode + C/C++ 编译器:
VSCode 虽然功能强大,它只是一个编辑器,自己是没法编译代码的,需要安装C++编译器:
1. TDM-GCC:很久没有更新了,版本比较老。
TDM-GCC 10.3.0 release | tdm-gcc (jmeubank.github.io)
安装好后配置 Windows(10)环境变量:安装完成过后需配置环境变量: 我的电脑->属性->高级系统设置->环境变量->系统变量里找到path->编辑->>
把 C:\TDM-GCC-64\bin(根据你安装的位置,VSCode的没添加也一起添加) (系统变量相当于所有用户,所以一般修改系统变量的 path,path 就是命令行可以自动检索的地方)。
2. WinLibs 是 mingw 在 Windows 平台的分发库。WinLibs 专注于 Windows 下的GCC。优点是发布比较及时,发行版本丰富多样。免安装,多版本可以共存。
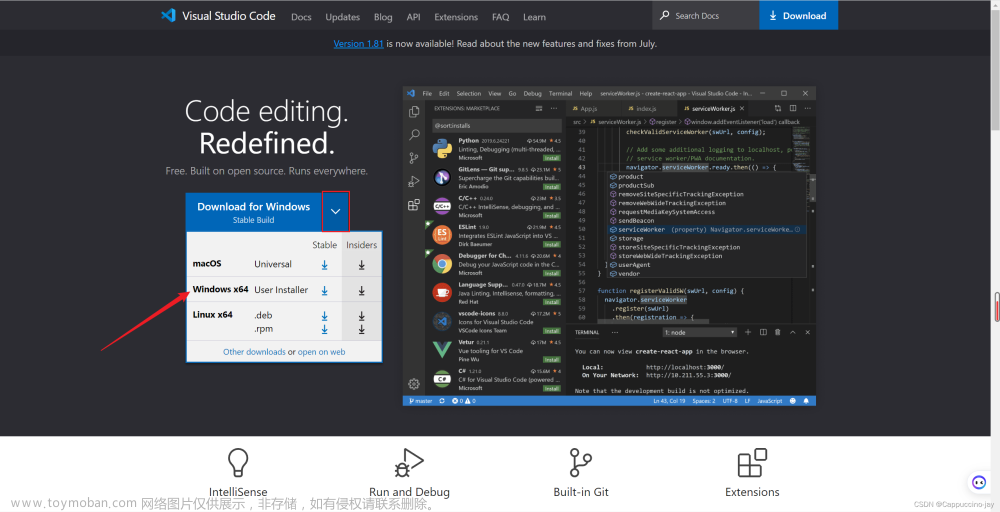
下载链接:WinLibs - GCC+MinGW-w64 compiler for Windows
如果用 C++ 仅仅是自己学习、不引入其他奇奇怪怪的库的话,下载 UCRT runtime 里的最新的Win64 压缩包就可以。下载好后,随便解压到一个地方就行,解压即可用。
去CMake官网:https://cmake.org/download/,拉到下面Binary distributions,下载Windows x64 ZIP,同样解压即可用。
配置环境变量:把你的 MinGW 和 CMake 解压路径下面的 bin 文件夹添加进 path,注意是 bin 文件夹。比如我的 MinGW 解压在 D:\CPP\environments\mingw64-ucrt,环境变量里就要添加D:\CPP\environments\mingw64-ucrt\bin。CMake 同理。
[极简教程]如何低成本、快速的在Windows电脑上搭建一个现代且干净的C++开发环境(VSCode+MinGW+CMake) - 知乎
VSCode Project 配置文件:
-
tasks.json(build instructions) -
launch.json(debugger settings) -
c_cpp_properties.json(compiler path and IntelliSense settings)
Get Started with C++ and MinGW-w64 in Visual Studio Code -- For Windows
Get Started with C++ on Linux in Visual Studio Code -- For Linux
配置 C/C++ 配置文件:c_cpp_properties.json 文件
在该文件 "includePath"处添加 TDM GCC 的 include 路径即可。
{
    "configurations": [
        {
            "name": "Win32",
            "includePath": [
                "${workspaceFolder}/**"
                //"C:\\TDM-GCC-64\\include",
                //"C:\\TDM-GCC-64\\x86_64-w64-mingw32\\include"
            ],
            "defines": [
                "_DEBUG",
                "UNICODE",
                "_UNICODE"
            ],
            "compilerPath": "C:\\TDM-GCC-64\\bin\\gcc.exe",
            "cStandard": "c17",
            "cppStandard": "gnu++14",
            "intelliSenseMode": "windows-gcc-x64"
        }
    ],
    "version": 4
}
配置 launch.json 文件:
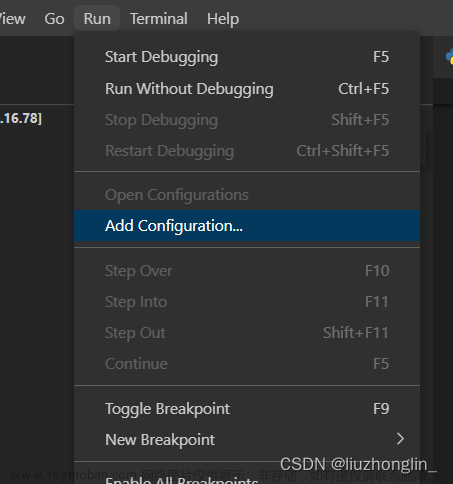
按下图流程点击“调试”->C++(GDB/LLDB),会进入调试,并生成一个launch.json文件,若没有则选择添加配置再选C++(GDB/LLDB)。

再添加配置选择gdb,就会出现如下配置代码:
{
    // 使用 IntelliSense 了解相关属性。
    // 悬停以查看现有属性的描述。
    // 欲了解更多信息,请访问: https://go.microsoft.com/fwlink/?linkid=830387
    "version": "0.2.0",
    "configurations": [

        {
            "name": "(gdb) 启动",
            "type": "cppdbg",
            "request": "launch",
            "program": "${fileDirname}\\${fileBasenameNoExtension}.exe",
            "args": [],
            "stopAtEntry": false,
            "cwd": "${fileDirname}",
            "environment": [],
            "externalConsole": false,
            "MIMode": "gdb",
            "miDebuggerPath": "C:\\TDM-GCC-64\\bin\\gdb.exe",
            "preLaunchTask": "compile",  // 调试会话开始前执行的任务, “preLaunchTask” 参数要和 task.json 文件中的 “label” 参数保持一致
            "setupCommands": [
                {
                    "description": "为 gdb 启用整齐打印",
                    "text": "-enable-pretty-printing",
                    "ignoreFailures": true
                },
                {
                    "description": "将反汇编风格设置为 Intel",
                    "text": "-gdb-set disassembly-flavor intel",
                    "ignoreFailures": true
                }
            ]

        }


    ]
}
配置 tasks.json 文件:
如果需要是c语言也就是gcc将下面的command项由g++改为gcc
如果是多文件编译(即函数声明和函数定义分开,不懂的别乱改),需要将args列表中的"${file}"项修改为"${workspaceFolder}/*.cpp" ,多文件推荐用cmake。
{
    "tasks": [
        {
            "type": "cppbuild",
            "label": "compile", //一定要和 launch.json 的 preLaunchTask 名字一致。任务的名字,就是在命令面板中选择的时候所看到的,可以自己设置。
            "command": "C:\\TDM-GCC-64\\bin\\g++.exe",
            "args": [ //编译时候的参数
                "-fdiagnostics-color=always",
                "-g",
                "${file}",
                "-o",
                "${fileDirname}\\${fileBasenameNoExtension}.exe",
                //"-fexec-charset=GBK", //GBK编码,用于解决Winows中文乱码
            ],
            "options": {
                "cwd": "${fileDirname}"
            },
            "problemMatcher": [
                "$gcc"
            ],
            "group": {
                "kind": "build",
                "isDefault": true
            },
            "detail": "调试器生成的任务。"
        },
    ],
    "version": "2.0.0"
}
task.json 的用途:用于指定编译器和链接文件等,告诉 VSCode 如何去编译这个程序。默认路径在 .vscode下面。
如何打开一个 task.json 文件:

然后点击 configure default Build Task 后,点击 c/c++:gcc.exe 生成活动文件:
label:任务的名称,显示在下拉列表中。
command:指定编译器的路径。
args:命令行参数,用于传递给编译器。可以添加链接库等。
"-std=c++17"用于支持C++17语言功能
problemMatcher:运行问题解析器,用于查找错误和编译器输出中的警告。
group:组对象。
lauch.json 的用途:用于调试程序,默认路径在 .vscode 下面。

配置完后,右下角点击 “ Add Configuration...”

name: 给配置项的起一个易于理解的名称,调试过程中可以在调试按钮处看到:

type:根据开发语言决定。eg.node.js 的 type为 node,C/C++ 语言的 type 为 cppdbg。
request:指定调试模式,有 launch 和 attach 两种。使用 launch 可以为程序搭一个调试器,支持加断点。
program:指定要调试的程序。需要和 tasks.json 中的目标文件一致。
args:main 函数 (argc,argv) 的参数。启动时,传递到 main 函数中。
stopAtEntry: 如果想要在 main 函数停止,这里设为 true。
MIMode:配置调试器类型 gdb or lldb
miDebuggerPath: 配置调试器的路径(eg,gdb)。会自动搜索电脑中的调试器,根据 MIMode 的配置类型来找。
launch 和 attach 的区别:
- 以 launch 方式启动的时候,vscode 直接从本地项目启动并自动的为我们自动添加一个调试器,这也是为什么我们能在launch模式下打断点的原因。这是我们最经常用的。
- 而想以 attach 方式启动,通常需要一个已经在跑的项目,比如一个 web 服务,这个服务很可能是在远程或者在本地但是重启速度很慢的那种项目,因为这个 web 服务是在远程的我们没法打断点,但是可以通过 attach 启动的方式在这个远程的服务外面包裹一层调试器,达到调试的目的。
launch.json 文件中的 “preLaunchTask” 参数要和 task.json 文件中的 “label” 参数保持一致。
GDB - Warning: Debuggee TargetArchitecture not detected, assuming x86_64.
解决办法:在 launch.json 中加上 "targetArchitecture": "x86_64",
The architecture of the debuggee. This will automatically be detected unless this parameter is set. Allowed values are x86, arm, arm64, mips, x64, amd64, x86_64。risc-v ???
VSCode 调试 C++ 不进入标准库的配置方法:
在 launch.json 中的 "setupCommands" 里加入如下一段,防止 gdb 打开标准库函数。
{
      "description": "防止 gdb 打开标准库函数",
      "text": "-interpreter-exec console \"skip -rfu std::.*\"",
      "ignoreFailures": false
}
这样设置后,即使点击了 Step Into (F11) 也不会进入标准库函数(尤其是模板库)-- 副作用?
c_cpp_properties.json 的用途:是 Visual Studio Code 中的一个配置文件,用于配置 C++ 项目的属性。其中包括编译器路径、头文件路径(includePath)、库文件路径、 C/C++标准、宏定义等。通过修改该文件,可以让 VS Code 正确地识别 C++ 项目的相关文件和库,从而实现代码补全、识别和高亮代码中的 C/C++ 关键字和类型,调试等功能。在编写代码时,通过该配置文件,VSCode 可以正确地链接头文件和库文件。
打开:点击右下角的 linux 或者 win32。(或使用快捷键Ctrl+Shift+P,输入C/C++:Edit Configuration)

或者点击 Ctrl + shift + p,在命令行输入 C/C++,选择 C/C++:编辑配置(UI)。接下来做几个选择:编译器路径,IntelliSense 模式,C 标准,C++ 标准等。最终生成 c_cpp_properties.json 文件。

https://www.zhihu.com/question/336266287/answer/2144611720
最后给大家推荐一个VS Code的教程:https://www.bilibili.com/video/BV1Jf4y1S7Bw/?spm_id_from=333.788.videocard.0

| C++版本 | GCC版本支持情况 | GCC版本 | 指定版本的命令标志 |
|---|---|---|---|
| C++98 | 完全支持 | GCC 6.1之前版本的默认模式 | |
| C++11 | 完全支持 | GCC 4.8.1开始完全支持 | -std=c++11 or -std=gnu++11 |
| C++14 | 完全支持 | GCC 6.1版本开始完全支持,GCC 6.1到GCC 10的默认模式 | -std=c++14 or -std=gnu++14 |
| C++17 | 完全支持 | GCC 5开始支持,GCC 7基本完全支持,GCC 8完全支持。GCC 11的默认模式 | -std=c++17 or -std=gnu++17 |
| C++20 | 未完全支持 | GCC 8开始陆续支持(因该标准较新,故GCC支持都是实验性质的) | -std=c++20 or -std=c++2ag++ or -std=gnu++20 |
| C++23 | 未完全支持(标准还在发展中) | GCC 11开始支持(因该标准仍不断发展,故GCC支持都是实验性质的) | -std=c++2bg++ or -std=gnu++2b |
C++ Standards Support in GCC- GNU Project
选项 -std=gnu++17 和 -std=c++17 相比添加了相应 C++ 标准的 GNU 扩展。
VSCode 各种断点:
Debugging in Visual Studio Code
1. 右键

2. Run --> New Breakpoint

Logpoint: A Logpoint is a variant of a breakpoint that does not "break" into the debugger but instead logs a message to the console (DEBUG CONSOLE). Logpoints are especially useful for injecting logging while debugging production servers that cannot be paused or stopped.
A Logpoint is represented by a "diamond" shaped icon. Log messages are plain text but can include expressions to be evaluated within curly braces ('{}').
日志断点是普通断点的一种变体,区别在于不会中断调试,而是可以把信息记录到控制台。日志断点对于调试无法暂停或停止的服务时特别有用。通过 {} 使用变量或表达式,比如:
array[30] = {array[30]}
-
日志断点添加成功后会有是一个菱形图标。

Expression condition: The breakpoint will be hit whenever the expression evaluates to true.
Hit count: The 'hit count' controls how many times a breakpoint needs to be hit before it will 'break' execution. Whether a 'hit count' is respected and the exact syntax of the expression vary among debugger extensions.
Condition and hit count editing support is also supported for function and exception breakpoints.
条件断点:
在断点处右键点击,选择 "Edit Breakpoint",在弹出的窗口中勾选 "Condition" 并输入条件表达式,该断点只会在条件为真时被触发。
一个强大的 VS Code 调试功能是能够根据表达式、命中计数或两者的组合设置条件。
- 表达式条件:只要表达式求值为 true ,就会触发断点。
- 命中计数:“命中计数”控制断点在“中断”执行之前需要命中多少次。是否尊重“命中计数”以及表达式的确切语法因调试器扩展而异。
Inline breakpoints: Inline breakpoints will only be hit when the execution reaches the column associated with the inline breakpoint. This is particularly useful when debugging minified code which contains multiple statements in a single line.
An inline breakpoint can be set using Shift+F9 or through the context menu during a debug session. Inline breakpoints are shown inline in the editor.
Inline breakpoints can also have conditions. Editing multiple breakpoints on a line is possible through the context menu in the editor's left margin.
仅当执行到达与内联断点关联的列时,才会命中内联断点。这在调试在一行中包含多个语句的缩小代码时特别有用。比如 for 循环,短路运算符等一行代码包含多个表达式时会特别有用。调试之后,每次运行到该内联处的代码都会中断。

Function breakpoints: Instead of placing breakpoints directly in source code, a debugger can support creating breakpoints by specifying a function name. This is useful in situations where source is not available but a function name is known.
A function breakpoint is created by pressing the + button in the BREAKPOINTS section header and entering the function name. Function breakpoints are shown with a red triangle in the BREAKPOINTS section.
Data breakpoints: If a debugger supports data breakpoints, they can be set from the context menu in the VARIABLES view. The Break on Value Change/Read/Access commands will add a data breakpoint that is hit when the value of the underlying variable changes/is read/is accessed. Data breakpoints are shown with a red hexagon in the BREAKPOINTS section.
Data breakpoints: -exec watch/rwatch/awatch variable

GCC编译器30分钟入门教程 (biancheng.net)
VS2017/VS2019/VS2022 + VSCode
Windows 10下vscode使用visual studio 2017的MSVC配置C/C++编译环境_vscode 配置visual studio环境-CSDN博客
Configure Visual Studio Code for Microsoft C++
【精选】VScode与VS中的MSVC配置C++开发环境记录_vscode使用vs2019的编译器_A-SHY-MAN的博客-CSDN博客
VSCODE 中 WARNING C4819: 该文件包含不能在当前代码页(936)中表示的字符
1. 对于 VSCODE 中的 TASKS.JSON
添加 msvc 编译选项 args: /source-charset:utf-8 设置代码输入为 utf-8。
2. 对于 CMAKE
在 CMakeList.txt 中添加
if (MSVC)
# 设置 msvc 输入代码编码格式为 utf-8
set(CMAKE_C_FLAGS /source-charset:utf-8)
endif()
3. 对于 VS2017/VS2019/VS2022

vscode 中 warning C4819: 该文件包含不能在当前代码页(936)中表示的字符
来自 <vscode 中 warning C4819: 该文件包含不能在当前代码页(936)中表示的字符_vscode终端活动代码页: 936-CSDN博客>
vscode 中 warning C4819: 该文件包含不能在当前代码页(936)中表示的字符_vscode终端活动代码页: 936-CSDN博客
VSCode + Git :
Edit in settings.json:
"git.path": "S:/install/Git/bin/git.exe",
"terminal.integrated.shell.windows" : "S:/install/Git/bin/bash.exe"
可以在 TERMINAL 终端输入cmd 切换回系统终端, 也可以再输入 bash 切换 Git Bash 终端
"git.enableSmartCommit": true, //开启智能 commit. 如果不是 vscode 可视化 Git gui 使用者,无需配置该项.(该项配合 git scm 使用)
VSCode 编辑窗口禁用预览模式
当在侧栏中单击一个文件时,Visual Studio 代码会在 预览模式下 打开它,这样您就可以快速查看文件。(默认设置)
预览模式的行为:
- 预览模式中的选项卡未保持打开状态。
- 只要您从侧边栏打开另一个文件,它就会覆盖现有文件(如果它处于预览模式)。
- 如果选项卡处于预览模式,则标题的标题将以斜体显示,如下面的屏幕截图所示。
如果文件已在预览模式下打开,则将其转换为编辑模式:
- 双击标题栏中的斜体文件名,或
- 按 Ctrl - K Enter
重要!!! 如果要编辑文件,请不要在预览模式下打开,而是双击侧栏中的文件。
如果要一起禁用预览模式,即:转到Pereferences>设置>“搜索settings.json”>在最后一行之前 } 将逗号添加到最后一个选项并粘贴 "workbench.editor.enablePreview": false
例如:
{
    "editor.fontFamily": "'Consolas', 'monospace', 'Times New Roman'",
    "terminal.integrated.fontFamily": "monospace",
    "editor.fontSize": 13,
    "workbench.iconTheme": "vscode-icons",
    "workbench.editor.enablePreview": false, // <-----------

}
对于不想禁用 预览模式的人:
使用快捷键 Quick Open / Ctrl + P 将打开的文件固定在编辑器中并为编辑状态, 是的 ,此方式不需要切换将您的手放在鼠标上,双击文件列表。
说明:
-
workbench.editor.enablePreview: 设置为全局启用或禁用预览编辑器文章来源:https://www.toymoban.com/news/detail-736445.html
-
workbench.editor.enablePreviewFromQuickOpen: 将其设置为从快速打开(Ctrl+P)中打开时启用或禁用预览编辑器文章来源地址https://www.toymoban.com/news/detail-736445.html
到了这里,关于vscode debug skills的文章就介绍完了。如果您还想了解更多内容,请在右上角搜索TOY模板网以前的文章或继续浏览下面的相关文章,希望大家以后多多支持TOY模板网!