Vue实现消费清单明细饼图展示

这篇具有很好参考价值的文章主要介绍了Vue实现消费清单明细饼图展示。希望对大家有所帮助。如果存在错误或未考虑完全的地方,请大家不吝赐教,您也可以点击"举报违法"按钮提交疑问。

功能

  1. 可以进行消费项增删
  2. 消费额大于500会标红
  3. 消费金额合计
  4. 饼图展示消费项
    Vue实现消费清单明细饼图展示,前端,vue.js,javascript,前端

代码

<!DOCTYPE html>
<html lang="en">

<head>
  <meta charset="UTF-8" />
  <meta name="viewport" content="width=device-width, initial-scale=1.0" />
  <title>Document</title>
  <!-- CSS only -->
  <link rel="stylesheet" href="https://cdn.jsdelivr.net/npm/bootstrap@5.1.3/dist/css/bootstrap.min.css" />
  <style>
    .red {
      color: red !important;
    }

    .search {
      width: 300px;
      margin: 20px 0;
    }

    .my-form {
      display: flex;
      margin: 20px 0;
    }

    .my-form input {
      flex: 1;
      margin-right: 20px;
    }

    .table> :not(:first-child) {
      border-top: none;
    }

    .contain {
      display: flex;
      padding: 10px;
    }

    .list-box {
      flex: 1;
      padding: 0 30px;
    }

    .list-box a {
      text-decoration: none;
    }

    .echarts-box {
      width: 600px;
      height: 400px;
      padding: 30px;
      margin: 0 auto;
      border: 1px solid #ccc;
    }

    tfoot {
      font-weight: bold;
    }

    @media screen and (max-width: 1000px) {
      .contain {
        flex-wrap: wrap;
      }

      .list-box {
        width: 100%;
      }

      .echarts-box {
        margin-top: 30px;
      }
    }
  </style>
</head>

<body>
  <div id="app">
    <div class="contain">
      <!-- 左侧列表 -->
      <div class="list-box">

        <!-- 添加资产 -->
        <form class="my-form">
          <input type="text" class="form-control" placeholder="消费名称" v-model="name" />
          <input type="text" class="form-control" placeholder="消费价格" v-model="price" />
          <button type="button" class="btn btn-primary" @click="add">添加账单</button>
        </form>

        <table class="table table-hover">
          <thead>
            <tr>
              <th>编号</th>
              <th>消费名称</th>
              <th>消费价格</th>
              <th>操作</th>
            </tr>
          </thead>
          <tbody>
            <tr v-for="(item,index) in bills" :key="item.id">
              <td>{{index+1}}</td>
              <td>{{item.name}}</td>
              <td :class="{ red:item.price>500}">{{item.price}}</td>
              <td><a href="javascript:;" @click="del(item.id)">删除</a></td>
            </tr>

          </tbody>
          <tfoot>
            <tr>
              <td colspan="4">消费总计: {{totalPrice}}</td>
            </tr>
          </tfoot>
        </table>
      </div>

      <!-- 右侧图表 -->
      <div class="echarts-box" id="main"></div>
    </div>
  </div>
  <script src="https://cdn.jsdelivr.net/npm/echarts@5.4.0/dist/echarts.min.js"></script>
  <script src="https://cdn.jsdelivr.net/npm/vue@2/dist/vue.js"></script>
  <script src="https://cdn.jsdelivr.net/npm/axios/dist/axios.min.js"></script>
  <script>
    /**
     * 接口文档地址:
     * https://www.apifox.cn/apidoc/shared-24459455-ebb1-4fdc-8df8-0aff8dc317a8/api-53371058
     * 
     * 功能需求:
     * 1. 基本渲染
     * 2. 添加功能
     * 3. 删除功能
     * 4. 饼图渲染
     */
    const app = new Vue({
      el: '#app',
      data: {
        bills: [],
        name: '',
        price: '',

      },
      created() {
        this.getBill()
      },
      mounted() {
        this.myChart = echarts.init(document.getElementById('main'));
        this.myChart.setOption({
          title: {
            text: '消费明细',
            left: 'center'
          },
          tooltip: {
            trigger: 'item'
          },
          legend: {
            orient: 'vertical',
            left: 'left'
          },
          data: [],
          series: [
            {
              name: '消费账单',
              type: 'pie',
              radius: '50%',
              emphasis: {
                itemStyle: {
                  shadowBlur: 10,
                  shadowOffsetX: 0,
                  shadowColor: 'rgba(0, 0, 0, 0.5)'
                }
              }
            }
          ]
        })
      },
      computed: {
        totalPrice() {
          return this.bills.reduce((sum, item) => sum + item.price, 0)
        }
      },
      methods: {
        async getBill() {
          const res = await axios.get("https://applet-base-api-t.itheima.net/bill", {
            params: {
              creator: '小黑'
            }
          })
          this.bills = res.data.data
          this.myChart.setOption({
            series: [
              {
                data: this.bills.map(item => ({ value: item.price, name: item.name }))
              }
            ]
          })
        },
        async add() {
          const res = await axios.post('https://applet-base-api-t.itheima.net/bill', {
            creator: '小黑',
            name: this.name,
            price: this.price
          })
          this.name = '',
          this.price = ''
          this.getBill()
        },
        async del(id) {
          const res = await axios.delete(`https://applet-base-api-t.itheima.net/bill/${id}`)
          this.getBill()
        }
      }
    })
  </script>
</body>

</html>

文章来源地址https://www.toymoban.com/news/detail-739493.html

到了这里,关于Vue实现消费清单明细饼图展示的文章就介绍完了。如果您还想了解更多内容,请在右上角搜索TOY模板网以前的文章或继续浏览下面的相关文章,希望大家以后多多支持TOY模板网!

本文来自互联网用户投稿,该文观点仅代表作者本人,不代表本站立场。本站仅提供信息存储空间服务,不拥有所有权,不承担相关法律责任。如若转载,请注明出处: 如若内容造成侵权/违法违规/事实不符,请点击违法举报进行投诉反馈,一经查实,立即删除!

领支付宝红包 赞助服务器费用

相关文章

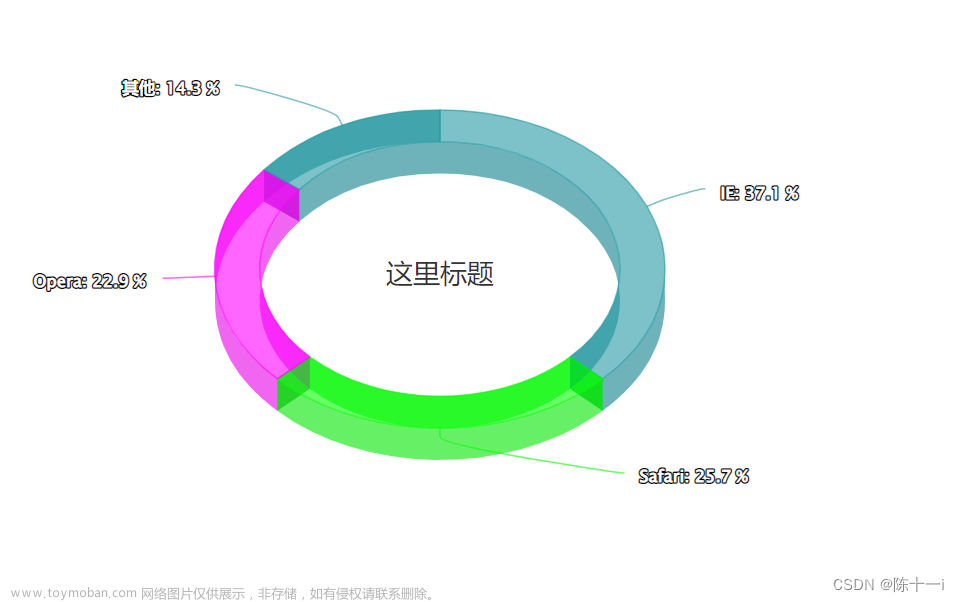
  • vue3+heightchart实现3D饼图,echarts3D饼图,3D饼图引导线实现

     附上 heightcharts 官网地址  Highcharts 演示 | Highcharts https://www.hcharts.cn/demo/highcharts 首先需要下载一下 heightcharts执行命令  然后初始化: 如此你就得到了一个3D饼图 

    2024年02月13日
    浏览(36)
  • 前端Vue页面中如何展示本地图片

    我们使用img标签展示图片,src属性设置成图片请求路径 \\\"http://localhost:8888/image/img.jpg\\\" 的格式,也就是会向后端发送这个请求获取图片。 但是图片是存放在本地的某个文件里,那如何才能找到呢? 这就需要对这个请求的路径进行映射,以找到真正的存放图片的地址。

    2024年02月04日
    浏览(40)
  • vue实现echarts3D饼图

    效果图: 1.首先安装依赖 2.mainjs中导入以及挂载 3.传入数据生成3D的配置项以及option的配置 4.指示线的配置

    2024年02月06日
    浏览(44)
  • Vue 3 + ffmpeg + wasm 实现前端视频剪辑、音频剪辑、音波展示、视频抽帧、gif抽帧、帧播放器、字幕、贴图、时间轴、素材轨道

    预览 www.bilibili.com/video/BV1YT411Y7YJ 技术栈: 💪 Vue 3、Vue-Router 4、Vite、pnpm、esbuild、TypeScript ☀️ Pinia 状态管理 🌪 Tailwind 原子css集成 💥 ffmpeg、wasm 底层音视频处理集成 功能 多轨道时间轴,支持帧缩放,时间缩放 支持多种类型轨道的添加删除 多功能轨道调节,支持音视频轨

    2024年02月11日
    浏览(52)
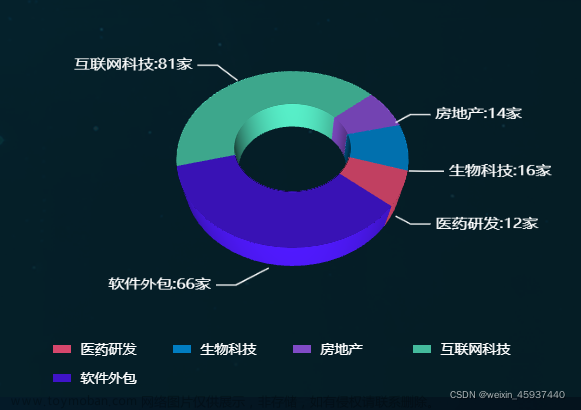
  • vue 使用echarts实现3D饼图和环形图

    记录一下echarts实现3d饼图和环形图功能## 标题 实现效果 首先第一步安装echarts和echarts-gl echarts-gl安装最新版本可能会有异常,建议安装\\\"echarts-gl\\\": \\\"^1.1.2\\\"版本 第二步在vue文件中引入 第三步我这里把实现3d饼图的代码给封装一下,如下: 第四步 vue文件内使用 饼图的实现 如果对

    2024年02月12日
    浏览(54)
  • vue中使用echarts与echarts-gl 实现3D饼图环形饼图

    注意:我不知道版本差异会不会有影响(可以指定版本 也可以借鉴我的) 指定版本命令 加个@后面跟版本号即可 成功之后可以在package.json中检查是否安装成功(如上图) 引入位置:我没有在main.js中全局引用,而是哪个页面用到就引入哪里 代码: 注意:我没有封装起来(你

    2024年02月03日
    浏览(46)
  • vue项目前端展示数学公式(在表格中渲染)

    现有需求为 将实验数据录入表格中,需要表格呈现物理公式,使用 Mathjax 在vue2中 进行呈现 1.安装 2.全局注册(main.js中)   私有组件   不想插入组件 在表格中如何使用  ps:渲染公式 需要先拿到对应的DOM元素 Mathjax语法总结 使用MathJax 3 渲染数学公式及在Vue中的使用 MathJax基本的使

    2024年01月23日
    浏览(46)
  • vue前端展示后端传来的图片链接

    当后端的图片是以部分地址的形式传来时,直接将其使用由于缺少协议主机端口号,因此是无法展示的。 因此需要将后端传来的部分地址赋予一个变量接上协议主机端口号来使用。 后端传回来的值:  前端显示代码:  显示结果:

    2024年04月14日
    浏览(31)
  • uniapp微信小程序投票系统实战 (SpringBoot2+vue3.2+element plus ) -投票帖子明细实现

    锋哥原创的uniapp微信小程序投票系统实战: uniapp微信小程序投票系统实战课程 (SpringBoot2+vue3.2+element plus ) ( 火爆连载更新中... )_哔哩哔哩_bilibili uniapp微信小程序投票系统实战课程 (SpringBoot2+vue3.2+element plus ) ( 火爆连载更新中... )共计21条视频,包括:uniapp微信小程序投票系统实

    2024年01月22日
    浏览(68)
  • 前端Vue自定义地址展示地址选择地址管理组件

    随着技术的发展,开发的复杂度也越来越高,传统开发方式将一个系统做成了整块应用,经常出现的情况就是一个小小的改动或者一个小功能的增加可能会引起整体逻辑的修改,造成牵一发而动全身。通过组件化开发,可以有效实现单独开发,单独维护,而且他们之间可以随

    2024年02月11日
    浏览(45)

觉得文章有用就打赏一下文章作者

支付宝扫一扫打赏

博客赞助

微信扫一扫打赏

请作者喝杯咖啡吧~博客赞助

支付宝扫一扫领取红包,优惠每天领

二维码1

领取红包

二维码2

领红包