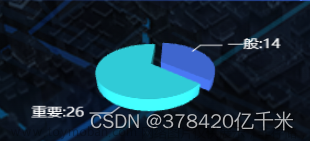
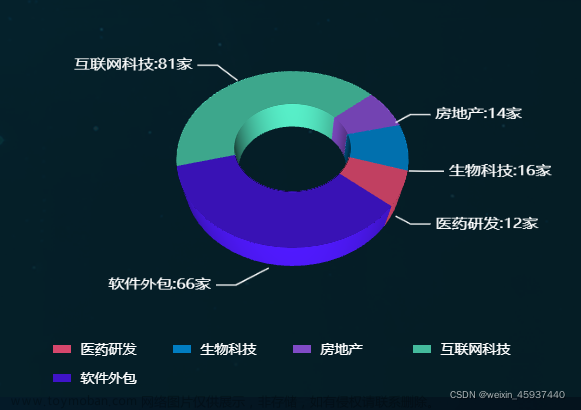
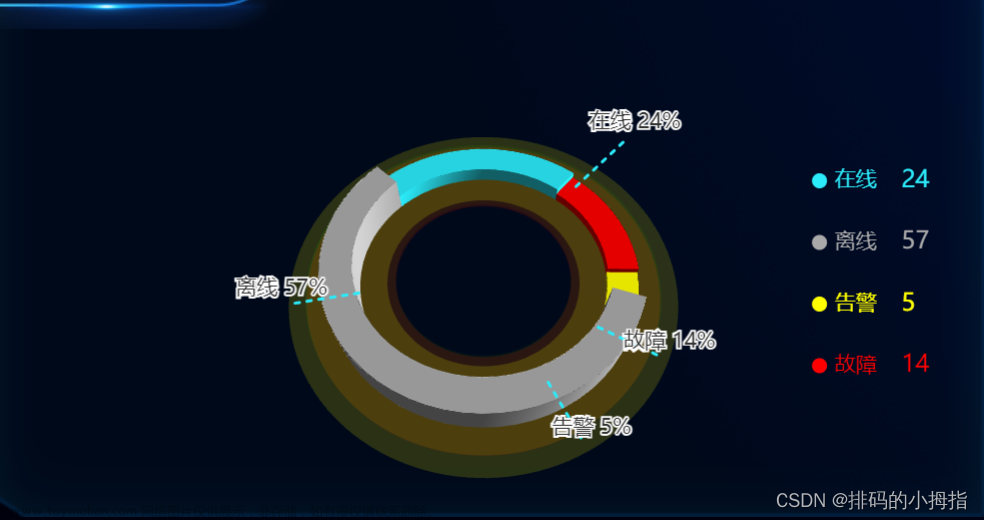
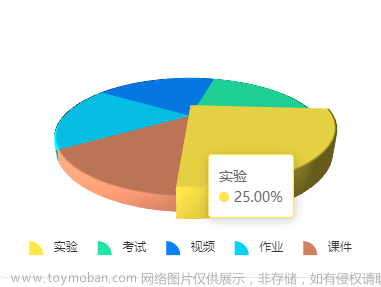
最终效果图如下,一个具有鼠标滑过提示框,图例联动,图例翻页的3D饼图

一、创建基本3D饼图展示
1、创建Pie3D.vue文件
<template>
  <div>
    <p>D3JS实现的3D饼图</p>
    <div id="abc"></div>
  </div>
</template>

<script setup>
import pie from '../utils/pie'
import { onMounted, reactive } from 'vue';

let config = reactive({
  color:["#0f7eee","#24Daff","#FFFF80","#caf982","#80DCff"]
})
//基础数据
const salesData = [
    {label: "2023-05-01", value: 61, DWMC:'俩'},
    {label: "2023-05-02", value: 70, DWMC:'俩'},
    {label: "2023-05-03", value: 67, DWMC:'俩'},
    {label: "2023-05-04", value: 21, DWMC:'俩'},
    {label: "2023-05-05", value: 23, DWMC:'俩'},
    {label: "2023-05-06", value: 82, DWMC:'俩'},
    {label: "2023-05-06", value: 26, DWMC:'俩'},
    {label: "2023-05-06", value: 57, DWMC:'俩'}
];
onMounted(() => {
  pie('#abc', 700, 400, salesData, 250, 200, 150, 100, 30, config)
})

</script>

<style>
/* 样式 */
#abc{
  width: 700px;
  height: 400px;
}
</style>
2、在utils目录中创建pie.js文件 该文件就是渲染3D饼图的主文件
import * as d3 from 'd3';
import { pieInner, pieTop, pieOuter } from '../utils/renderUtils'
/**
 * 生成3d饼图
 * @param {*} id :id唯一标识
 * @param {*} width :svg的宽
 * @param {*} height :svg的高
 * @param {*} data :要渲染的数据
 * @param {*} x :横向偏移量
 * @param {*} y :纵向偏移量
 * @param {*} rx :饼图的横向半径
 * @param {*} ry :饼图的纵向半径
 * @param {*} h :饼图的高度
 */
export default function pie(id, width, height, data, x, y, rx, ry, h, config,ir=0){
    //先移除所有的svg
    d3.select(id).selectAll('svg').remove();
    //创建一个svg容器,用来存放饼图
    const pieSvg = d3
                    .select(id)
                    .append('svg')
                    .attr('width','100%')
                    .attr('height','100%');
    pieSvg.append('g').attr('id','pie_chart');
    //生成饼图数据
    const dataset = d3
                    .pie()
                    .sort(null)
                    .value((d) => {
                        return d.value
                    })(data);
    // 获取上面插入的g
    const slices = d3
                    .select('#pie_chart')
                    .append('g')
                    .attr('transform','translate(350,200)')
                    .attr('class','slices')
                    .style('cursor','pointer');
    //生成环形内曲面
    slices
        .selectAll('.innerSlice')
        .data(dataset)
        .enter()
        .append('path')
        .attr('class','innerSlice')
        .style('fill',(d,index) => {
            let colorIndex = index % config.color.length
            return d3.hsl(config.color[colorIndex]).darker(0.7)
        })
        .attr('d',d => {
            return pieInner(d, rx+0.5, ry+0.5, h, ir)
        });
    //上层2D平面
    slices.selectAll('.topSlice')
        .data(dataset)
        .enter()
        .append('path')
        .transition()
        .delay(0)
        .duration(500)
        .attrTween('d',(d) => {
            //动画效果
            let interpolate = d3.interpolate(d.startAngle, d.endAngle);
            return function(t){
                d.endAngle = interpolate(t);
                return pieTop(d, rx, ry, ir)
            }
        })
        .attr('class','topSlice')
        .style('fill',(d,index) => {
            let colorIndex = index % config.color.length
            return config.color[colorIndex]
        })
        .style('stroke',(d,index) => {
            let colorIndex = index % config.color.length
            console.log(config.color[colorIndex],'==config.color[colorIndex]')
            return config.color[colorIndex]
        })
    //侧面曲面
    slices.selectAll('.outerSlice')
    .data(dataset)
    .enter()
    .append('path')
    .transition()
    .delay(0)
    .duration(500)
    .attrTween('d',(d) => {
        //动画效果
        let interpolate = d3.interpolate(d.startAngle, d.endAngle);
        return function(t){
            d.endAngle = interpolate(t);
            return pieOuter(d, rx- 0.5, ry - 0.5, h)
        }
    })
    .attr('class','outerSlice')
    .style('fill',(d,index) => {
        let colorIndex = index % config.color.length
        return d3.hsl(config.color[colorIndex]).darker(0.7)
    });

}
3、创建renderUtils.js文件里面包含渲染3D饼图的算法函数
//生成内曲面
export function pieInner(d,rx,ry,h,ir){
    const startAngle = d.startAngle < Math.PI ? Math.PI : d.startAngle;
    const endAngle = d.endAngle < Math.PI ? Math.PI : d.endAngle;

    const sx = ir * rx * Math.cos(startAngle);
    const sy = ir * ry * Math.sin(startAngle);
    const ex = ir * rx * Math.cos(endAngle);
    const ey = ir * ry * Math.sin(endAngle);

    const ret = [];
    ret.push(
        'M',
        sx,
        sy,
        'A',
        ir * rx,
        ir * ry,
        '0 0 1',
        ex,
        ey,
        'L',
        ex,
        h + ey,
        'A',
        ir * rx,
        ir * ry,
        '0 0 0',
        sx,
        h + sy,
        'z'
    );
    return ret.join(' ');
}
// 生成饼图的顶部
export function pieTop(d, rx, ry, ir) {
    if (d.endAngle - d.startAngle === 0) { return 'M 0 0'; }
    const sx = rx * Math.cos(d.startAngle);
    const sy = ry * Math.sin(d.startAngle);
    const ex = rx * Math.cos(d.endAngle);
    const ey = ry * Math.sin(d.endAngle);

    const ret = [];
    ret.push(
        'M',
        sx,
        sy,
        'A',
        rx,
        ry,
        '0',
        d.endAngle - d.startAngle > Math.PI ? 1 : 0,
        '1',
        ex,
        ey,
        'L',
        ir * ex,
        ir * ey
    );
    ret.push(
        'A',
        ir * rx,
        ir * ry,
        '0',
        d.endAngle - d.startAngle > Math.PI ? 1 : 0,
        '0',
        ir * sx,
        ir * sy,
        'z'
    );
    return ret.join(' ');
}

// 外曲面算法
export function pieOuter(d, rx, ry, h) {
    const startAngle = d.startAngle > Math.PI ? Math.PI : d.startAngle;
    const endAngle = d.endAngle > Math.PI ? Math.PI : d.endAngle;

    const sx = rx * Math.cos(startAngle);
    const sy = ry * Math.sin(startAngle);
    const ex = rx * Math.cos(endAngle);
    const ey = ry * Math.sin(endAngle);

    const ret = [];
    ret.push(
        'M',
        sx,
        h + sy,
        'A',
        rx,
        ry,
        '0 0 1',
        ex,
        h + ey,
        'L',
        ex,
        ey,
        'A',
        rx,
        ry,
        '0 0 0',
        sx,
        sy,
        'z'
    );
    return ret.join(' ');
}
文件运行结果如下,此时已经创建了基本的3D饼图文章来源:https://www.toymoban.com/news/detail-760895.html
 文章来源地址https://www.toymoban.com/news/detail-760895.html
到了这里,关于vue项目基于D3js的3D饼图实现(一)的文章就介绍完了。如果您还想了解更多内容,请在右上角搜索TOY模板网以前的文章或继续浏览下面的相关文章,希望大家以后多多支持TOY模板网!


