什么是数据结构?
下面是维基百科的解释:
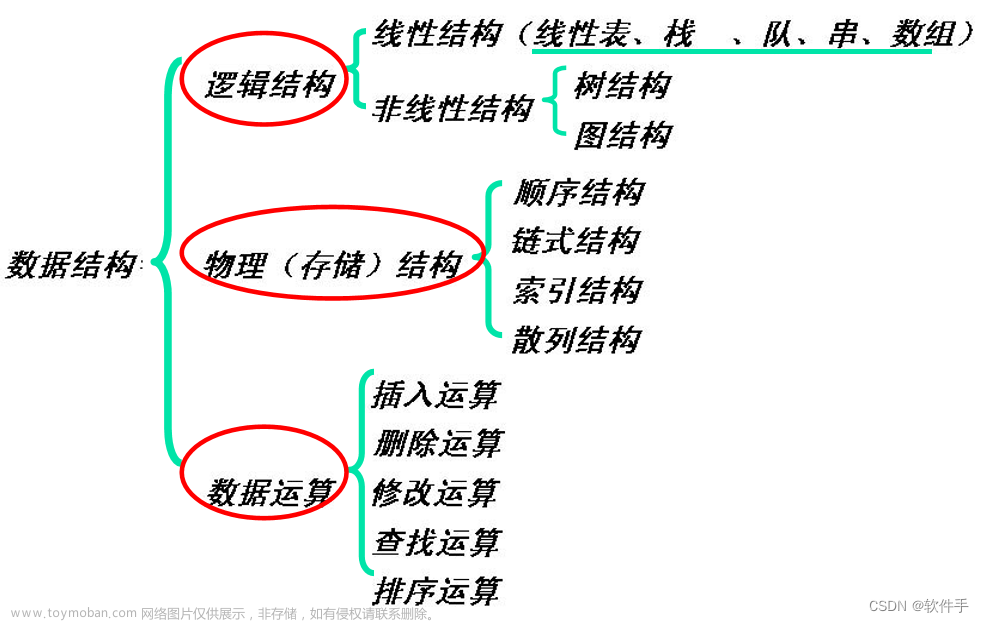
数据结构是计算机存储、组织数据的方式。数据结构意味着接口或封装:一个数据结构可被视为两个函数之间的接口,或者是由数据类型联合组成的存储内容的访问方法封装。
我们每天的编码中都会用到数据结构,下面是常见的数据结构:
- 数组(Array)
- 栈(Stack)
- 队列(Queue)
- 链表(Linked List)
- 散列表(Hash)
- 字典
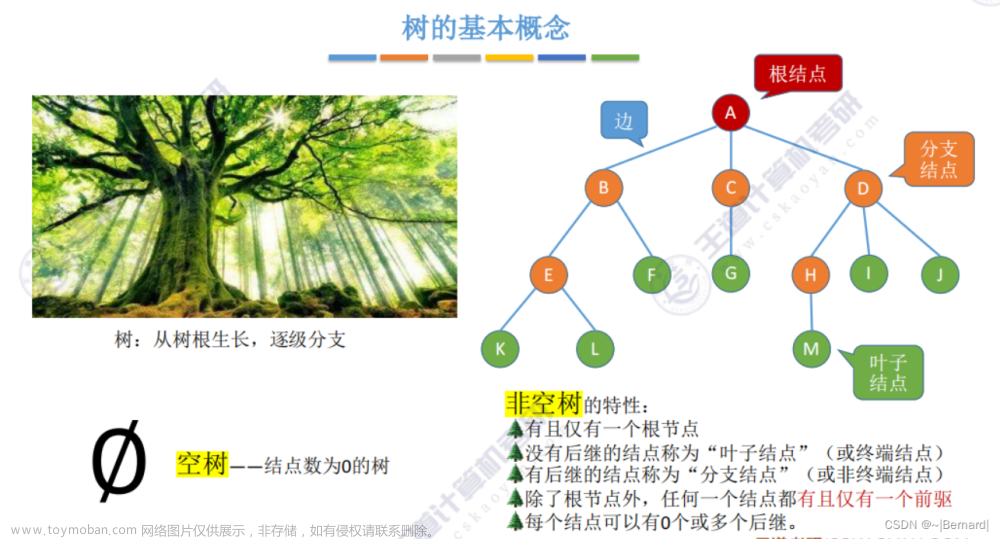
- 树(Tree)
- 图(Graph)
- 堆(Heap)
图(Graph)
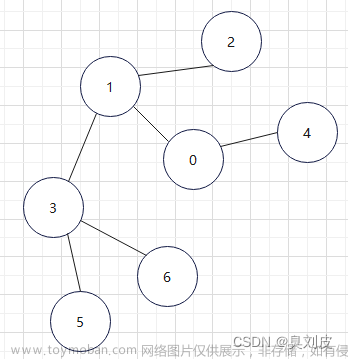
图(Graph)是由节点和边组成的数据结构,用于表示各种不同实体之间的关系。常见的图结构包括社交网络、网站链接图等。
图(Graph)是一种数学结构,由顶点(Vertices)的集合和边(Edges)的集合组成。在计算机科学中,图被广泛用于建模各种实际问题,例如交通系统、运输系统等。下面是一个简单的用JavaScript实现图的案例,以模拟城市之间的交通系统。
HTML 文件: index.html
<!DOCTYPE html>
<html lang="en">

<head>
  <meta charset="UTF-8">
  <title>Graph Simulation</title>
  <style>
    #graph-container {
      display: flex;
      justify-content: center;
      align-items: center;
      height: 300px;
    }
  </style>
</head>

<body>
  <div id="graph-container">
    <canvas id="graph-canvas" width="1000" height="300"></canvas>
  </div>

  <script src="graph.js"></script>
  <script src="simulation.js"></script>
</body>

</html>
JavaScript 文件: graph.js
class Graph {
  constructor() {
    this.vertices = [];
    this.edges = [];
  }

  addVertex(vertex) {
    this.vertices.push(vertex);
  }

  addEdge(vertex1, vertex2, weight = 1) {
    this.edges.push({ vertex1, vertex2, weight });
  }
}

// 示例:创建一个城市交通图
const cityGraph = new Graph();

// 添加城市节点
cityGraph.addVertex("CityA");
cityGraph.addVertex("CityB");
cityGraph.addVertex("CityC");
cityGraph.addVertex("CityD");

// 添加道路(边)
cityGraph.addEdge("CityA", "CityB", 3);
cityGraph.addEdge("CityA", "CityC", 2);
cityGraph.addEdge("CityB", "CityD", 4);
cityGraph.addEdge("CityC", "CityD", 1);
JavaScript 文件: simulation.js
// 获取画布和上下文
const canvas = document.getElementById("graph-canvas");
const ctx = canvas.getContext("2d");

// 绘制图的函数
function drawGraph(graph) {
  // 清空画布
  ctx.clearRect(0, 0, canvas.width, canvas.height);

  // 绘制节点
  graph.vertices.forEach((vertex, index) => {
    const x = 100 + index * 200;
    const y = canvas.height / 2;
    ctx.beginPath();
    ctx.arc(x, y, 30, 0, 2 * Math.PI);
    ctx.fillStyle = "#009688";
    ctx.fill();
    ctx.stroke();

    // 绘制节点标签
    ctx.fillStyle = "#000";
    ctx.font = "14px Arial";
    ctx.fillText(vertex, x - 10, y + 5);
  });

  // 绘制边
  graph.edges.forEach((edge) => {
    const vertex1Index = graph.vertices.indexOf(edge.vertex1);
    const vertex2Index = graph.vertices.indexOf(edge.vertex2);

    const x1 = 100 + vertex1Index * 200;
    const x2 = 100 + vertex2Index * 200;
    const y = canvas.height / 2;

    // 绘制边的线
    ctx.beginPath();
    ctx.moveTo(x1 + 30, y);
    ctx.lineTo(x2 - 30, y);
    ctx.strokeStyle = "#000";
    ctx.lineWidth = 2;
    ctx.stroke();

    // 绘制边的权重
    const weightX = (x1 + x2) / 2;
    const weightY = y - 40;
    ctx.fillStyle = "#000";
    ctx.font = "18px Arial";
    ctx.fillText(edge.weight, weightX, weightY);
  });
}

// 初始化时绘制图
drawGraph(cityGraph);
这个案例创建了一个简单的图,表示城市之间的交通系统。通过HTML文件创建了一个画布,通过JavaScript文件定义了图的结构和绘制函数。simulation.js 文件中的 drawGraph 函数用于绘制图的节点和边。在此案例中,节点表示城市,边表示连接城市的道路,权重表示道路的长度。
你可以在浏览器中打开 index.html 文件,查看模拟的城市交通系统图。这只是一个简单的例子,你可以根据实际需求扩展图的功能和模拟效果。文章来源:https://www.toymoban.com/news/detail-796524.html
持续学习总结记录中,回顾一下上面的内容:
图(Graph)是由节点和边组成的数据结构,用于表示各种不同实体之间的关系。常见的图结构包括社交网络、网站链接图等。文章来源地址https://www.toymoban.com/news/detail-796524.html
到了这里,关于js(JavaScript)数据结构之图(Graph)的文章就介绍完了。如果您还想了解更多内容,请在右上角搜索TOY模板网以前的文章或继续浏览下面的相关文章,希望大家以后多多支持TOY模板网!

