Python论文复现:《基于稀疏指标的优化变分模态分解方法》
信号分解方法中,虽然变分模态分解(Variational Mode Decomposition, VMD)有严格的数学推导,能有效抑制端点效应、模态混叠等问题,但其分解模态数需预设。然而实际工程中,真实信号的频谱较为嘈杂且频带个数较难确定,一般观察分析具体信号的频谱图设置合理的模态数。
相比人工选取方法,自适应选取方法通常定义分解好坏的指标,进一步确定该指标下的最佳模态数。考虑到《基于稀疏指标的优化变分模态分解方法》从IMF频带稀疏性(VMD分解的初衷)的角度寻优,且稀疏指标有严格的理论支撑《信号的稀疏性分析》,故本文对其进行复现。
vmd分解
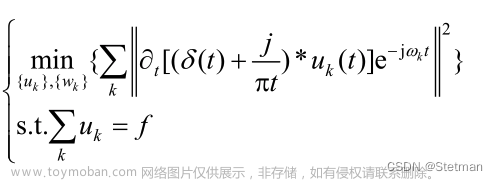
VMD 假定所有分量都是集中在各自中心频率附近的窄带信号,根据分量窄带条件建立约束优化问题,从而估计信号分量的中心频率以及重构相应分量。具体原理不再赘述,由于之前有粉丝不知道我用的什么代码,故在此公开,可单独放在vmdpy.py文件,后面的主程序Auto_VMD.py会调用:
import numpy as np

def  VMD(f, alpha, tau, K, DC, init, tol):
    """
    u,u_hat,omega = VMD(f, alpha, tau, K, DC, init, tol)
    Variational mode decomposition
    Python implementation by Vinícius Rezende Carvalho - vrcarva@gmail.com
    code based on Dominique Zosso's MATLAB code, available at:
    https://www.mathworks.com/matlabcentral/fileexchange/44765-variational-mode-decomposition
    Original paper:
    Dragomiretskiy, K. and Zosso, D. (2014) ‘Variational Mode Decomposition’,
    IEEE Transactions on Signal Processing, 62(3), pp. 531–544. doi: 10.1109/TSP.2013.2288675.


    Input and Parameters:
    ---------------------
    f       - the time domain signal (1D) to be decomposed
    alpha   - the balancing parameter of the data-fidelity constraint
    tau     - time-step of the dual ascent ( pick 0 for noise-slack )
    K       - the number of modes to be recovered
    DC      - true if the first mode is put and kept at DC (0-freq)
    init    - 0 = all omegas start at 0
                       1 = all omegas start uniformly distributed
                      2 = all omegas initialized randomly
    tol     - tolerance of convergence criterion; typically around 1e-6

    Output:
    -------
    u       - the collection of decomposed modes
    u_hat   - spectra of the modes
    omega   - estimated mode center-frequencies
    """

    if len(f)%2:
       f = f[:-1]

    # Period and sampling frequency of input signal
    fs = 1./len(f)

    ltemp = len(f)//2
    fMirr =  np.append(np.flip(f[:ltemp],axis = 0),f)
    fMirr = np.append(fMirr,np.flip(f[-ltemp:],axis = 0))

    # Time Domain 0 to T (of mirrored signal)
    T = len(fMirr)
    t = np.arange(1,T+1)/T

    # Spectral Domain discretization
    freqs = t-0.5-(1/T)

    # Maximum number of iterations (if not converged yet, then it won't anyway)
    Niter = 500
    # For future generalizations: individual alpha for each mode
    Alpha = alpha*np.ones(K)

    # Construct and center f_hat
    f_hat = np.fft.fftshift((np.fft.fft(fMirr)))
    f_hat_plus = np.copy(f_hat) #copy f_hat
    f_hat_plus[:T//2] = 0

    # Initialization of omega_k
    omega_plus = np.zeros([Niter, K])


    if init == 1:
        for i in range(K):
            omega_plus[0,i] = (0.5/K)*(i)
    elif init == 2:
        omega_plus[0,:] = np.sort(np.exp(np.log(fs) + (np.log(0.5)-np.log(fs))*np.random.rand(1,K)))
    else:
        omega_plus[0,:] = 0

    # if DC mode imposed, set its omega to 0
    if DC:
        omega_plus[0,0] = 0

    # start with empty dual variables
    lambda_hat = np.zeros([Niter, len(freqs)], dtype = complex)

    # other inits
    uDiff = tol+np.spacing(1) # update step
    n = 0 # loop counter
    sum_uk = 0 # accumulator
    # matrix keeping track of every iterant // could be discarded for mem
    u_hat_plus = np.zeros([Niter, len(freqs), K],dtype=complex)

    #*** Main loop for iterative updates***

    while ( uDiff > tol and  n < Niter-1 ): # not converged and below iterations limit
        # update first mode accumulator
        k = 0
        sum_uk = u_hat_plus[n,:,K-1] + sum_uk - u_hat_plus[n,:,0]

        # update spectrum of first mode through Wiener filter of residuals
        u_hat_plus[n+1,:,k] = (f_hat_plus - sum_uk - lambda_hat[n,:]/2)/(1.+Alpha[k]*(freqs - omega_plus[n,k])**2)

        # update first omega if not held at 0
        if not(DC):
            omega_plus[n+1,k] = np.dot(freqs[T//2:T],(abs(u_hat_plus[n+1, T//2:T, k])**2))/np.sum(abs(u_hat_plus[n+1,T//2:T,k])**2)

        # update of any other mode
        for k in np.arange(1,K):
            #accumulator
            sum_uk = u_hat_plus[n+1,:,k-1] + sum_uk - u_hat_plus[n,:,k]
            # mode spectrum
            u_hat_plus[n+1,:,k] = (f_hat_plus - sum_uk - lambda_hat[n,:]/2)/(1+Alpha[k]*(freqs - omega_plus[n,k])**2)
            # center frequencies
            omega_plus[n+1,k] = np.dot(freqs[T//2:T],(abs(u_hat_plus[n+1, T//2:T, k])**2))/np.sum(abs(u_hat_plus[n+1,T//2:T,k])**2)

        # Dual ascent
        lambda_hat[n+1,:] = lambda_hat[n,:] + tau*(np.sum(u_hat_plus[n+1,:,:],axis = 1) - f_hat_plus)

        # loop counter
        n = n+1

        # converged yet?
        uDiff = np.spacing(1)
        for i in range(K):
            uDiff = uDiff + (1/T)*np.dot((u_hat_plus[n,:,i]-u_hat_plus[n-1,:,i]),np.conj((u_hat_plus[n,:,i]-u_hat_plus[n-1,:,i])))

        uDiff = np.abs(uDiff)

    #Postprocessing and cleanup

    #discard empty space if converged early
    Niter = np.min([Niter,n])
    omega = omega_plus[:Niter,:]

    idxs = np.flip(np.arange(1,T//2+1),axis = 0)
    # Signal reconstruction
    u_hat = np.zeros([T, K],dtype = complex)
    u_hat[T//2:T,:] = u_hat_plus[Niter-1,T//2:T,:]
    u_hat[idxs,:] = np.conj(u_hat_plus[Niter-1,T//2:T,:])
    u_hat[0,:] = np.conj(u_hat[-1,:])

    u = np.zeros([K,len(t)])
    for k in range(K):
        u[k,:] = np.real(np.fft.ifft(np.fft.ifftshift(u_hat[:,k])))

    # remove mirror part
    u = u[:,T//4:3*T//4]

    # recompute spectrum
    u_hat = np.zeros([u.shape[1],K],dtype = complex)
    for k in range(K):
        u_hat[:,k]=np.fft.fftshift(np.fft.fft(u[k,:]))

    return u, u_hat, omega
边际谱
论文作者是在每个IMF的边际谱上计算稀疏化指标,而边际谱是希尔伯特谱在时间维度上的积分。笔者首先将求边际谱的代码函数化,由于需要进行希尔伯特变换,本代码需要调用PyEMD与scipy库。
h
(
z
)
=
∫
0
T
H
(
t
,
f
)
d
t
h(z) = \int_0^T H(t,f)dt\
h(z)=∫0TH(t,f)dt
from PyEMD import Visualisation
from scipy.signal import hilbert

#求窄带信号的边际谱
def mspect(Fs,signal,draw=1):
    fmin,fmax=0,Fs/2
    size=len(signal)//2
    df=(fmax-fmin)/(size-1)
    t=np.arange(0,len(signal)/Fs,1/Fs)
    vis = Visualisation()
    #希尔伯特变化
    signal=signal.reshape(1,-1)
    #求瞬时频率
    freqs = abs(vis._calc_inst_freq(signal, t, order=False, alpha=None))
    #求瞬时幅值
    amp= abs(hilbert(signal))
    #去掉为1的维度
    freqs=np.squeeze(freqs)
    amp=np.squeeze(amp)
    result=np.zeros(size)
    for i,j in zip(freqs,amp):
        if i>=fmin and i<=fmax:
            result[round((i-fmin)/df)]+=j

    f=np.arange(fmin,size*df,df)
    #可视化
    if draw==1:                           #可视化
        plt.figure()
        plt.rcParams['font.sans-serif']='Times New Roman'
        plt.plot(f,result)
        plt.xlabel('f/HZ',fontsize=16)
        plt.ylabel('amplitude',fontsize=16)
        plt.title('Marginal Spectrum',fontsize=20)

    return f,result
基于稀疏指标自适应寻找最佳分解K值
总结论文思路如下:
1)初始化VMD参数,惩罚因子
α
\alpha
α为3000,拉格朗日乘子更新因子为0.01,分解模态数K为2;
2)VMD分解并计算各IMF的边际谱,计算各IMF的稀疏度(考虑了能量权值因子);
S i = max { M S i } max { max { M S 1 } ⋯ max { M S k } } { E ( M S i 2 ) / [ E ( M S i ) ] 2 } {S}_{i}=\frac{\max \left\{ M{{S}_{i}} \right\}}{\max \left\{ \max \left\{ M{{S}_{1}} \right\}\cdots \max \left\{ M{{S}_{k}} \right\} \right\}}\left\{ E(MS_{i}^{2})/{{\left[ E(M{{S}_{i}}) \right]}^{2}} \right\} Si=max{max{MS1}⋯max{MSk}}max{MSi}{E(MSi2)/[E(MSi)]2}
3)取各IMF边际谱稀疏度作为该分解模态数K下的整体稀疏度;
S K = 1 K ∑ i = 1 K S i {{S}_{K}}=\frac{1}{K}\sum\limits_{i=1}^{K}{{{S}_{i}}} SK=K1i=1∑KSi
4)当
S
K
<
S
K
−
1
(
K
>
2
)
{{S}_{K}}<{{S}_{K-1}}(K>2)
SK<SK−1(K>2)时,选取最佳分解模态数为K-1,进入步骤5),反之令
K
=
K
+
1
K=K+1
K=K+1回到步骤2)继续迭代;
5)采用最佳的分解模态数进行VMD分解。
该文在确定最佳分解模态数时是选取第一个极大值点,或者稀疏度随K单调递减时,选取第一个点2。然而,实际信号极值点可能不为最大值点,且若出现先递减后递增(稀疏度大于K=2)的情况时,该方法无法取到最佳K值。
本人对选取方法做了一点小改变,即:预设最大K值(依据信号复杂度设置,本人取10),计算K从2至最大值期间的稀疏度,取最大稀疏度对应的K值作为最佳分解模态数。主函数Auto_VMD.py具体代码如下(画时频图的代码,我之前的博文有):
from vmdpy import VMD
import matplotlib.pyplot as plt
import numpy as np
from PyEMD import Visualisation
from scipy.signal import hilbert

#求窄带信号的边际谱
def mspect(Fs,signal,draw=1):
    fmin,fmax=0,Fs/2
    size=len(signal)//2
    df=(fmax-fmin)/(size-1)
    t=np.arange(0,len(signal)/Fs,1/Fs)
    vis = Visualisation()
    #希尔伯特变化
    signal=signal.reshape(1,-1)
    #求瞬时频率
    freqs = abs(vis._calc_inst_freq(signal, t, order=False, alpha=None))
    #求瞬时幅值
    amp= abs(hilbert(signal))
    #去掉为1的维度
    freqs=np.squeeze(freqs)
    amp=np.squeeze(amp)
    result=np.zeros(size)
    for i,j in zip(freqs,amp):
        if i>=fmin and i<=fmax:
            result[round((i-fmin)/df)]+=j

    f=np.arange(fmin,size*df,df)
    #可视化
    if draw==1:                           #可视化
        plt.figure()
        plt.rcParams['font.sans-serif']='Times New Roman'
        plt.plot(f,result)
        plt.xlabel('f/HZ',fontsize=16)
        plt.ylabel('amplitude',fontsize=16)
        plt.title('Marginal Spectrum',fontsize=20)

    return f,result


#基于稀疏指标自适应确定K值的VMD分解
def Auto_VMD_main(signal,Fs,draw=1,maxK=10):

    #vmd参数设置
    alpha = 3000       # moderate bandwidth constraint   2000
    tau = 0.            # noise-tolerance (no strict fidelity enforcement)
    DC = 0             # no DC part imposed
    init = 1           # initialize omegas uniformly
    tol = 1e-7

    #寻找最佳K
    S=[[],[]]
    flag,idx=-2,2
    for K in range(2,maxK+1):
        IMFs,_,_=VMD(signal, alpha, tau, K, DC, init, tol)                                    #分解信号
        M_spect=[]
        max_M=[]
        for i in range(len(IMFs)):
            # _,_=fftlw(Fs,IMFs[i,:],1)
            _,M=mspect(Fs,IMFs[i,:],0)
            max_M.append(max(M))
            temp=np.mean(M**2)/(np.mean(M)**2)
            M_spect.append(temp)

        max_M=max_M/max(max_M)
        S_index=np.mean(max_M*M_spect)
        if S_index>flag:
            flag=S_index
            idx=K
        S[0].append(K)
        S[1].append(S_index)


    #用最佳K值分解信号
    IMFs, _, _ = VMD(signal, alpha, tau, idx, DC, init, tol)
    #可视化寻优过程与最终结果
    if draw==1:
        plt.figure()
        plt.rcParams['font.sans-serif']='Times New Roman'
        plt.plot(S[0],S[1])
        plt.scatter([idx],[flag],c='r',marker='*')
        plt.xlabel('K',fontsize=16)
        plt.ylabel('Sparse index',fontsize=16)
        plt.title('Optimization Process',fontsize=20)

        plt.figure()
        for i in range(len(IMFs)):
            plt.subplot(len(IMFs),1,i+1)
            plt.plot(t,IMFs[i])
            if i==0:
                plt.rcParams['font.sans-serif']='Times New Roman'
                plt.title('Decomposition Signal',fontsize=14)
            elif i==len(IMFs)-1:
                plt.rcParams['font.sans-serif']='Times New Roman'
                plt.xlabel('Time/s')
    return IMFs

if __name__=='__main__':
      #仿真信号1
      Fs=6000   #采样频率
      t = np.arange(0, 1.0, 1.0 / Fs)
      signal=np.multiply(np.sin(2*np.pi*100*t),(np.cos(2*np.pi*1000*t)+np.cos(2*np.pi*1500*t)+np.cos(2*np.pi*2000*t)))

      # #仿真信号2
      # Fs=1000   #采样频率
      # t = np.arange(0, 1.0, 1.0 / Fs)
      # f1,f2,f3 = 100,200,300
      # signal = np.piecewise(t, [t < 1, t < 0.6, t < 0.3],
      #                     [lambda t: np.sin(2 * np.pi * f1 * t), lambda t: np.sin(2 * np.pi * f2 * t),
      #                       lambda t: np.sin(2 * np.pi * f3 * t)])
      # #仿真信号3
      # Fs=1000   #采样频率
      # t = np.arange(0, 1.0, 1.0 / Fs)
      # f1,f2,f3 = 100,200,300
      # signal = 3*np.sin(2*np.pi*f1*t)+6*np.sin(2*np.pi*f2*t)+5*np.sin(2*np.pi*f3*t)

      IMFs=Auto_VMD_main(signal,Fs,draw=1,maxK=10)

      from eemd_hht import hhtlw
      tt,ff,c_matrix=hhtlw(IMFs,t,f_range=[0,Fs/2],t_range=[0,t[-1]],ft_size=[128,128])     #画希尔伯特谱
仿真信号分析
仿真如下信号验证,采样频率为6000 Hz,信号时间长度为1 s:
y = sin ( 2 π f 1 t ) ∗ [ cos ( 2 π f 2 t ) + cos ( 2 π f 3 t ) + cos ( 2 π f 4 t ) ] y=\sin \left( 2\pi {{f}_{1}}t \right)*\left[ \cos \left( 2\pi {{f}_{2}}t \right)+\cos \left( 2\pi {{f}_{3}}t \right)+\cos \left( 2\pi {{f}_{4}}t \right) \right] y=sin(2πf1t)∗[cos(2πf2t)+cos(2πf3t)+cos(2πf4t)]
f
1
,
f
2
,
f
3
,
f
4
=
100
,
1000
,
1500
,
2000
{{f}_{1}},{{f}_{2}},{{f}_{3}},{{f}_{4}}=100,1000,1500,2000
f1,f2,f3,f4=100,1000,1500,2000
由于傅里叶变化的思想是采用标准正弦波来拟合信号,而本文信号由于出现正弦波相乘,经过三角函数积化和差可转换为6个正弦波,故原始信号频谱包含6个频率成分。
y
=
1
2
sin
(
2
π
(
f
1
+
f
2
)
t
)
+
sin
(
2
π
(
f
1
−
f
2
)
t
)
+
sin
(
2
π
(
f
1
+
f
3
)
t
)
+
y=\frac{1}{2}\sin \left( 2\pi \left( {{f}_{1}}+{{f}_{2}} \right)t \right)+\sin \left( 2\pi \left( {{f}_{1}}-{{f}_{2}} \right)t \right)+\sin \left( 2\pi \left( {{f}_{1}}+{{f}_{3}} \right)t \right)+
y=21sin(2π(f1+f2)t)+sin(2π(f1−f2)t)+sin(2π(f1+f3)t)+
sin
(
2
π
(
f
1
−
f
3
)
t
)
+
sin
(
2
π
(
f
1
+
f
4
)
t
)
+
sin
(
2
π
(
f
1
−
f
4
)
t
)
\sin \left( 2\pi \left( {{f}_{1}}-{{f}_{3}} \right)t \right)+\sin \left( 2\pi \left( {{f}_{1}}+{{f}_{4}} \right)t \right)+\sin \left( 2\pi \left( {{f}_{1}}-{{f}_{4}} \right)t \right)
sin(2π(f1−f3)t)+sin(2π(f1+f4)t)+sin(2π(f1−f4)t)
原始信号的时域图与频谱图如下:
采用稀疏度自动寻找最佳K值为6,寻优过程以及分解后的时频图如下: 文章来源:https://www.toymoban.com/news/detail-798550.html
转子试验台数据分析
采用转子试验台数据(无故障状态)分析,采样频率为30720 Hz,样本长度为1024,原始时域及频域图如下,大致可以分为6-8个频带,图中圈圈为本方法确定的最佳模态分量数下各IMF的频带中心,基本符合信号包含的窄带个数: 采用稀疏度自动寻找最佳K值为6,寻优过程以及分解后的时频图如下:
 各IMF的边际谱如下,基本对应频谱中的各频率成分:
 文章来源地址https://www.toymoban.com/news/detail-798550.html
到了这里,关于Python论文复现:VMD之自适应选择分解模态数K值的文章就介绍完了。如果您还想了解更多内容,请在右上角搜索TOY模板网以前的文章或继续浏览下面的相关文章,希望大家以后多多支持TOY模板网!

