需求:
使用arcgis javascript api4.x以basetilelayer方式加载天地图wgs84(wkid:4326)坐标系
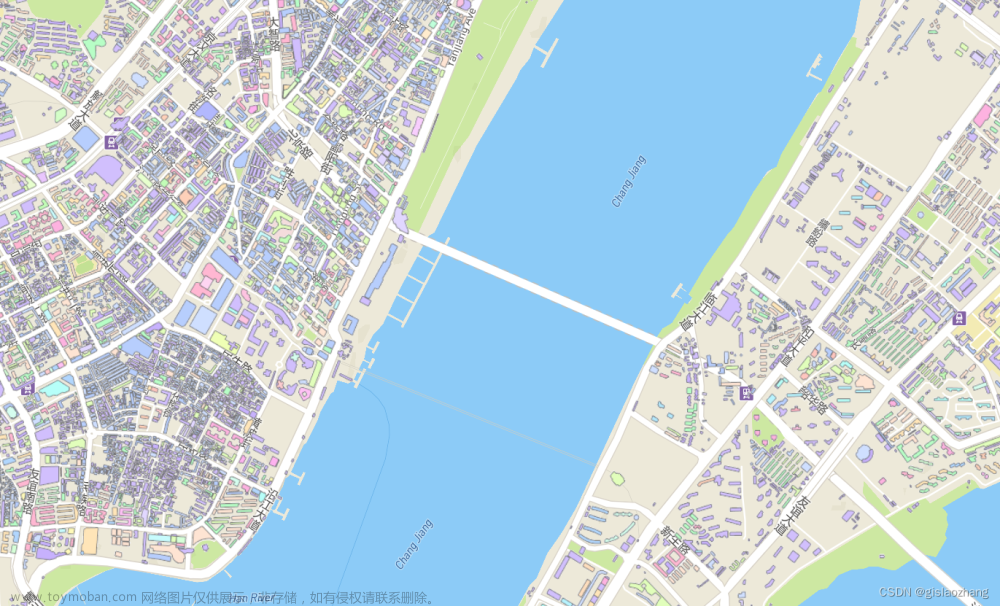
效果:

代码:
提示:(下述三个文件放同一个文件夹下)
4326.js
define(['exports', 'esri/layers/support/TileInfo', 'esri/config'], function (
    exports,
    TileInfo,
    esriConfig
  ) {
    'use strict'
    const lods = [
      {
        level: 1,
        levelValue: 1,
        resolution: 0.703125,
        scale: 295497593.05875003
      },
      {
        level: 2,
        levelValue: 2,
        resolution: 0.3515625,
        scale: 147748796.52937502
      },
      {
        level: 3,
        levelValue: 3,
        resolution: 0.17578125,
        scale: 73874398.264687508
      },
      {
        level: 4,
        levelValue: 4,
        resolution: 0.087890625,
        scale: 36937199.132343754
      },
      {
        level: 5,
        levelValue: 5,
        resolution: 0.0439453125,
        scale: 18468599.566171877
      },
      {
        level: 6,
        levelValue: 6,
        resolution: 0.02197265625,
        scale: 9234299.7830859385
      },
      {
        level: 7,
        levelValue: 7,
        resolution: 0.010986328125,
        scale: 4617149.8915429693
      },
      {
        level: 8,
        levelValue: 8,
        resolution: 0.0054931640625,
        scale: 2308574.9457714846
      },
      {
        level: 9,
        levelValue: 9,
        resolution: 0.00274658203125,
        scale: 1154287.4728857423
      },
      {
        level: 10,
        levelValue: 10,
        resolution: 0.001373291015625,
        scale: 577143.73644287116
      },
      {
        level: 11,
        levelValue: 11,
        resolution: 0.0006866455078125,
        scale: 288571.86822143558
      },
      {
        level: 12,
        levelValue: 12,
        resolution: 0.00034332275390625,
        scale: 144285.93411071779
      },
      {
        level: 13,
        levelValue: 13,
        resolution: 0.000171661376953125,
        scale: 72142.967055358895
      },
      {
        level: 14,
        levelValue: 14,
        resolution: 8.58306884765625e-5,
        scale: 36071.483527679447
      },
      {
        level: 15,
        levelValue: 15,
        resolution: 4.291534423828125e-5,
        scale: 18035.741763839724
      },
      {
        level: 16,
        levelValue: 16,
        resolution: 2.1457672119140625e-5,
        scale: 9017.8708819198619
      },
      {
        level: 17,
        levelValue: 17,
        resolution: 1.0728836059570313e-5,
        scale: 4508.9354409599309
      },
      {
        level: 18,
        levelValue: 18,
        resolution: 5.3644180297851563e-6,
        scale: 2254.4677204799655
      },
      {
        level: 19,
        levelValue: 19,
        resolution: 2.68220901489257815e-6,
        scale: 1127.23386023998275
      },
      {
        level: 20,
        levelValue: 2,
        resolution: 1.341104507446289075e-6,
        scale: 563.616930119991375
      }
    ]

    const tileInfo = new TileInfo({
      dpi: 90.71428571427429,
      rows: 256,
      cols: 256,
      format: 'image/png',
      compressionQuality: 0,
      origin: {
        x: -180,
        y: 90
      },
      spatialReference: {
        wkid: 4326
      },
      lods: lods
    })

    exports.tileInfo = tileInfo
    exports.lods = lods
  })
MyCustomTileLayer.js
define(['exports', "esri/layers/BaseTileLayer","esri/request"], function (
    exports,
    BaseTileLayer,
    esriRequest
  ) {
    const MyCustomTileLayer = BaseTileLayer.createSubclass({
            // properties of the custom tile layer
            properties: {
              urlTemplate: null,
            },

          // override getTileUrl()
          // generate the tile url for a given level, row and column
          getTileUrl: function (level, row, col) {
            return this.urlTemplate.replace("{level}", level).replace("{col}", col).replace("{row}", row);
          },

          // This method fetches tiles for the specified level and size.
          // Override this method to process the data returned from the server.
          fetchTile: function (level, row, col, options) {

            // call getTileUrl() method to construct the URL to tiles
            // for a given level, row and col provided by the LayerView
            var url = this.getTileUrl(level, row, col);

            // request for tiles based on the generated url
            // the signal option ensures that obsolete requests are aborted
            return esriRequest(url, {
              responseType: "image",
              //signal: options && options.signal
               allowImageDataAccess: true
            })
              .then(function (response) {
                // when esri request resolves successfully
                // get the image from the response
                var image = response.data;
                var width = this.tileInfo.size[0];
                var height = this.tileInfo.size[0];

                // create a canvas with 2D rendering context
                var canvas = document.createElement("canvas");
                var context = canvas.getContext("2d");
                canvas.width = width;
                canvas.height = height;

                // Apply the tint color provided by
                // by the application to the canvas
                if (this.tint) {
                  // Get a CSS color string in rgba form
                  // representing the tint Color instance.
                  context.fillStyle = this.tint.toCss();
                  context.fillRect(0, 0, width, height);

                  // Applies "difference" blending operation between canvas
                  // and steman tiles. Difference blending operation subtracts
                  // the bottom layer (canvas) from the top layer (tiles) or the
                  // other way round to always get a positive value.
                  context.globalCompositeOperation = "difference";
                }

                // Draw the blended image onto the canvas.
                context.drawImage(image, 0, 0, width, height);

                return canvas;
              }.bind(this));
          }

        });

  return MyCustomTileLayer;
  })
loadtdt4326.html文章来源:https://www.toymoban.com/news/detail-798679.html
<html>
    <head>
        <meta charset="utf-8" />
        <meta name="viewport" content="initial-scale=1, maximum-scale=1,user-scalable=no" />
        <title>(经纬度)天地图加载</title>
        <style>
            html,
            body,
            #viewDiv {
                width: 100%;
            height: 100%;
            padding: 0;
            margin: 0;
            }
        </style>
        <link rel="stylesheet" href="https://js.arcgis.com/4.23/esri/css/main.css" />
        <script src="https://js.arcgis.com/4.23/init.js"></script>
        <script>
            require(["esri/Map",
                "esri/views/MapView",
                "esri/layers/GraphicsLayer",
                "esri/Graphic",
                "esri/PopupTemplate",
                "esri/widgets/Popup",
                "esri/layers/MapImageLayer",
                "esri/widgets/Legend",
                "esri/layers/WebTileLayer",
                "esri/layers/WMTSLayer",
                "esri/widgets/BasemapGallery/support/LocalBasemapsSource",
                "esri/widgets/BasemapGallery",
                "esri/Basemap",
                "esri/layers/FeatureLayer",
                "esri/geometry/Extent",
                "esri/geometry/SpatialReference",
                'esri/config',
                './4326.js',

                'esri/layers/support/TileInfo',
                "./MyCustomTileLayer.js",
                "esri/layers/TileLayer",
            ], function(
                Map,
                MapView,
                GraphicsLayer,
                Graphic,
                PopupTemplate,
                Popup,
                MapImageLayer,
                Legend,
                WebTileLayer,
                WMTSLayer,
                LocalBasemapsSource,
                BasemapGallery,
                Basemap,
                FeatureLayer,
                Extent,
                SpatialReference,
                esriConfig,
                epsg4326,

                TileInfo,
                MyCustomTileLayer,
                TileLayer
            ) {
                var tileInfo = epsg4326.tileInfo;
                var key = "天地图key"
                key = "6a92e00bdfafade25568c053a5ba6de4"
                var tiledLayer = new MyCustomTileLayer({
                    urlTemplate: "http://t0.tianditu.gov.cn/img_c/wmts?SERVICE=WMTS&REQUEST=GetTile&VERSION=1.0.0&LAYER=img&STYLE=default&TILEMATRIXSET=c&FORMAT=tiles&TileMatrix={level}&TileCol={col}&TileRow={row}&tk=" +
                        key,
                    tileInfo: tileInfo,
                    id: '影像',
                    listMode: 'hide' //这个属性设置是为了在layerlist不显示出来
                });
                var tiledLayer_poi = new MyCustomTileLayer({
                    urlTemplate: "http://t0.tianditu.gov.cn/cia_c/wmts?SERVICE=WMTS&REQUEST=GetTile&VERSION=1.0.0&LAYER=cia&STYLE=default&TILEMATRIXSET=c&FORMAT=tiles&TileMatrix={level}&TileCol={col}&TileRow={row}&tk=" +
                        key,
                    tileInfo: tileInfo,
                    id: '影像标记',
                    listMode: 'hide'
                });
                var tiledLayer1 = new MyCustomTileLayer({
                    urlTemplate: "http://t0.tianditu.gov.cn/vec_c/wmts?SERVICE=WMTS&REQUEST=GetTile&VERSION=1.0.0&LAYER=vec&STYLE=default&TILEMATRIXSET=c&FORMAT=tiles&TileMatrix={level}&TileCol={col}&TileRow={row}&tk=" +
                        key,
                    tileInfo: tileInfo,
                    id: '矢量',
                    visible: false,
                    listMode: 'hide'
                });
                var tiledLayer_poi1 = new MyCustomTileLayer({
                    urlTemplate: "http://t0.tianditu.gov.cn/cva_c/wmts?SERVICE=WMTS&REQUEST=GetTile&VERSION=1.0.0&LAYER=cva&STYLE=default&TILEMATRIXSET=c&FORMAT=tiles&TileMatrix={level}&TileCol={col}&TileRow={row}&tk=" +
                        key,
                    tileInfo: tileInfo,
                    id: '矢量标记',
                    visible: false,
                    listMode: 'hide'
                });


                var basemap = new Basemap({
                    baseLayers: [tiledLayer, tiledLayer_poi, tiledLayer1, tiledLayer_poi1],
                })
                var map = new Map({
                    basemap: basemap
                });


                var view = new MapView({
                    container: "viewDiv",
                    map: map,
                    spatialReference: {
                        wkid: 4326
                    },
                    scale: tileInfo.lods[7],
                    center: [114.3115879,30.5943680], //113.27434372047993,22.722786885699826
                    linked: false,
                    zoom:7,
                    constraints: {
                      lods: tileInfo.lods,
                      minScale: tileInfo.lods[0].scale,
                      maxScale: tileInfo.lods[19].scale
                    },
                });

                // view.extent = new Extent({
                //   xmin: 113.36595023855007,
                //   ymin: 23.671927965183833,
                //   xmax: 114.5628763484501,
                //   ymax: 22.7009907263257,
                //   spatialReference: {
                //     wkid: 4326
                //   }
                // });


            });
        </script>
    </head>

    <body class="calcite">
        <div id="viewDiv"></div>
    </body>
</html>
参考资料:
https://www.cnblogs.com/hjyjack9563-bk/p/16067633.html文章来源地址https://www.toymoban.com/news/detail-798679.html
到了这里,关于arcgis javascript api4.x加载天地图wgs84(wkid:4326)坐标系的文章就介绍完了。如果您还想了解更多内容,请在右上角搜索TOY模板网以前的文章或继续浏览下面的相关文章,希望大家以后多多支持TOY模板网!