Prometheus + Grafana 实现服务器的可视化
系统环境准备:
服务器IP:172.20.26.204
系统版本:CentOS Linux release 7.9.2009 (Core)
安装基础工具软件,系统更新
yum install vim net-tools epel-release wget -y
yum update
Prometheus 简介
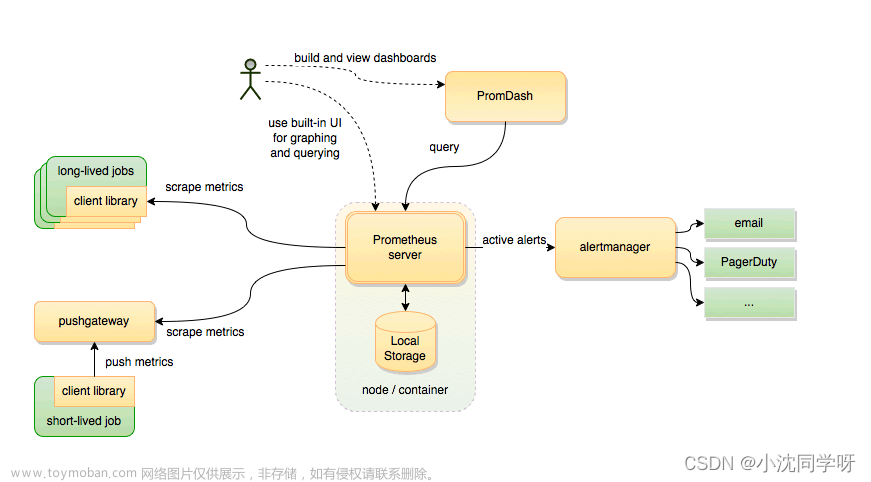
Prometheus 是一个开源监控工具,实现了高维数据模型。Prometheus 有多种数据可视化模式,其中一种是集成 Grafana。Prometheus 以高效的自定义格式将时间序列数据存储在内存和本地磁盘上。
Prometheus 有许多客户端可用于轻松监控服务,也可以轻松创建自定义客户端。每台服务器的可靠性都是独立的,仅依赖本地存储。用 Golang 编程语言编写,所有二进制文件都是静态链接的,易于部署。
Prometheus 采用拉取策略而不是推送策略,即 Prometheus 以一定的时间间隔从 exporter 那里拉取数据,而不是 exporter推送数据到 Prometheus。这种方式有其自身的优点和缺点,但我们不讨论这些细节。
node_exporter 简介
在 Prometheus 的架构设计中,Prometheus Server 主要负责数据的收集,存储并且对外提供数据查询支持,而实际的监控样本数据的收集则是由 Exporter 完成。
Exporter 可以是一个相对开放的概念,其可以是一个独立运行的程序独立于监控目标以外,也可以是直接内置在监控目标中。只要能够向 Prometheus 提供标准格式的监控样本数据即可
为了能够采集到主机的运行指标如CPU, 内存,磁盘等信息。我们可以使用Node Exporter。Node Exporter 同样采用 Golang 编写,并且不存在任何的第三方依赖,只需要下载,解压即可运行。可以从 https://prometheus.io/download/ 获取最新的 node exporter 版本的二进制包。
Grafana 简介
Grafana 是一款开源可视化和分析软件,它允许你查询、可视化、提醒和探索您的指标,无论这些指标存储在哪里。Grafana 支持数十种数据库,我们可以创建一个仪表盘来可视化它们全部。
Grafana 还提供报警,直观地定义阀值,并通过 Slack、 PagerDuty 和其他平台获得通知。Grafana 还提供了多种选项来查看我们的数据,从热力图到直方图,从图形到地理地图。Grafana 有大量的可视化选项可以帮助我们更好地理解数据。我正在使用 Ubuntu 18.04,并将显示与其相关的整个配置。
一、Prometheus 安装

Download | Prometheus 查看prometheus版本列表
cd /data/server
wget https://github.com/prometheus/prometheus/releases/download/v2.46.0/prometheus-2.46.0.linux-amd64.tar.gz #下载2.46.0.linux-amd64.tar.gz
tar -xzf prometheus-2.46.0.linux-amd64.tar.gz
cd prometheus-2.46.0.linux-amd64

设置以服务方式启动prometheus服务
vim /etc/systemd/system/prometheus.service
[Unit]
Description=Prometheus Monitoring System
Documentation=Prometheus Monitoring System
[Service]
ExecStart=/data/server/prometheus-2.46.0.linux-amd64/prometheus \
--config.file=/data/server/prometheus-2.46.0.linux-amd64/prometheus.yml \
--web.listen-address=:9090
[Install]
WantedBy=multi-user.target
保存退出
启动服务,设置开机自启
systemctl daemon-reload
systemctl enable prometheus
systemctl start prometheus

http://172.20.26.204:9090/

点击:status – targets
prometheus 是 up 状态,表示安装启动成功

停止Prometheus 服务:
[root@bogon prometheus-2.46.0.linux-amd64]#ps -ef | grep Prometheus
[root@bogon prometheus-2.46.0.linux-amd64]# ps -ef | grep prometheus
root 31691 1 0 16:11 ? 00:00:01 /data/server/prometheus-2.46.0.linux-amd64/prometheus --config.file=/data/server/prometheus-2.46.0.linux-amd64/prometheus.yml --web.listen-address=:9090
root 31717 31623 0 16:38 pts/1 00:00:00 grep --color=auto prometheus
[root@bogon prometheus-2.46.0.linux-amd64]# kill -9 31691

wget https://github.com/prometheus/prometheus/releases/download/v2.21.0/prometheus-2.21.0.linux-amd64.tar.gz
tar -xzf prometheus-2.21.0.linux-amd64.tar.gz
cd prometheus-2.21.0.linux-amd64/
./Prometheus & #启动Prometheus服务
nohup ./prometheus --config.file=prometheus.yml > ./prometheus.log 2>&1 & #启动 prometheus 服务
也可以以服务方式启动
vim /etc/systemd/system/prometheus.service
[Unit]
Description=Prometheus Monitoring System
Documentation=Prometheus Monitoring System
[Service]
ExecStart=/usr/local/prometheus/prometheus \
--config.file=/usr/local/prometheus/prometheus.yml \
--web.listen-address=:9090
[Install]
WantedBy=multi-user.target
如果 wget tar.gz 包时报如下错误,

[root@bogon server]# wget https://github.com/prometheus/prometheus/releases/download/v2.21.0/prometheus-2.21.0.linux-amd64.tar.gz
--2023-08-04 09:31:43-- https://github.com/prometheus/prometheus/releases/download/v2.21.0/prometheus-2.21.0.linux-amd64.tar.gz
正在解析主机 github.com (github.com)... 20.205.243.166
正在连接 github.com (github.com)|20.205.243.166|:443... 已连接。
无法建立 SSL 连接。
需要在hosts文件添加如下解析地址:
vim /etc/hosts
199.232.69.194 github.global.ssl.fastly.net
140.82.112.4 www.github.com
185.199.108.153 assets-cdn.github.com
185.199.109.153 assets-cdn.github.com
185.199.110.153 assets-cdn.github.com
185.199.111.153 assets-cdn.github.com
185.199.108.153 documentcloud.github.com
185.199.109.153 documentcloud.github.com
185.199.110.153 documentcloud.github.com
185.199.111.153 documentcloud.github.com
140.82.114.3 gist.github.com
185.199.108.153 help.github.com
185.199.109.153 help.github.com
185.199.110.153 help.github.com
185.199.111.153 help.github.com
140.82.112.9 nodeload.github.com
199.232.68.133 raw.github.com
140.82.112.18 status.github.com
140.82.113.18 training.github.com
199.232.68.133 raw.githubusercontent.com
199.232.68.133 user-images.githubusercontent.com
199.232.68.133 avatars1.githubusercontent.com
199.232.68.133 avatars2.githubusercontent.com
199.232.68.133 avatars3.githubusercontent.com
199.232.68.133 cloud.githubusercontent.com
140.82.113.6 api.github.com
保存,重启网络服务
systemctl restart network
安装非常简单,执行这些命令将会让 Prometheus 服务器在端口 9090 中运行。
Prometheus 在端口9090上的仪表板如下图所示:

如前所述,从 Prometheus 中抓取的指标发生在恒定的时间段内,因此可以在路径 /metrics 中查看它们。


这些指标用于形成具有各种聚合函数的复杂表达式,以我们想要的形式进行可视化,这在 promql 的帮助下基本上是可能的。Prometheus 中的图形可视化非常基本,没有提供太多自定义,因此我们将使用 Grafana。
二、node_exporter 安装
Releases · prometheus/node_exporter · GitHub # 查看node_exporter版本列表
cd /data/server
wget -c https://github.com/prometheus/node_exporter/releases/download/v1.6.1/node_exporter-1.6.1.linux-amd64.tar.gz #下载node_exporter-1.6.1.linux-amd64.tar.gz
[root@bogon server]# tar -xzf node_exporter-1.6.1.linux-amd64.tar.gz #解压出来
[root@bogon node_exporter-1.6.1.linux-amd64]# nohup ./node_exporter > node_exporter.log 2>&1 & ### 该命令在后台执行 node_exporter 脚本,并重定向输入到当前目录下的 node_exporter.log 文件

此时,可以使用 ps -ef | grep node 命令确认node_exporter是否启动,或者使用 ss -tlnp 都可以;

启动之后,就可以在浏览器中输入:http://172.20.26.204:9100/metrics 进行访问了。如下图:

可见,当前 node exporter 获取到的当前主机的所有监控数据。
配置 node_exporter 的 service 文件,设置开机启动
[root@bogon node_exporter-1.6.1.linux-amd64]# vim /usr/lib/systemd/system/node_exporter.service
[Unit]
Description=node_export
Documentation=https://github.com/prometheus/node_exporter
After=network.target
[Service]
Type=simple
ExecStart= /data/server/node_exporter-1.6.1.linux-amd64 /node_exporter
Restart=on-failure
[Install]
WantedBy=multi-user.target
[root@bogon node_exporter-1.6.1.linux-amd64]# systemctl daemon-reload
[root@bogon node_exporter-1.6.1.linux-amd64]# systemctl restart node_exporter
[root@bogon node_exporter-1.6.1.linux-amd64]# systemctl status node_exporter
● node_exporter.service - node_export
Loaded: loaded (/usr/lib/systemd/system/node_exporter.service; disabled; vendor preset: disabled)
Active: active (running) since 二 2023-08-08 09:18:56 CST; 6s ago
Docs: https://github.com/prometheus/node_exporter
Main PID: 8381 (node_exporter)
CGroup: /system.slice/node_exporter.service
└─8381 /data/server/node_exporter-1.6.1.linux-amd64/node_exporter
8月 08 09:18:56 bogon node_exporter[8381]: ts=2023-08-08T01:18:56.452Z caller=node_exporter.go:117 level=info collector=thermal_zone
8月 08 09:18:56 bogon node_exporter[8381]: ts=2023-08-08T01:18:56.452Z caller=node_exporter.go:117 level=info collector=time
8月 08 09:18:56 bogon node_exporter[8381]: ts=2023-08-08T01:18:56.452Z caller=node_exporter.go:117 level=info collector=timex
8月 08 09:18:56 bogon node_exporter[8381]: ts=2023-08-08T01:18:56.452Z caller=node_exporter.go:117 level=info collector=udp_queues
8月 08 09:18:56 bogon node_exporter[8381]: ts=2023-08-08T01:18:56.452Z caller=node_exporter.go:117 level=info collector=uname
8月 08 09:18:56 bogon node_exporter[8381]: ts=2023-08-08T01:18:56.452Z caller=node_exporter.go:117 level=info collector=vmstat
8月 08 09:18:56 bogon node_exporter[8381]: ts=2023-08-08T01:18:56.452Z caller=node_exporter.go:117 level=info collector=xfs
8月 08 09:18:56 bogon node_exporter[8381]: ts=2023-08-08T01:18:56.452Z caller=node_exporter.go:117 level=info collector=zfs
8月 08 09:18:56 bogon node_exporter[8381]: ts=2023-08-08T01:18:56.452Z caller=tls_config.go:274 level=info msg="Listening on" address=[::]:9100
8月 08 09:18:56 bogon node_exporter[8381]: ts=2023-08-08T01:18:56.452Z caller=tls_config.go:277 level=info msg="TLS is disabled." http2=false address=[::]:9100

wget https://github.com/prometheus/node_exporter/releases/download/v1.0.1/node_exporter-1.0.1.linux-amd64.tar.gz
tar -xzf node_exporter-1.0.1.linux-amd64.tar.gz
cd node_exporter-1.0.1.linux-amd64/
./node_exporter
上述命令将安装节点 exporter 并在端口 9100 上运行,并且可以从 /metrics 扩展中抓取指标。
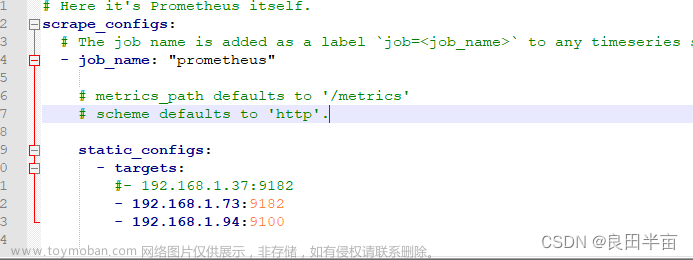
我创建了 3 个虚拟机并在所有虚拟机中安装了节点 exporter,以提供更好的可视化效果。所以在安装之后,我们必须告诉 Prometheus 从哪里抓取指标,这可以通过编辑 prometheus.yml 文件来完成。我们只需要在 scrape_configs 中添加一个新作业,指定目标中的 IP 地址和端口。在 prometheus.yml 文件中添加目标并重新启动 Prometheus 服务器后,我们可以在仪表板以及 /targets 路径中看到新目标及其状态。


确保所有目标都已启动,如果没有,请检查是否为该 VM 实例开放了 9100 端口。你还可以查看 Prometheus 从每个 exporter 抓取的时间以及上次抓取的时间。
Grafana 安装

Download Grafana | Grafana Labs #可以选择Grafana的版本进行下载
wget -c https://dl.grafana.com/enterprise/release/grafana-enterprise-10.0.3.linux-amd64.tar.gz #下载grafana-enterprise-10.0.3.linux-amd64.tar.gz 安装包
tar -zxvf grafana-enterprise-10.0.3.linux-amd64.tar.gz #解压出来
wget https://dl.grafana.com/oss/release/grafana-7.1.5.linux-amd64.tar.gz
tar -xzf grafana-7.1.5.linux-amd64.tar.gz
cd grafana-7.1.5.linux-amd64/
./bin/grafana-server
通过运行上述命令即可完成安装,Grafana 运行在端口 3000。默认的用户名和密码均为“admin”。
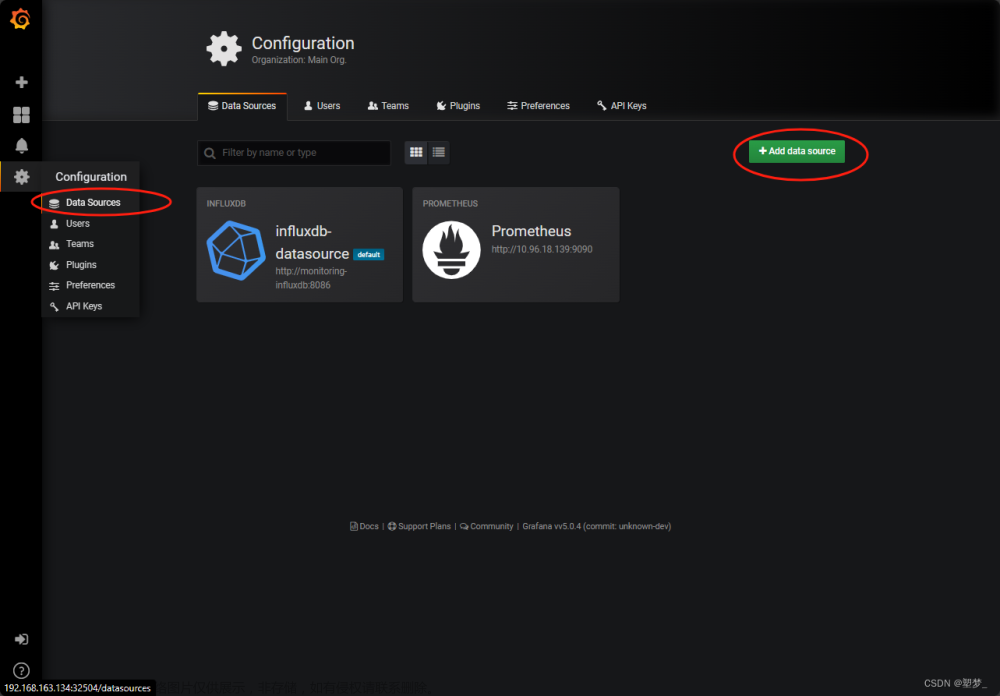
当我们进入仪表板,我们需要添加一个数据源,在我们的例子中是 Prometheus。我们只需要提供 Prometheus URL 并点击保存和测试按钮。如果我们看到一个成功的提示框,说数据源正在工作,那么我们就可以开始了。

我们可以使用自定义的查询语句创建自己的仪表板和面板,但这是一项乏味的工作。因此,为了简化我们的工作,其他用户已经创建了一些仪表板,我们可以使用相同的仪表板并根据我们的需要调整表达式。我使用的是 1860 和 405,这些是我们导入仪表板的唯一ID。


导入完成后,我们会看到基于其表达式和时间范围的图表。你可以通过将时间范围减少到 5 分钟来深入了解。


Grafana 还允许我们查看合并多个 exporter的表单,以便更好地进行比较。


所以在上面的图片中,我们可以看到所有三个节点 exporter 的数据都被可视化了。文章来源:https://www.toymoban.com/news/detail-802103.html
以上总结了 Prometheus 和 Grafana 的基本设置,用来可视化节点指标数据。文章来源地址https://www.toymoban.com/news/detail-802103.html
到了这里,关于Prometheus + Grafana 实现服务器的可视化的文章就介绍完了。如果您还想了解更多内容,请在右上角搜索TOY模板网以前的文章或继续浏览下面的相关文章,希望大家以后多多支持TOY模板网!


