moblieperf下载和使用
moblieperf由阿里巴巴开源的Android性能测试工具
下载:官方源码地址mobileperf github
使用:
- 使用pycharm打开下载的项目
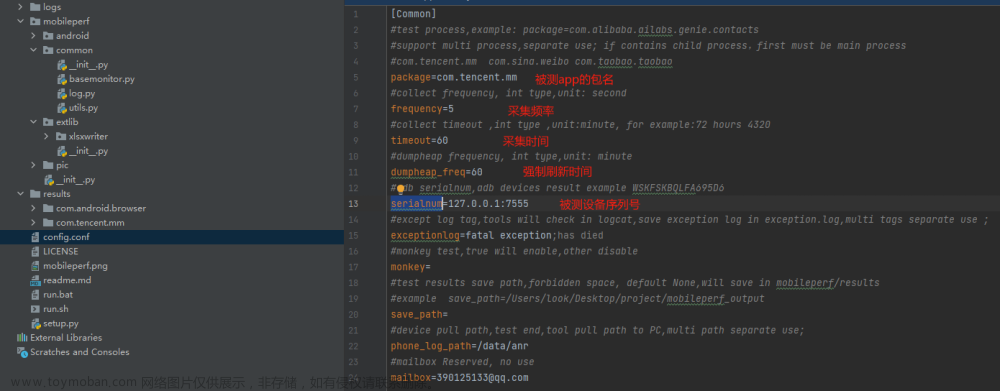
- 使用只需要修改配置文件config.conf即可
- 运行采集:a.mac、linux 在mobileperf工具根目录下执行sh run.sh ; b.windows 双击run.bat
配置图:(简单使用只需要修改包名和设备序列号即可)
源码阅读
原来我们主要阅读我们想实现功能是如何实现的(cpu,内存)
我们先从启动类StartUp中run方法看起:
for i in range(0,5):
    if self.device.adb.is_connected(self.serialnum):
        is_device_connect = True
        break
    else:
        logger.error("device not found:"+self.serialnum)
        time.sleep(2)
self.serialnum就是配置表中的设备序列号,这一段是用过ADB类中的静态方法is_connected实现的,我们来看一下他们是怎么检查配置中的手机是否链接
@staticmethod
def is_connected(device_id):
    '''
                检查设备是否连接上
    '''
    if device_id in ADB.list_device():
        return True
    else:
        return False
    @staticmethod
    def list_device():
        '''获取设备列表

        :return: 返回设备列表
        :rtype: list
        '''
        proc = subprocess.Popen("adb devices", stdout=subprocess.PIPE, shell=True)
        result = proc.stdout.read()
        if not isinstance(result, str):
            result = result.decode('utf-8')
        result = result.replace('\r', '').splitlines()
        logger.debug("adb devices:")
        logger.debug(result)
        device_list = []
        for device in result[1:]:
            if len(device) <= 1 or not '\t' in device: continue
            if device.split('\t')[1] == 'device':
                # 只获取连接正常的
                device_list.append(device.split('\t')[0])
        return device_list
通过这一段代码我们可以发现,mobileperf是基于adb命令去读取相应的信息,而他的使用是通过subprocess类中的Popen去操作adb命令,通过adb devices命令判断是否已经链接成功
注:subprocess是python标准库兼容性较好,且是非阻塞性执行,在输入输出的拓展性、错误处理都比较健全完善,后面会在提到这个方法使用。
  # 对是否安装被测app的检查 只在最开始检查一次
        if not self.device.adb.is_app_installed(self.packages[0]):
            logger.error("test app not installed:" + self.packages[0])
            return
        try:
            #初始化数据处理的类,将没有消息队列传递过去,以便获取数据,并处理
            # datahandle = DataWorker(self.get_queue_dic())
            # 将queue传进去,与datahandle那个线程交互
            self.add_monitor(CpuMonitor(self.serialnum, self.packages, self.frequency, self.timeout))
            self.add_monitor(MemMonitor(self.serialnum, self.packages, self.frequency, self.timeout))
这里我们节选了一部分代码,当我们知道他基本实现逻辑其实我们大致也可以猜到is_app_installed判断app是否安装他是如何实现的!应该也是通过adb命令去寻找已安装的包是否存在
    def is_app_installed(self, package):
        '''
        判断app是否安装
        '''
        if package in self.list_installed_app():
            return True
        else:
            return False
    def list_installed_app(self):
        '''
                        获取已安装app列表
        :return: 返回app列表
        :rtype: list
        '''
        result = self.run_shell_cmd('pm list packages')
        result = result.replace('\r', '').splitlines()
        logger.debug(result)
        installed_app_list = []
        for app in result:
            if not 'package' in app: continue
            if app.split(':')[0] == 'package':
                # 只获取连接正常的
                installed_app_list.append(app.split(':')[1])
        logger.debug(installed_app_list)
        return installed_app_list
正如我们所料,他是用过命令adb shell pm list packages 返回的接口进行切割拿到包名,去判断需要测试包名是否在其中
那么他是采集和收集内存/cpu等信息是不是也是这样实现的呢,答案是肯定的
        end_time = time.time() + self._timeout
        cpu_title = ["datetime", "device_cpu_rate%", "user%", "system%","idle%"]
        cpu_file = os.path.join(RuntimeData.package_save_path, 'cpuinfo.csv')
        for i in range(0, len(self.packages)):
            cpu_title.extend(["package", "pid", "pid_cpu%"])
        if len(self.packages) > 1:
            cpu_title.append("total_pid_cpu%")
        try:
            with open(cpu_file, 'a+') as df:
                csv.writer(df, lineterminator='\n').writerow(cpu_title)
        except RuntimeError as e:
            logger.error(e)
        while not self._stop_event.is_set() and time.time() < end_time:
            try:
                logger.debug("---------------cpuinfos, into _collect_package_cpu_thread loop thread is : " + str(threading.current_thread().name))
                before = time.time()
                #为了cpu值的准确性,将采集的时间间隔放在top命令中了
                cpu_info = self._top_cpuinfo()
                after = time.time()
                time_consume = after - before
                logger.debug("  ============== time consume for cpu info : "+str(time_consume))
这里我们截取了一段收集cpu的代码,可以发现他是通过一个while循环去调用_top_cpuinfo方法
    def _top_cpuinfo(self):
        self._top_pipe = self.device.adb.run_shell_cmd(self.top_cmd, sync=False)
        out = self._top_pipe.stdout.read()
        error = self._top_pipe.stderr.read()
我们接着往下看
    def run_shell_cmd(self, cmd, **kwds):
        '''执行 adb shell 命令
        '''
        # 如果失去连接后,adb又正常连接了
        if not self.before_connect and self.after_connect:
            cpu_uptime_file = os.path.join(RuntimeData.package_save_path, "uptime.txt")
            with open(cpu_uptime_file, "a+",encoding = "utf-8") as writer:
                writer.write(TimeUtils.getCurrentTimeUnderline() + " /proc/uptime:" + self.run_adb_cmd("shell cat /proc/uptime") + "\n")
            self.before_connect = True
        ret = self.run_adb_cmd('shell', '%s' % cmd, **kwds)
        # 当 adb 命令传入 sync=False时,ret是Poen对象
        if ret == None:
            logger.error(u'adb cmd failed:%s ' % cmd)
        return ret
不难发现,最终依旧是调用的run_adb_cmd方法去执行的adb命令,最后把收集到数据写入对应文件中,看到这里我们大概可以自己实现一下了
开发自己的安卓性能工具
注:这里工具页面开发我们使用gui开发工具pyside6
前面我们提到了标准库subprocess这里介绍一下我们会用到的两个方法communicate从子进程的stdout和stderr读取数据。这个方法会阻塞主程序,直到子进程完成,poll检查子进程是否结束,如果子进程正常退出,输出应该为 0;否则为非0值
页面简单拖拽

ui文件转换py文件(performanceTools.py)
pyside6-uic <ui文件名>.ui -o <py文件名>.py
# -*- coding: utf-8 -*-

################################################################################
## Form generated from reading UI file 'performanceTools.ui'
##
## Created by: Qt User Interface Compiler version 6.6.1
##
## WARNING! All changes made in this file will be lost when recompiling UI file!
################################################################################

from PySide6.QtCore import (QCoreApplication, QDate, QDateTime, QLocale,
    QMetaObject, QObject, QPoint, QRect,
    QSize, QTime, QUrl, Qt)
from PySide6.QtGui import (QBrush, QColor, QConicalGradient, QCursor,
    QFont, QFontDatabase, QGradient, QIcon,
    QImage, QKeySequence, QLinearGradient, QPainter,
    QPalette, QPixmap, QRadialGradient, QTransform)
from PySide6.QtWidgets import (QApplication, QHBoxLayout, QLabel, QLineEdit,
    QPushButton, QSizePolicy, QVBoxLayout, QWidget)

class Ui_Form(object):
    def setupUi(self, Form):
        if not Form.objectName():
            Form.setObjectName(u"Form")
        Form.resize(400, 300)
        self.horizontalLayoutWidget = QWidget(Form)
        self.horizontalLayoutWidget.setObjectName(u"horizontalLayoutWidget")
        self.horizontalLayoutWidget.setGeometry(QRect(20, 90, 201, 80))
        self.horizontalLayout = QHBoxLayout(self.horizontalLayoutWidget)
        self.horizontalLayout.setObjectName(u"horizontalLayout")
        self.horizontalLayout.setContentsMargins(0, 0, 0, 0)
        self.label = QLabel(self.horizontalLayoutWidget)
        self.label.setObjectName(u"label")

        self.horizontalLayout.addWidget(self.label)

        self.packagename = QLineEdit(self.horizontalLayoutWidget)
        self.packagename.setObjectName(u"packagename")

        self.horizontalLayout.addWidget(self.packagename)

        self.verticalLayoutWidget = QWidget(Form)
        self.verticalLayoutWidget.setObjectName(u"verticalLayoutWidget")
        self.verticalLayoutWidget.setGeometry(QRect(230, 30, 160, 231))
        self.verticalLayout = QVBoxLayout(self.verticalLayoutWidget)
        self.verticalLayout.setObjectName(u"verticalLayout")
        self.verticalLayout.setContentsMargins(0, 0, 0, 0)
        self.cold_time_cal_button = QPushButton(self.verticalLayoutWidget)
        self.cold_time_cal_button.setObjectName(u"cold_time_cal_button")

        self.verticalLayout.addWidget(self.cold_time_cal_button)

        self.cold_time_cal_result_button = QPushButton(self.verticalLayoutWidget)
        self.cold_time_cal_result_button.setObjectName(u"cold_time_cal_result_button")

        self.verticalLayout.addWidget(self.cold_time_cal_result_button)

        self.cpuinfo_button = QPushButton(self.verticalLayoutWidget)
        self.cpuinfo_button.setObjectName(u"cpuinfo_button")

        self.verticalLayout.addWidget(self.cpuinfo_button)

        self.cpuinfo_result_button = QPushButton(self.verticalLayoutWidget)
        self.cpuinfo_result_button.setObjectName(u"cpuinfo_result_button")

        self.verticalLayout.addWidget(self.cpuinfo_result_button)


        self.retranslateUi(Form)

        QMetaObject.connectSlotsByName(Form)
    # setupUi

    def retranslateUi(self, Form):
        Form.setWindowTitle(QCoreApplication.translate("Form", u"Form", None))
        self.label.setText(QCoreApplication.translate("Form", u"\u8bf7\u8f93\u5165\u5305\u540d", None))
        self.cold_time_cal_button.setText(QCoreApplication.translate("Form", u"\u51b7\u542f\u52a8\u5e73\u5747\u65f6\u95f4\u7edf\u8ba1", None))
        self.cold_time_cal_result_button.setText(QCoreApplication.translate("Form", u"\u51b7\u542f\u52a8\u65f6\u95f4\u7ed3\u679c\u67e5\u8be2", None))
        self.cpuinfo_button.setText(QCoreApplication.translate("Form", u"CPU\u4fe1\u606f\u6570\u636e\u7edf\u8ba1", None))
        self.cpuinfo_result_button.setText(QCoreApplication.translate("Form", u"CPU\u4fe1\u606f\u6570\u636e\u7ed3\u679c\u67e5\u8be2", None))
    # retranslateUi
adb命令封装(util.py)
import subprocess
class ADB:
    def run_cmd_once(self,cmdStr):
        process = subprocess.Popen(cmdStr, stdin=subprocess.PIPE, stdout=subprocess.PIPE, stderr=subprocess.PIPE,
                                   shell=True)
        # 读取子进程的输出
        stdout, stderr = process.communicate()
        # 如果子进程正常退出,输出应该为 0;否则为非0值
        if process.poll():
            print(f"执行命令:{cmdStr} 失败, {stderr.decode()}")
            return None
        else:
            print(f"执行命令:{cmdStr} 成功, {stdout.decode()}")
            return stdout.decode()

    #查看当前活动页面
    def get_current_activity(self):
        activity_line = ''
        activity_focus = self.run_cmd_once('adb shell dumpsys window | findstr mCurrentFocus')
        #成功运行
        if activity_focus:
            for l in activity_focus.split("\n"):
                #如果存在关键词mCurrentFocus=Window
                if l.find("mCurrentFocus=Window") != -1:
                    activity_line = l.strip().split(" ")
        # mCurrentFocus=Window{ea9aaee u0 com.mumu.store/com.mumu.store.MainActivity}
        if activity_line:
            return activity_line[2].rstrip("}")
    #获取当前活动包名
    def get_current_packagename(self):
        current_activity = self.get_current_activity()
        if current_activity:
            return current_activity.split("/")[0]
    #启动
    def start_activity(self,activity_name):
        result = self.run_cmd_once(f'adb shell am start -S -W {activity_name}')
        return result
    #关闭app
    def stop_app(self, packagename):
        result = self.run_cmd_once(f'adb shell am force-stop {packagename}')
        return result
    #冷启动并获取冷启动的TotalTime
    def get_launchState_cold_totalTime(self,activity_name):
        result = self.start_activity(activity_name)
        for l in result.split("\n"):
            #TotalTime: int
            if l.find("TotalTime") != -1:
                return int(l.split(":")[1])
    #采集cpu信息
    def get_cpuinfo(self, packagename):
        cpuinfo = self.run_cmd_once('adb shell dumpsys cpuinfo')
        for l in cpuinfo.split("\n"):
            if l.find(packagename) != -1:
                total_cpu, user, kernel = [s for s in l.strip(" ").split(" ") if "%" in s]
                return total_cpu, user, kernel
功能实现逻辑代码(appperf.py)文章来源:https://www.toymoban.com/news/detail-825374.html
import time

import pyecharts.charts
from pyecharts import options as opts
from util import ADB
import subprocess
import os
import sys
from PySide6.QtWidgets import QApplication, QWidget, QLabel, QPushButton, QMessageBox
from PySide6.QtCore import Slot, Signal
import performanceTools
import threading

class QmyWeidge(QWidget):
    #建立信号
    packagenameSignal = Signal(str)
    def __init__(self):
        super().__init__()
        self.ui = performanceTools.Ui_Form()
        self.ui.setupUi(self)
        self.cold_time_cal_htmlname = ""
        self.cpuinfo_htmlname = ""
        self.packagenameSignal.connect(self.isPackagenameExciting)#判断包名是否存在信号槽链接
    def open_html_by_firefox(self, local_html_name):
        # 获取当前工作目录
        current_dir = os.getcwd()
        # 指定本地HTML文件的路径
        local_file = os.path.join(current_dir, local_html_name)
        # 指定火狐浏览器的可执行文件路径
        firefox_path = "C:/Program Files/Mozilla Firefox/firefox.exe"  # 替换为你的火狐浏览器可执行文件的路径
        # 构建火狐浏览器的命令行参数
        url = 'file://' + local_file + '.html'
        cmd = [firefox_path, url]
        # 使用subprocess启动火狐浏览器并打开本地HTML文件
        subprocess.Popen(cmd)

    def result_to_html(self, xaxis, yaxis, y_name, title):
        pyecharts.charts.Line().add_xaxis(xaxis).add_yaxis(y_name, yaxis).set_global_opts(
            title_opts=opts.TitleOpts(title=title)).render(path=f'./{title}.html')

    @Slot()
    def on_cold_time_cal_button_clicked(self):
        """
        运行10次取平均值
        :param current_activity: 当前运行的app页面,或者是待测的页面
        :return: 范围运行第x次的数据y
        """
        #按钮置灰
        self.ui.cold_time_cal_button.setEnabled(False)
        self.ui.cold_time_cal_button.repaint()
        self.ui.cold_time_cal_result_button.setEnabled(False)
        self.ui.cold_time_cal_result_button.repaint()

        current_activity = ADB().get_current_activity()
        x = []
        y = []
        for i in range(1, 11):
            x.append(f"第{i}次")
            cold_start_time = ADB().get_launchState_cold_totalTime(current_activity)
            y.append(cold_start_time)
            ADB().stop_app(current_activity)
        #输出结果
        self.cold_time_cal_htmlname = f"冷启动时间趋势图_平均耗时{sum(y) / 10}"
        self.result_to_html(x, y ,"启动时间", self.cold_time_cal_htmlname)
        #恢复按钮
        self.ui.cold_time_cal_button.setEnabled(True)
        self.ui.cold_time_cal_result_button.setEnabled(True)

    @Slot()
    def on_cold_time_cal_result_button_clicked(self):
        self.open_html_by_firefox(self.cold_time_cal_htmlname)

    @Slot()
    def on_cpuinfo_button_clicked(self):
        """
        运行10次取平均值
        :return: 范围运行第x次的数据y
        """
        #按钮置灰
        self.ui.cpuinfo_button.setEnabled(False)
        self.ui.cpuinfo_button.repaint()
        self.ui.cpuinfo_result_button.setEnabled(False)
        self.ui.cpuinfo_result_button.repaint()

        x = []
        y = []
        if self.ui.packagename.text():
            for i in range(1,11):
                x.append(f"第{i}次")
                try:
                    cpu, _, _ = ADB().get_cpuinfo(self.ui.packagename.text())
                    y.append(round(float(cpu.replace('%', '')), 4))
                    time.sleep(2)
                    # 输出结果
                    self.cpuinfo_htmlname = f"cpu占比趋势图_平均占比{sum(y) / 10} %"
                    self.result_to_html(x, y, "cpu占比(%)", self.cpuinfo_htmlname)
                except:
                    msgBox = QMessageBox()
                    msgBox.setWindowTitle("提醒")
                    msgBox.setText(f"{self.ui.packagename.text()}确认是否运行!未获取到对应cpu信息!")
                    msgBox.exec()
                    break
        else:
            self.packagenameSignal.emit(self.ui.packagename.text())

        #恢复按钮
        self.ui.cpuinfo_result_button.setEnabled(True)
        self.ui.cpuinfo_button.setEnabled(True)

    @Slot()
    def on_cpuinfo_result_button_clicked(self):
        self.open_html_by_firefox(self.cpuinfo_htmlname)

    def isPackagenameExciting(self, value):
        if not value :
            msgBox  = QMessageBox()
            msgBox.setWindowTitle("提醒")
            msgBox.setText("请输入包名!")
            msgBox.exec()


if __name__ == '__main__':
    app = QApplication(sys.argv)
    myWindow = QmyWeidge()
    myWindow.show()
    sys.exit(app.exec())
文章来源地址https://www.toymoban.com/news/detail-825374.html
到了这里,关于扒开源安卓性能测试工具moblieperf源码——开发属于你自己的性能稳定性测试工具的文章就介绍完了。如果您还想了解更多内容,请在右上角搜索TOY模板网以前的文章或继续浏览下面的相关文章,希望大家以后多多支持TOY模板网!