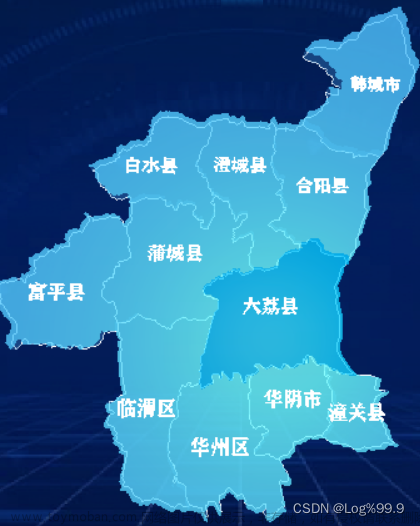
先上效果图

需要查找地图的josn数据、需要引入的js、 和需要安装的依赖如下
1.先获取想要展示地图的区域json数据
阿里云获取地图区域的json
示例为陕西省
2.npm安装three.js和d3 npm i three、 npm i d3
3.引入相关方法和json数据文章来源:https://www.toymoban.com/news/detail-851581.html
import * as THREE from 'three';
import { OrbitControls } from "../../../node_modules/three/examples/jsm/controls/OrbitControls.js"
import { TextGeometry } from '../../../node_modules/three/examples/jsm/geometries/TextGeometry.js';
import { FontLoader } from '../../../node_modules/three/examples/jsm/loaders/FontLoader.js';
import * as d3 from 'd3';
import jsondata from './shanxi.json'
具体代码
<template>
    <div class="center-map-box" id="contant">
    </div>
</template>
 mounted() {
		// 第一步新建一个场景
        this.scene = new THREE.Scene()
        this.contant = document.getElementById('contant')
        // 辅助线
        // const axesHelper = new THREE.AxesHelper(10);
        // this.scene.add(axesHelper);
        // 光源
        this.spotLight = new THREE.PointLight('#fff', 4, 100)
        this.spotLight.position.set(0.2, -0.4, 1)
        this.scene.add(this.spotLight)
        //环境光
        const ambient = new THREE.AmbientLight('#fff', 4)
        this.scene.add(ambient)
        // 可视化点光源
        // const pointLightHelper = new THREE.PointLightHelper(this.spotLight, 0.1)
        // this.scene.add(pointLightHelper)
        this.setCamera()
        this.setRenderer()
        this.generateGeometry()
        this.setClickFn()
        this.setController()
        this.animate()
        window.onresize = () => {
            this.renderer.setSize(this.contant.clientWidth, this.contant.clientHeight);
            this.camera.aspect = this.contant.clientWidth / this.contant.clientHeight;
            this.camera.updateProjectionMatrix();
        };
 }
  methods: {
  	 // 新建透视相机
        setCamera() {
            this.camera = new THREE.PerspectiveCamera(60, this.contant.clientWidth / this.contant.clientHeight, 0.1, 500);
            this.camera.position.z = 10
        },
        // 设置渲染器
        setRenderer() {
            this.renderer = new THREE.WebGLRenderer()
            // 设置画布的大小
            this.renderer.setSize(this.contant.clientWidth, this.contant.clientHeight)
            //这里 其实就是canvas 画布  renderer.domElement
            this.contant.appendChild(this.renderer.domElement)
            this.renderer.setClearColor(0x000000, 0)
        },
        render() {
            this.renderer.render(this.scene, this.camera)
        },
        generateGeometry() {
            // 初始化一个地图对象
            this.map = new THREE.Object3D()

            // 墨卡托投影转换
            const projection = d3
                .geoMercator()
                .center([104.0, 37.5])
                .scale(80)
                .translate([0, 0])

            jsondata.features.forEach((elem) => {
                this.renderer.render(this.scene, this.camera);
                const coordinates = elem.geometry.coordinates
                // 循环坐标数组
                coordinates.forEach((multiPolygon) => {
                    multiPolygon.forEach((polygon, index) => {
                        const province = new THREE.Object3D()
                        const shape = new THREE.Shape()
                        const lineMaterial = new THREE.LineBasicMaterial({
                            color: 'white',
                        })
                        const lineGeometry = new THREE.BufferGeometry()
                        const pointsArray = new Array()
                        for (let i = 0; i < polygon.length; i++) {
                            const [x, y] = projection(polygon[i])
                            if (i === 0) {
                                shape.moveTo(x, -y)
                            }
                            shape.lineTo(x, -y)
                            pointsArray.push(new THREE.Vector3(x, -y, 0))
                        }
                        lineGeometry.setFromPoints(pointsArray)


                        const extrudeSettings = {
                            depth: 0.07,
                            bevelEnabled: false,
                        }

                        const geometry = new THREE.ExtrudeGeometry(
                            shape,
                            extrudeSettings
                        )
                        const material = new THREE.MeshPhongMaterial({
                            color: '#43A7FF',
                            transparent: true,
                            opacity: 0.8,
                        })
                        const material1 = new THREE.MeshBasicMaterial({
                            color: '#3480C4',
                            transparent: true,
                            opacity: 0.4,
                        })
                        const loader = new FontLoader();
                        //字体需放到根目录public下
                        loader.load('./fonts/FZCuHeiSongS-B-GB_Regular.json', (font) => {
                            const fontOption = {
                                font: font,
                                size: 0.07,
                                height: 0.01,
                                curveSegments: 1,
                                bevelThickness: 1,
                                bevelSize: 0,
                                bevelEnabled: false,
                                bevelSegments: 0
                            };
                            const txtMater = new THREE.MeshBasicMaterial({ color: 0xffffff });
                            const txtGeometry = new TextGeometry(name, fontOption);
                            const txtMesh = new THREE.Mesh(txtGeometry, txtMater);
                            const [x, y] = projection(elem.properties.center)
                            txtMesh.position.set(x - 8.3, -y + 4.4, 0.08)
                            if (name == 'xx县') {
                            //这里位置不对可以做微调
                                txtMesh.position.set(x - 8.33, -y + 4.55, 0.08)
                            }
                            this.scene.add(txtMesh);
                        });
                        var name = elem.properties.name;//区县名
                        const mesh = new THREE.Mesh(geometry, [material, material1])
                        const line = new THREE.Line(lineGeometry, lineMaterial)
                        this.materialArr.push(material)
                        province.properties = elem.properties
                        province.add(mesh)
                        province.add(line)
                        this.map.add(province)
                        this.render()
                    })
                })
            })
            this.map.position.set(-8.2, 4.4, 0);
            this.scene.add(this.map);
            this.spotLight.target = this.map;
            this.camera.position.set(0, -0.7, 2.5);
            this.renderer.render(this.scene, this.camera);

        },
        //加事件
        setClickFn() {
            this.raycaster = new THREE.Raycaster();
            this.mouse = new THREE.Vector2();
            const onMouseMove = (event) => {
                var marginLeft = this.contant.offsetLeft
                var marginTop = this.contant.offsetTop + 92
                // 如果该地图不是占满全屏需要减去margintop和marginleft
                // 将鼠标位置归一化为设备坐标。x 和 y 方向的取值范围是 (-1 to +1)
                // this.mouse.x = (event.clientX / this.contant.clientWidth) * 2 - 1;
                // this.mouse.y = -(event.clientY / this.contant.clientHeight) * 2 + 1;
                this.mouse.x = ((event.clientX - marginLeft) / this.contant.clientWidth) * 2 - 1;
                this.mouse.y = -((event.clientY - marginTop) / this.contant.clientHeight) * 2 + 1;
            };

            let clickPosition;
            window.addEventListener("mousemove", onMouseMove, false);
            const onclick = (event) => {
                var marginLeft = this.contant.offsetLeft
                var marginTop = this.contant.offsetTop
                // let x = (event.clientX / this.contant.clientWidth) * 2 - 1;
                // let y = -(event.clientY / this.contant.clientHeight) * 2 + 1;
                // 如果该地图不是占满全屏需要减去margintop和marginleft
                let x = ((event.clientX - marginLeft) / this.contant.clientWidth) * 2 - 1;
                let y = -((event.clientY - marginTop) / this.contant.clientHeight) * 2 + 1;
                clickPosition = { x: x, y: y };
                this.raycaster.setFromCamera(clickPosition, this.camera);
                // 算出射线 与当场景相交的对象有那些
                const intersects = this.raycaster.intersectObjects(this.scene.children, true);
                let clickObj = intersects.find(
                    (item) => item.object.material && item.object.material.length === 2
                );
                // 点击区县
                if (clickObj && clickObj.object) {
                	console.log(clickObj)
                    // this.$emit('clickAreaCheck',clickObj)
                }
            };
            window.addEventListener("mousedown", onclick, false);
        },
        // 设置最大旋转的角度
        setController() {
            const controls = new OrbitControls(this.camera, this.renderer.domElement);
            controls.maxPolarAngle = 2.5
            controls.minPolarAngle = 1
            controls.maxAzimuthAngle = 1
            controls.minAzimuthAngle = -1
            controls.addEventListener("change", () => {
                this.renderer.render(this.scene, this.camera);
            });
        },
         animate() {
            window.requestAnimationFrame(this.animate);
            this.raycaster.setFromCamera(this.mouse, this.camera);
            this.renderer.render(this.scene, this.camera);
        },
  }
该文章只做记录,具体在场景中使用中自己调整。文章来源地址https://www.toymoban.com/news/detail-851581.html
到了这里,关于threejs+vue 省份3D可视化地图的文章就介绍完了。如果您还想了解更多内容,请在右上角搜索TOY模板网以前的文章或继续浏览下面的相关文章,希望大家以后多多支持TOY模板网!